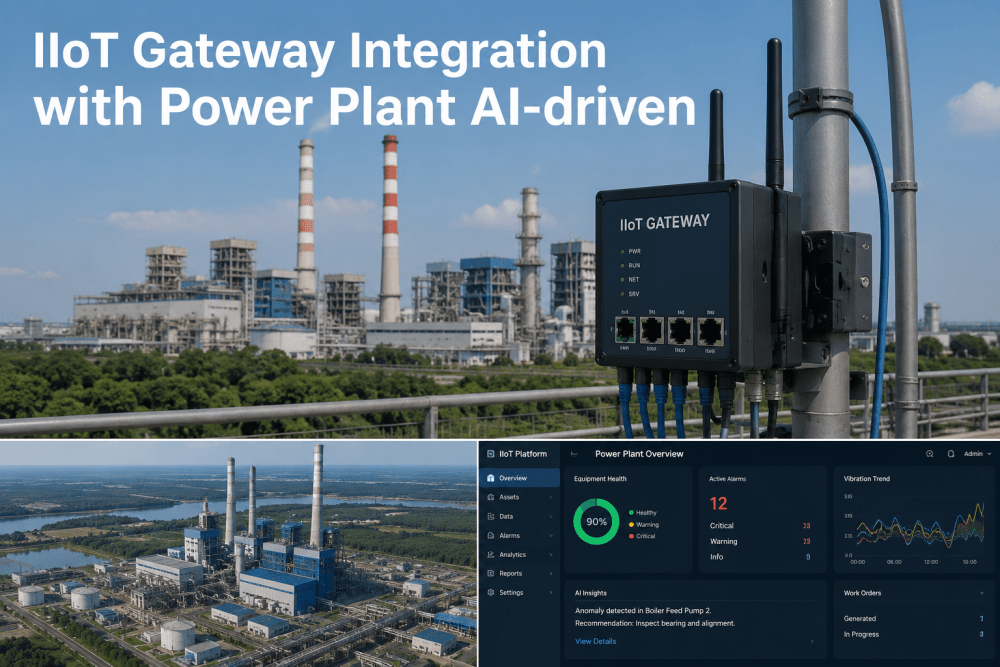
Most power plant control systems were designed in an era when the data they generated stayed inside the control system. A DCS alarm fired. An operator acknowledged it. A technician responded. A work order was written on paper or entered into CMMS by hand, hours after the event, by someone who had to walk back to the control room to look up the tag name and the time of the alert. The data that would have been most useful for planning the maintenance response — sensor trend that preceded the alarm, the operational context at the time of the event, the comparison to prior events on the same asset — existed in the historian and the CMMS as separate, disconnected records that required human effort to connect. An IIoT edge gateway changes this architecture by sitting between the plant floor instrumentation layer and the AI-driven analytics platform — translating PLC, DCS, OPC-UA, and Modbus data streams into structured feeds that the analytics platform can ingest, classify, and act on without a human routing the connection at each step. The gateway does not replace the control system. It does not require rerouting control signals. It reads data from existing infrastructure at the instrument or PLC level, normalizes it into a standardized protocol, and forwards it to the analytics platform where condition-based work orders, anomaly alerts, and performance trend reports are generated automatically. For U.S. power plant operations and maintenance leaders who have watched AI analytics demonstrations that show compelling results from sensor data but have come back to a facility where getting that data to the analytics platform requires months of IT integration work, the IIoT gateway is the hardware layer that makes the deployment practical. This guide explains how edge gateways work, what the integration architecture looks like at a typical power plant, and what condition-based work order automation becomes possible once the gateway is in place.
Ready to close the gap between your plant floor sensor data and your AI-driven analytics platform? Schedule your IIoT gateway integration assessment with iFactory's industrial connectivity team.
What an IIoT Edge Gateway Does — and Why the Integration Gap Exists
The integration gap between plant floor instrumentation and AI-driven analytics platforms at power plants is not a data gap — it is a translation and connectivity gap. The sensor data exists. Motor current, vibration, temperature, pressure, flow, and position data is being collected and stored in the historian. The challenge is that this data is structured in formats, protocols, and naming conventions that were designed for the control system, not for an analytics platform that needs normalized, tagged, and continuously streamed data to run condition monitoring models. An IIoT edge gateway bridges this gap by operating as an intelligent data translator at the equipment level.
Protocol Fragmentation
A single power plant may have Modbus RTU on legacy instruments, OPC-DA on older DCS systems, OPC-UA on newer equipment, HART on field devices, and proprietary protocols on OEM equipment — all collecting data that no single system can ingest natively
NERC CIP Security Perimeter
Direct connections from analytics platforms to BES cyber assets are constrained by NERC CIP access controls — an edge gateway with unidirectional data flow provides the isolation architecture that allows analytics without violating the Electronic Security Perimeter
IT/OT Organizational Friction
Analytics platform connections typically require IT security approval and OT engineering sign-off — a process that can extend deployment timelines by months when approached as a direct integration; edge gateways with standardized HTTPS/MQTT output simplify this approval path significantly
Tag Naming Inconsistency
Historian tag names assigned at plant commissioning often reflect contractor naming conventions that do not map cleanly to equipment identifiers in the CMMS or the asset hierarchy the analytics platform needs to associate sensor data with the right equipment record
The IIoT Gateway Integration Architecture: How Data Flows from Sensor to Work Order
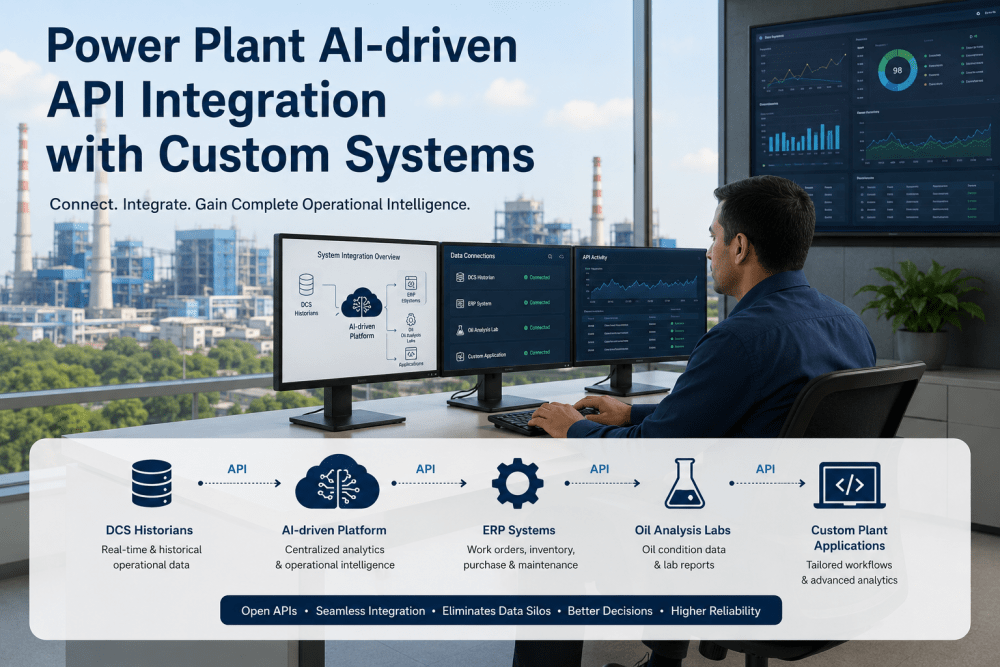
The integration architecture that connects plant floor sensors to automated CMMS work orders through an IIoT gateway involves five distinct layers, each performing a specific function in the chain from physical measurement to actionable maintenance decision. Understanding this layered architecture is essential for evaluating gateway solutions and for structuring the deployment plan at a specific facility.
Sensor and Instrument Layer — Physical Measurement
Existing plant instruments — current transformers, vibration sensors, temperature transmitters, pressure transducers, flow meters, and valve position indicators — are the data source. The IIoT gateway does not require new sensor installation at this layer for most auxiliary and BOP equipment; it connects to existing instrument signals at the field junction box, the PLC I/O card, or the historian data export point, depending on the facility's infrastructure and the NERC CIP boundary configuration.
Edge Gateway Layer — Protocol Translation and Local Processing
The IIoT edge gateway reads instrument and PLC data using the native protocol at each connection point — Modbus, OPC-UA, OPC-DA, HART, DNP3, or proprietary formats — and translates everything into a standardized output format (typically MQTT or HTTPS/JSON) for transmission to the analytics platform. Critically, the gateway also performs local preprocessing: data quality filtering, timestamp normalization, configurable sampling rates, and local alarming for connectivity loss. Edge processing means the gateway continues capturing and buffering data during cloud connectivity outages, synchronizing when connection is restored.
Data Normalization and Asset Mapping — Connecting Sensors to Equipment Records
The normalized data stream from the gateway is mapped to the analytics platform's asset hierarchy — connecting each sensor tag to the specific equipment record it monitors: motor 1A on condensate pump CP-101, bearing 3 on gas turbine GT-01, inlet guide vane actuator on unit 2 compressor. This asset mapping is configured during the platform deployment and is maintained as equipment changes occur. Without this mapping, sensor data is unstructured; with it, every anomaly detection result is automatically associated with the correct equipment record, work order history, and maintenance context.
AI Analytics Layer — Condition Monitoring and Anomaly Classification
The structured, asset-mapped data stream feeds the analytics platform's condition monitoring models — physics-based performance baselines, motor current signature analysis, vibration trend algorithms, and failure mode classification models. These models run continuously against the live data stream, comparing current sensor readings to the established healthy-condition baseline for each asset and flagging deviations that match the pattern of specific failure modes. The result of this layer is not a raw sensor alert — it is a classified finding: "Condensate pump CP-101 showing cavitation signature — 78% confidence — estimated 60–120 hours to threshold failure based on current progression rate."
Automated Work Order Dispatch — Closing the Loop to the CMMS
High-confidence findings from the analytics layer trigger automatic work order generation in the connected CMMS — SAP PM, IBM Maximo, or Infor EAM — with the equipment identifier, failure mode classification, recommended inspection scope, estimated urgency window, and supporting sensor trend data pre-populated in the work order record. The maintenance planner receives a complete, actionable work order rather than a sensor alert requiring manual data assembly. Medium-confidence findings route to a review queue. Low-confidence deviations go to a monitoring watch list. Each routing is configurable per asset category and per workflow type.
Want to see this integration architecture demonstrated against your facility's specific PLC and historian infrastructure? Book a free IIoT gateway integration assessment with iFactory's industrial connectivity team.
Protocol Support and Connectivity: What Industrial Systems the Gateway Handles
Power plants built and expanded over multiple decades carry a mix of instrumentation vintages, control system generations, and communication protocols that reflect the state of industrial automation at each phase of the facility's history. A gateway deployment must handle this diversity without requiring equipment upgrades or control system replacements. The table below maps the primary protocol families found at U.S. power plants against their typical applications and the gateway's integration approach for each.
Ready to close the gap between your plant floor sensor data and your AI-driven analytics platform? Schedule your IIoT gateway integration assessment with iFactory's industrial connectivity team.
Before vs. After IIoT Gateway Deployment: The Operational Difference
The most concrete way to understand the value of IIoT gateway integration is to compare the maintenance workflow for the same event — an emerging bearing fault on a condensate pump — under the pre-gateway and post-gateway operating model. The comparison below maps every step in that workflow and shows where the time, effort, and coordination lag that accounts for the gap between detection and response disappears when the gateway is in place.
Expert Review: What Plant Engineers Say About IIoT Gateway Integration
"I have been involved in analytics platform deployments at power plants for fourteen years. The single most consistent barrier to getting value from AI condition monitoring is not the analytics capability — it is getting clean, structured, continuously streamed sensor data from the plant floor to the platform where the analytics runs. That connectivity problem is where every deployment I have been involved in has spent the most time. Legacy protocols, NERC CIP boundary issues, IT approval timelines, historian tag naming that does not match the CMMS asset hierarchy — these are real problems that consume months and erode the business case before the first anomaly is ever detected. The edge gateway architecture that standardizes the connection to MQTT or HTTPS output with read-only access solves most of these barriers simultaneously. The OT team signs off on a read-only connection from an instrument junction box. The IT team approves a standard encrypted HTTPS connection to a cloud platform endpoint. The NERC CIP team reviews a unidirectional data flow that does not cross the ESP. None of these approvals require six months of committee review when the architecture is designed correctly from the start. What I tell every operations leader who asks about AI analytics for their plant is this: the analytics is the easy part. The gateway architecture is the part that determines whether you are collecting value in six weeks or still in the IT approval queue in six months."
Conclusion
The IIoT edge gateway is the hardware and protocol layer that makes AI-driven condition monitoring and automated work order dispatch practical at real power plants with real control system complexity. The analytics value — continuous anomaly detection, failure mode classification, 48 to 72 hours of advance warning before equipment fails — is only available when the sensor data from the plant floor reaches the analytics platform in a clean, normalized, continuously updated stream. Without a gateway architecture that handles protocol translation, NERC CIP boundary compliance, and asset mapping, that sensor data sits in the historian, occasionally reviewed by an engineer who happens to pull the right trend at the right time, generating none of the systematic maintenance intelligence that the AI platform is designed to produce.
The deployment path is shorter than most operations leaders expect. A read-only gateway connection to an existing historian or PLC does not require control system modifications, does not cross the NERC CIP Electronic Security Perimeter when configured correctly, and does not require IT infrastructure upgrades. The gateway installs in days. The asset mapping and AI model calibration complete in four to six weeks. The first automated condition-based work orders arrive in the CMMS within six weeks of installation — and the facility begins accumulating the detection lead time and work order quality improvements that generate the measurable maintenance and outage prevention savings that justify the investment.
Ready to close the gap between your plant floor sensor data and your AI-driven analytics platform? Schedule your IIoT gateway integration assessment with iFactory's industrial connectivity team.
Frequently Asked Questions
Connect Your Plant Floor Sensors to Automated Work Orders in Six Weeks
iFactory's IIoT gateway integration bridges the gap between your existing PLC, DCS, and historian infrastructure and the AI-driven analytics platform that generates condition-based work orders — without control system modifications, without NERC CIP violations, and without months of IT approval delays.