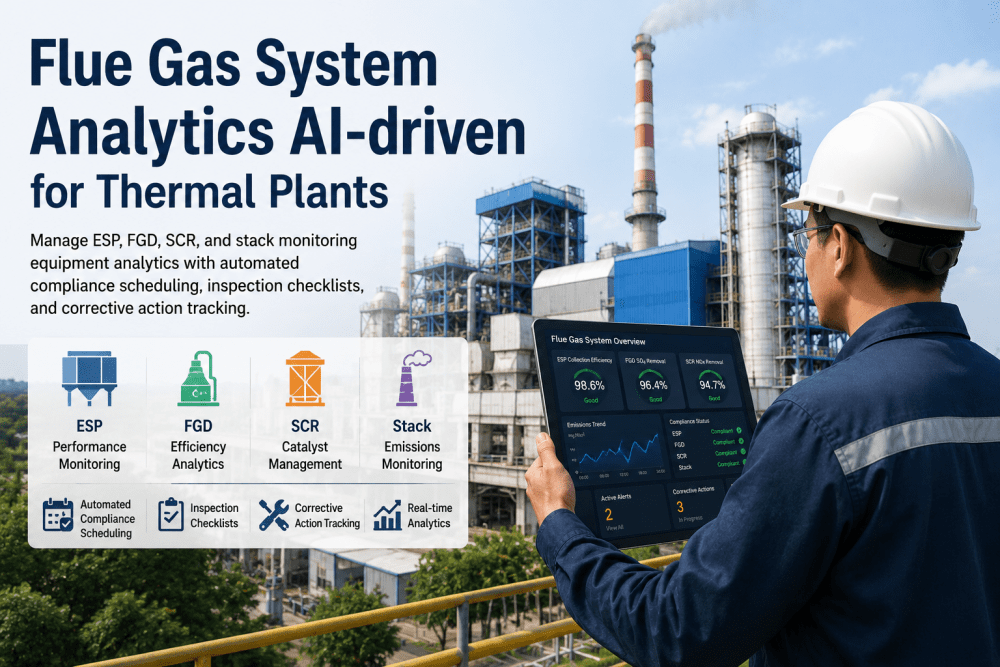
Flue gas treatment systems at U.S. thermal power plants — electrostatic precipitators, fabric filter baghouses, selective catalytic reduction units, flue gas desulfurization scrubbers, and continuous emissions monitoring stacks — are simultaneously the facility's most heavily regulated assets and its most maintenance-neglected ones. They generate EPA compliance obligations on a daily, quarterly, and annual basis. They carry civil penalty exposure of up to $70,117 per day violation under Clean Air Act enforcement. And they are typically managed through a fragmented combination of paper inspection checklists, spreadsheet-based CEMS data logs, and calendar-triggered PM schedules that were designed for a regulatory environment that no longer exists. The AI-driven analytics platform that closes this gap does three things that the spreadsheet cannot: it tracks every inspection, every corrective action, and every compliance deadline for every component across the entire flue gas treatment train in a single connected record; it generates automated alerts when inspection windows approach or corrective actions remain open past their due date; and it produces the audit-ready documentation packages that EPA Region inspectors and state environmental agencies expect — in seconds rather than days. This guide maps the specific analytics workflows that iFactory's AI-driven platform delivers for ESP, FGD, SCR, and CEMS equipment, and explains what changes operationally and financially when compliance scheduling becomes systematic rather than reactive.
Is Your Flue Gas Compliance Program Built on Spreadsheets and Paper Checklists?
iFactory's AI-driven analytics platform centralizes ESP, FGD, SCR, and CEMS compliance scheduling, inspection documentation, and corrective action tracking — delivering audit-ready records and automated compliance alerts from a single connected system.
Why Flue Gas System Compliance Fails at Most Thermal Power Plants — and What a Connected Analytics Platform Changes
The compliance failure at most thermal power plants is not a regulatory knowledge failure — plant environmental managers understand the requirements thoroughly. It is a data architecture failure. CEMS data lives in the CEMS software. ESP inspection records live in a maintenance supervisor's binder. FGD lime slurry feed records live in a DCS historian that the environmental team cannot access without IT involvement. SCR reagent consumption logs live in a separate ERP module. And the corrective action tracking for any out-of-compliance finding lives in an email chain that may or may not have been resolved before the next inspection window opens. When an EPA inspector arrives or a state agency requests a compliance demonstration, assembling these disconnected records into a coherent compliance package requires days of manual work from multiple departments — creating both a labor cost and a documentation accuracy risk that a connected analytics platform eliminates.
ESP Performance Tracking
Electrostatic precipitator performance degrades through field wire corrosion, rapper failure, high-voltage power supply degradation, and hopper pluggage — each of which produces a measurable opacity trend before reaching a violation threshold. iFactory tracks rapper cycle performance, power supply current-voltage curves, and opacity trend data continuously, flagging developing faults before they become compliance events.
FGD System Compliance Scheduling
Wet limestone and spray dry FGD systems require continuous monitoring of SO2 removal efficiency, reagent feed rates, slurry density, absorber pressure drop, and recirculation pump performance. iFactory integrates these metrics with compliance scheduling — generating work orders for required inspections, tracking corrective actions from SO2 exceedance events, and maintaining the reagent quality records that Title V permits require.
SCR Catalyst Monitoring and NOx Compliance
Selective catalytic reduction systems require tracking of catalyst activity, ammonia slip, reagent injection rates, and reactor differential pressure against seasonal NOx emission limits. iFactory's SCR analytics module tracks these parameters in real time, generates alerts when catalyst performance degrades toward the replacement threshold, and maintains the ammonia slip monitoring records required by state implementation plans.
CEMS Data Validation and Reporting
Continuous emissions monitoring systems generate compliance data that must be validated, quality-assured, and reported under 40 CFR Part 75 on a quarterly basis. iFactory integrates with CEMS data acquisition systems to track data availability percentages, flag quality assurance test due dates, document calibration results, and generate the compliance reports that Acid Rain Program and CSAPR quarterly reporting requires.
Fragmented vs. Connected: What Changes When Flue Gas Compliance Is Managed Through a Single AI-Driven Platform
The operational difference between managing flue gas system compliance through disconnected spreadsheets and managing it through iFactory's connected analytics platform is visible in every dimension of the compliance workflow — from inspection scheduling through corrective action closure to audit package preparation. The comparison below maps these differences across the specific tasks that environmental compliance teams perform weekly and monthly at thermal power plants.
| Compliance Workflow | Fragmented Approach (Current State) | iFactory AI-Driven Platform | Operational Impact |
|---|---|---|---|
| ESP Inspection Scheduling | Calendar reminders in Outlook, missed when personnel changes occur | Automated scheduling based on operating hours and permit requirements, with escalating alerts | Zero missed inspection windows |
| FGD Opacity Exceedance Response | Manual email notification to maintenance, corrective action tracked informally | Auto-generated corrective action work order with required closure timeline and documentation fields | Documented response within required regulatory timeframe |
| SCR Catalyst Performance History | Scattered across DCS trend files, maintenance logs, and paper catalyst test reports | Unified catalyst performance record from installation through each annual performance test | Instant access for permit renewal and enforcement response |
| CEMS Quarterly Report Preparation | 2–4 weeks of manual data extraction, validation, and report assembly per quarter | Automated data aggregation with QA flag review, reducing preparation to 2–3 days | 85% reduction in compliance reporting labor |
| Stack Test Coordination | Test contractor schedules managed separately from plant maintenance calendar | Stack test events integrated with maintenance work orders, pre-test equipment checks, and post-test result storage | Fewer test failures from equipment condition issues |
| Compliance Audit Preparation | 3–7 days of record assembly from multiple departments and filing systems | Audit package generated from connected records in under 2 hours | Reduced regulatory penalty exposure from documentation gaps |
| Corrective Action Tracking | Email threads and paper logs with no systematic closure verification | Work order lifecycle tracked from creation through closure with timestamped evidence attachment | Demonstrates good faith compliance effort to regulators |
Every row in this comparison represents a recurring compliance risk that iFactory's connected platform eliminates. Book a Demo to see how iFactory maps your facility's specific flue gas compliance program against this framework.
Three Dimensions of Flue Gas System Analytics: Operational, Compliance, and Predictive
iFactory's flue gas system analytics module delivers value across three distinct operational dimensions simultaneously — real-time equipment condition monitoring, compliance schedule management, and predictive maintenance for the mechanical and electrical components that determine emission control performance. Understanding these dimensions separately helps environmental and maintenance teams identify where the platform delivers the most immediate value at their specific facility.
The platform continuously monitors the operating parameters that indicate emission control system health — ESP field current and voltage, FGD absorber differential pressure and reagent slurry density, SCR reactor differential pressure and catalyst activity indicator, and CEMS data availability percentage. Deviations from normal operating envelopes trigger immediate alerts to the operations and maintenance teams before they become opacity or emission exceedances.
- ESP rapper performance and collection efficiency trending
- FGD recirculation pump vibration and seal condition monitoring
- SCR ammonia injection valve position and flow verification
- CEMS analyzer drift detection between calibration events
Every inspection, test, and reporting obligation associated with the Title V permit, applicable New Source Performance Standards, and state air quality regulations is loaded into the platform's compliance calendar with the required frequency, responsible party assignment, and documentation checklist. The system generates advance notifications at configurable lead times — typically 30, 14, and 7 days before due dates — and escalates to supervisors when items remain incomplete past their scheduled window.
- Title V permit inspection obligation tracking by unit and system
- 40 CFR Part 75 CEMS quality assurance test scheduling
- Annual stack performance test coordination and documentation
- Semi-annual opacity monitoring and corrective action records
Emission control equipment failures that cause compliance violations are almost always preceded by detectable degradation signals that calendar-based maintenance misses. iFactory's predictive analytics identifies these signals — a developing ESP high-voltage transformer failure, an FGD spray header nozzle pluggage pattern, an SCR catalyst pressure drop trend indicating ash blinding — and generates condition-based work orders before the degradation reaches a compliance-relevant threshold.
- ESP T-R set failure prediction from current-voltage trend analysis
- FGD pump and agitator bearing wear detection via vibration analytics
- SCR catalyst replacement window optimization from activity modeling
- Baghouse differential pressure trending for fabric filter condition
Deploy iFactory's Flue Gas Compliance Analytics at Your Thermal Power Plant
iFactory's AI-driven platform connects ESP, FGD, SCR, and CEMS compliance obligations into a unified system — automated inspection scheduling, corrective action tracking, and audit-ready documentation available in under 2 hours instead of days. Book a Demo to see the platform demonstrated against your facility's permit requirements.
5-Step Deployment Roadmap: From Permit Review to Live Compliance Analytics
iFactory's flue gas system analytics deployment follows a structured five-step sequence that builds the compliance program from the permit document outward — ensuring that every obligation captured in the system is traceable to the specific permit condition that requires it. This permit-grounded approach makes the system immediately useful for regulatory correspondence and enforcement response, not just for internal scheduling. Book a Demo to see how iFactory maps this sequence to your facility's Title V permit and applicable NSPS subparts.
Title V Permit Review and Compliance Obligation Extraction
iFactory's deployment team reviews the facility's Title V operating permit and applicable state air quality regulations to extract every inspection, monitoring, testing, and reporting obligation associated with the ESP, FGD, SCR, CEMS, and stack monitoring systems. Each obligation is loaded into the compliance calendar with the specific permit condition citation, required frequency, documentation requirements, and responsible party assignment. The completed compliance calendar is reviewed against the permit by the facility's environmental manager before go-live to confirm completeness and accuracy.
CEMS and Historian Data Integration
iFactory connects to the facility's CEMS data acquisition and handling system (DAHS) and plant historian using read-only API connections — pulling continuous SO2, NOx, opacity, CO, and flow rate data into the analytics platform where it is correlated with maintenance records and compliance obligations. This connection provides the continuous monitoring data backbone that the compliance analytics, corrective action triggers, and quarterly report generation workflows depend on. The connection is established through the plant's existing data infrastructure without modifications to the CEMS or DCS architecture.
Equipment Asset Hierarchy Build and Historical Record Migration
The flue gas treatment system asset hierarchy — ESP fields, T-R sets, rappers, and hoppers; FGD absorber towers, pumps, agitators, and reagent systems; SCR reactors, catalyst layers, and ammonia injection systems; stack monitoring probes and analyzers — is built in the platform with component-level records linked to the compliance obligations and maintenance history for each. Available historical maintenance records, past inspection checklists, previous stack test reports, and corrective action documentation are migrated into the asset records to provide immediate compliance history context from the first day of live operation.
Corrective Action and Exceedance Response Workflow Configuration
Automated corrective action workflows are configured for each major compliance risk scenario: opacity exceedance events, SO2 or NOx limit exceedances, CEMS data availability drops below the 90% quarterly threshold, missed stack test windows, and overdue inspection items. Each workflow defines the notification chain, the required response timeframe, the documentation fields that must be completed for closure, and the escalation path when items remain open past their due date. These workflows ensure that every compliance deviation generates a documented, trackable response rather than an informal email chain.
Live Compliance Dashboard Activation and Regulatory Reporting Integration
The live compliance dashboard surfaces the current status of every flue gas system obligation — upcoming inspection due dates, open corrective actions, CEMS data availability percentages, and quarterly report submission deadlines — in a single view accessible to environmental managers, plant managers, and corporate environmental teams with role-appropriate access. Quarterly 40 CFR Part 75 reports are generated directly from the platform's connected CEMS data and QA records, replacing the multi-week manual assembly process with a structured review workflow that takes 2–3 days from data freeze to submission-ready report.
What Environmental Compliance Managers at Thermal Plants Say About Connected Analytics
The Connected Flue Gas Compliance Program: From Documentation Risk to Regulatory Confidence
The thermal power plants that manage flue gas system compliance most effectively in 2026 are not necessarily the ones with the newest emission control equipment. They are the ones with the most systematic compliance programs — where every inspection is scheduled and documented before it is due, every exceedance event generates a traceable corrective action record, and every quarterly report is assembled from connected data rather than assembled manually from disconnected sources. iFactory's AI-driven analytics platform delivers this systematization for ESP, FGD, SCR, and CEMS assets within a single deployment that connects the compliance calendar, the maintenance work order system, the CEMS data stream, and the corrective action documentation chain into a unified compliance record.
The financial case is direct: the 85% reduction in CEMS quarterly report preparation labor, the elimination of missed inspection windows, the 2-hour audit package generation, and the documented corrective action response that protects against penalty enhancement under EPA's gravity component calculations collectively produce an ROI that most environmental and operations managers calculate within the first two quarters of deployment. The regulatory risk reduction — avoiding the documentation gaps that convert equipment problems into enforcement actions — is harder to quantify but consistently identified by compliance professionals as the platform's highest-value contribution. Book a Demo to see how iFactory maps your facility's flue gas compliance program against the connected analytics framework.
Flue Gas System Analytics — Frequently Asked Questions
Does iFactory's platform replace the CEMS DAHS, or does it work alongside the existing system?
iFactory's analytics platform works alongside the existing CEMS data acquisition and handling system — it does not replace the DAHS or the CEMS hardware. The platform connects to the DAHS via read-only API or data export to pull emission monitoring data, quality assurance test results, and data availability records into the compliance analytics and reporting workflows. The DAHS continues to perform its EPA Method 19 and Part 75 data validation functions unchanged. iFactory adds the compliance scheduling, corrective action tracking, work order integration, and audit documentation functions that the DAHS was not designed to provide. Most facilities find that the combination eliminates the manual data transfer work that currently connects the CEMS team's DAHS outputs to the environmental manager's compliance calendar and the maintenance team's work order system. Book a Demo to see how iFactory connects to your specific DAHS platform.
How does the platform handle compliance obligations that differ across units at a multi-unit plant?
iFactory's compliance architecture is unit-specific by design. Each generating unit — and each emission control system within each unit — carries its own compliance obligation set derived from its specific permit conditions, applicable NSPS subparts, and applicable state implementation plan requirements. A plant with three units where Unit 1 operates under NSPS Subpart Da, Unit 2 under an earlier vintage permit with different opacity monitoring frequency requirements, and Unit 3 under a more recent consent decree with enhanced reporting obligations will have three separate compliance calendars that roll up into a single facility-level dashboard showing all outstanding obligations across the site. Plant-level and unit-level views are both available, and role-based access controls allow unit-specific environmental coordinators to see only their assigned unit's obligations while the plant environmental manager sees the full site compliance status.
Can the platform manage the ESP rapper optimization and T-R set performance analytics, or is it limited to compliance scheduling?
The platform covers both the compliance scheduling and the operational analytics for ESP systems. The compliance scheduling functions — semi-annual opacity surveys, annual full-load performance tests, and corrective action documentation for opacity exceedances — are driven by the permit compliance calendar. The operational analytics functions — rapper cycle timing optimization, T-R set current-voltage curve trending, collection efficiency estimation from inlet and outlet opacity relationships, and hopper level monitoring — are driven by continuous sensor data from the ESP control system connected through the historian integration. When the operational analytics detect a developing T-R set degradation trend, the platform generates a predictive maintenance work order for the electrical maintenance team. When the degradation reaches a threshold that correlates with opacity limit approach, the compliance calendar automatically advances the next required inspection to evaluate whether a corrective action record needs to be opened before the permit requires it. This integration between operational condition and compliance obligation is what separates a connected analytics platform from a standalone compliance calendar.
How does iFactory handle SCR catalyst management, particularly tracking catalyst activity decline and replacement decisions?
SCR catalyst management in iFactory covers the full catalyst lifecycle from installation through annual performance testing through replacement decision. Catalyst activity is tracked using the combination of reactor inlet and outlet NOx measurements, operating temperature, space velocity, and ammonia injection rate to calculate a normalized catalyst activity index that declines predictably as catalyst ages. The platform tracks this index against the catalyst specification curve and the facility's NOx permit limit — generating an alert when the projected catalyst activity line intersects the performance threshold required to meet the permit limit at the plant's maximum catalyst temperature operating condition. This projection gives the outage planning team a 6 to 18 month advance warning of replacement need, allowing catalyst procurement and installation to be scheduled in the next available planned outage rather than on an emergency basis. Catalyst replacement event records, including received activity test results, installation documentation, and post-installation performance test results, are stored in the SCR asset record for permit renewal, enforcement response, and insurance documentation purposes. Book a Demo to see the SCR catalyst management module demonstrated.
What is the typical timeline from contract signing to a live compliance dashboard at a thermal power plant?
For a single-unit thermal power plant with a standard Title V permit structure and an existing CEMS DAHS with API access, the typical deployment timeline from contract signing to a live compliance dashboard with full permit obligation loading, CEMS data integration, and asset hierarchy build is 8 to 12 weeks. The primary activities are permit obligation extraction and calendar loading (weeks 1–3), CEMS and historian data integration and validation (weeks 2–5), asset hierarchy build and historical record migration (weeks 3–8), corrective action workflow configuration and team training (weeks 6–10), and compliance dashboard review and go-live (weeks 10–12). Multi-unit plants typically add 2 to 4 weeks per additional unit depending on whether the units share a common CEMS infrastructure or operate under substantially different permit structures. iFactory provides a site-specific deployment timeline based on the facility's permit complexity and available historical records during the pre-deployment scoping engagement.
Deploy iFactory's Flue Gas Analytics — From Compliance Calendar to Audit-Ready Records
iFactory connects your ESP, FGD, SCR, and CEMS compliance obligations into a single AI-driven platform — automated scheduling, corrective action tracking, and documentation generation that protects against Clean Air Act penalty exposure and reduces compliance labor by 85%.