The morning shift supervisor at a midwestern automotive stamping plant watches the OEE dashboard — 74%, same as yesterday, same as last month. On the line, a press bearing is vibrating at 11.4 kHz, trending up for six days. The historian captures it. The maintenance team doesn't see it until the bearing seizes at 2 AM, costing $47,000 in unplanned downtime and a Tier 1 OEM penalty. Across the plant, a robotic welder's cycle time drifted by 0.8 seconds three weeks ago — nobody noticed until the daily throughput dropped by 112 units. This is the reality of the modern factory data is everywhere, but the insight that connects the bearing vibration, the cycle drift, the energy spike, and the quality reject is invisible. The plant is generating terabytes of signals, yet the operations team is flying blind.
One Platform. Every Signal. Zero Blind Spots.
iFactory ingests every data source in your plant — PLCs, historians, CMMS, vision systems, energy meters, and operator HMI entries — and surfaces the cross-domain patterns that cost you throughput, quality, and margin. No cloud. No data leaving your network. A working pilot in 6–12 weeks.
iFactory is the operating system for your plant's intelligence
Most manufacturing analytics tools solve one problem well — predictive maintenance on one asset class, or energy monitoring on one line. iFactory is different. It is an end-to-end, turnkey platform that connects every data source on your plant floor into a single, real-time intelligence layer. From vibration and temperature sensors on a cooling tower to cycle-time trends from a CNC cell, from quality inspection reject rates to operator shift logs, iFactory learns the normal behavior of your entire production system and flags the anomalies that matter — before they become incidents. It runs entirely on an NVIDIA appliance inside your plant network. No cloud dependency. No data egress. No security review delays. And because it is turnkey, your team hands over data-source access and iFactory delivers a working pilot in 6–12 weeks — not six months of integration consulting.
Every signal, every surface, every insight
iFactory's platform is built on six core capability groups that cover the full spectrum of plant-floor intelligence. Each one runs continuously, cross-referencing across domains, so a vibration anomaly on a pump is automatically correlated with a pressure drop, a downstream flow reduction, and a quality reject spike — in real time.
Machine health across every asset class
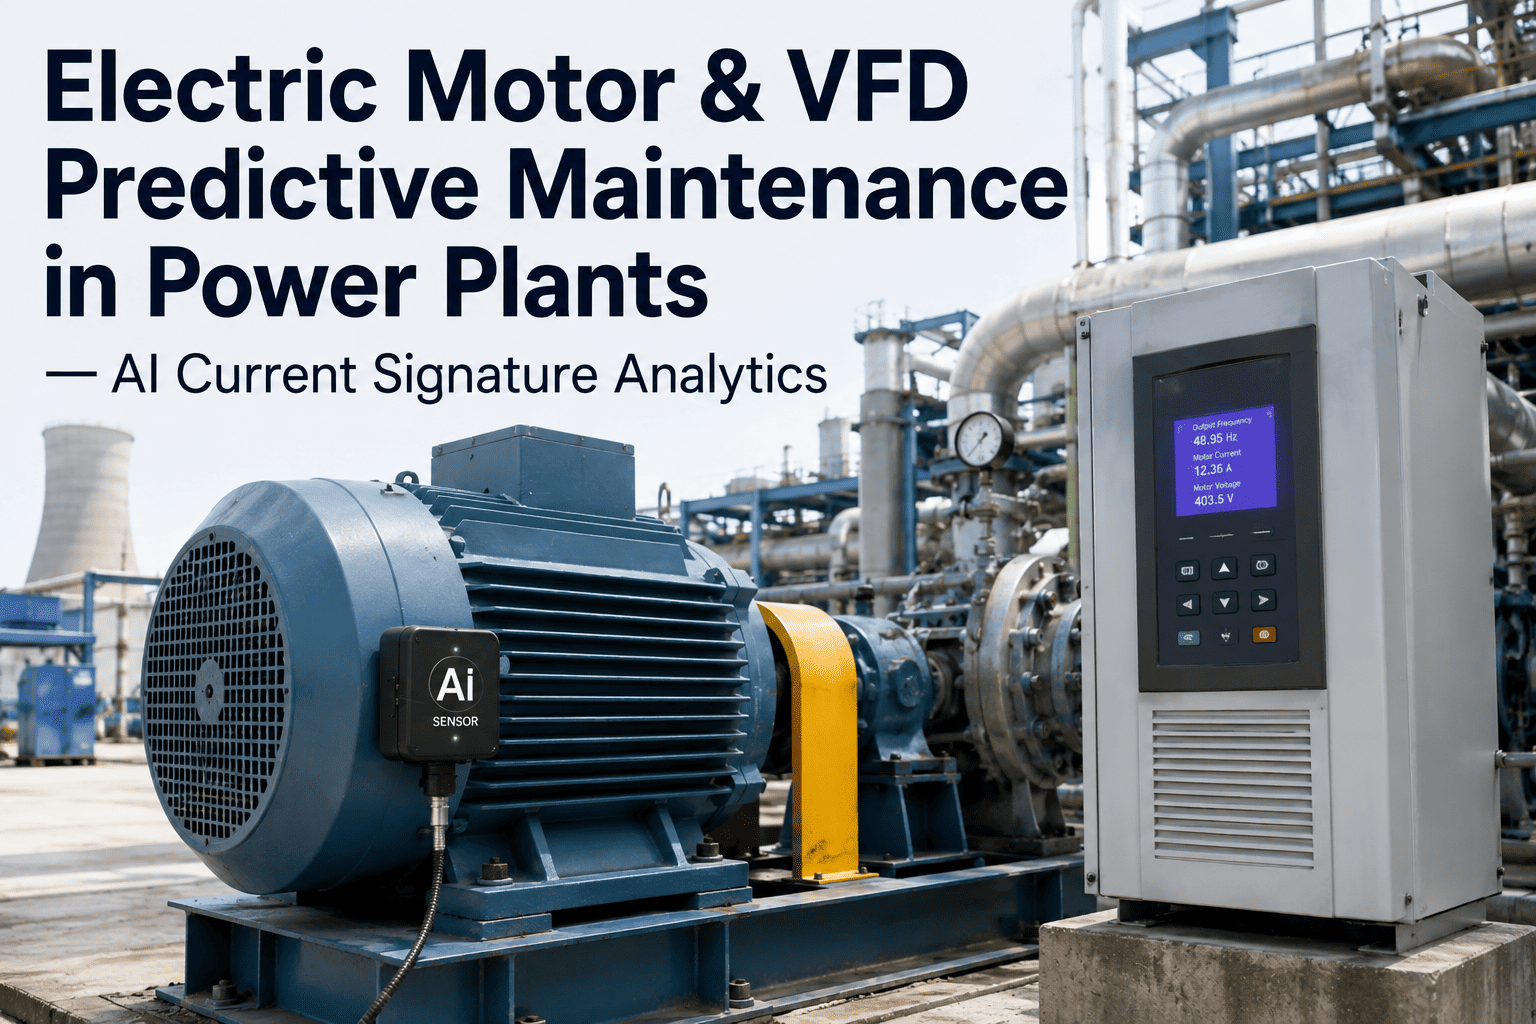
iFactory ingests vibration, temperature, current, pressure, and acoustic data from pumps, motors, compressors, conveyors, presses, and robots. It builds a digital fingerprint of normal operation for each asset and detects drift — bearing degradation, imbalance, misalignment, lubrication loss — 2 to 14 days before failure. The platform prescribes the exact maintenance action, the optimal window, and the parts needed.
Real-time defect prevention, not detection
By correlating process parameters — temperature profiles, pressure curves, cycle times — with downstream quality data from vision systems and CMM measurements, iFactory identifies the exact process window that produces defects. It alerts operators before a non-conformance occurs and recommends setpoint adjustments to hold the process inside the quality envelope.
Every kilowatt-hour mapped to production
iFactory meters energy consumption at the machine, line, and plant level and correlates it with production output. It identifies energy waste — a compressor running at partial load, a chiller cycling unnecessarily, a line producing air while idle — and quantifies the cost. Typical plants recover 8–15% of energy spend within the first quarter.
Throughput, cycle time, and constraint analysis
iFactory tracks every production cycle, every stop event, every speed loss, and every quality reject in real time. It surfaces the exact bottleneck — the station, the shift, the operator, the material lot — and quantifies the revenue impact. It does not stop at OEE reporting; it tells you which 20% of losses drive 80% of the missed output.
From receiving dock to shipping dock
iFactory tracks material consumption, WIP levels, and inventory turnover in real time. It detects flow disruptions — a bin that has not moved in 90 minutes, a conveyor jam that is starving a downstream cell, a raw-material shortage that will hit in 4 hours — and alerts the right person with context and a recommended action.
Proactive risk detection from existing sensors
Using existing environmental sensors — gas detectors, air quality monitors, noise meters, temperature sensors — iFactory identifies unsafe conditions before they escalate. A slow rise in CO levels in a paint booth, a temperature excursion in a chemical storage area, a noise level that exceeds OSHA thresholds on a specific shift — each triggers an alert with a root-cause trace.
Four steps from data chaos to plant-wide intelligence
iFactory is designed for deployment without a multi-month integration project. Your plant-floor engineers grant data-source access; iFactory does the rest.
Connect
iFactory's appliance connects to every data source on your network — PLCs, historians, SCADA, CMMS, vision systems, energy meters, environmental sensors, and operator HMI logs — via native drivers and open protocols (OPC UA, Modbus, MQTT, REST APIs, SQL databases).
Learn
The platform ingests 2–4 weeks of historical data and builds a multi-dimensional model of normal plant behavior — every machine, every process, every sensor, every quality metric, every energy load — and their inter-dependencies.
Detect
In real time, iFactory compares every incoming data point against its learned baseline. It detects anomalies — a vibration trend, a temperature drift, a cycle-time creep, a pressure drop — and cross-correlates across domains to identify root cause and business impact.
Prescribe
For every detected anomaly, iFactory delivers a prescriptive alert: the asset, the symptom, the root cause, the recommended action, the optimal window, the parts or resources needed, and the cost of inaction — all in a single screen.
Three scenarios your plant faces every day
Without a platform that connects every signal, your plant is reacting to events that should have been predicted. Here is what that costs — in real terms, at real plants.
Undetected bearing failure on a critical press
A 500-ton stamping press in an automotive plant. The bearing vibration drifts over 8 days. No single system connects the vibration trend, the temperature rise, and the increasing cycle time. The bearing seizes at 2 AM. 14 hours of unplanned downtime. Lost production: 2,800 stampings at $87 each. OEM penalty: $18,000.
Cycle-time drift on a robotic welding cell
A welding robot's wrist joint accumulates 0.02 seconds of additional cycle time per 1,000 welds due to gradual wear. Over 12 weeks, the drift reaches 1.1 seconds per weld. The line loses 47 units per shift. The quality team blames the operator. The maintenance team blames the material. The drift is invisible until throughput drops by 12%.
Energy waste from a decoupled compressor
A 200 HP rotary screw compressor runs at 72% load factor because the plant's demand profile shifted. The energy management system shows total plant kWh. The production system shows output. No system connects the two. The compressor wastes 38,000 kWh per month. The plant manager sees the bill but cannot trace it to a specific asset.
What plants achieve with iFactory
These are real, measured outcomes from iFactory deployments across discrete and process manufacturing. Your plant's results will vary, but the pattern is consistent: the platform pays for itself in the first quarter.
Your plant has every sensor it needs. The missing piece is the platform that connects them. Book a 30-min walkthrough and we'll show you what your data is already saying.
Questions operations leaders ask about plant-wide intelligence
Your plant's intelligence is waiting inside the data you already have.
iFactory connects every signal, detects every anomaly, and prescribes every action — all on-premise, all turnkey, all in 6–12 weeks. See it working on your data.
.png)