Running a small or mid-size power plant means operating in a world that was designed for utilities ten times your size. The enterprise analytics platforms used by large independent power producers cost millions to implement, require dedicated IT teams, and take 18 months to deploy. Meanwhileyour control room operators are still pulling data manually from historians, your maintenance team is scheduling outages based on run-hours rather than actual equipment conditionand your O&M costs per MWh are higher than they need to be—not because you are doing anything wrong but because you've never had the right data at the right time.
That gap is closing. Modern AI-driven analytics platforms purpose-built for smaller generation assets—peakers, combined-cycle plants under 500 MW, biomass facilities, small hydro, and distributed generation portfolios—deliver capabilities that were enterprise-only five years ago, now deployable in weeks without a dedicated data science team. This guide explains exactly what those systems do, what to look for, and how to calculate whether the investment makes sense for your facility.
Analytics Software for Small & Mid-Size Power Plants
AI-driven operational analytics purpose-built for facilities under 500 MW—predictive maintenance, real-time performance monitoring, and fuel optimization without enterprise complexity or cost.
Why Standard Analytics Platforms Fail Smaller Power Plants
The analytics platforms dominating the utility sector—OSIsoft PI with advanced analytics modules, GE APM, IBM Maximo Analytics—were architected for assets with hundreds of thousands of data points, dedicated reliability engineering teams, and capital budgets that absorb seven-figure software licenses. Smaller facilities attempting to deploy these systems face three predictable failure modes.
Implementation Overhead
Enterprise platforms require 12–24 months of configuration, data tagging, and model training before producing actionable output. A 150 MW peaker doesn't have the engineering bandwidth to run a two-year software project.
Cost Structure Mismatch
Licensing, implementation, training, and annual support for enterprise APM software often exceeds $400,000 in year one. At a 200 MW gas peaker generating 2–4 cents per kWh in margin, that cost is very difficult to justify on paper.
Expertise Dependencies
Most enterprise analytics platforms assume a data scientist on staff to maintain models, interpret anomalies, and tune algorithms. Small plant operators don't have that role—and shouldn't need to hire one to get value from their data.
The right analytics platform for a small or mid-size power plant inverts each of these constraints: cloud-native deployment measured in weeks, subscription pricing tied to asset value rather than enterprise seat counts, and pre-built models that work on standard plant sensor data without custom data science work.
Want to see how these monitoring capabilities apply to your specific equipment configuration? Book a 30-minute asset assessment with iFactory's power generation team.
Core Capabilities: What Power Plant Analytics Software Actually Monitors
Analytics platforms for power generation aren't general-purpose industrial monitoring tools repurposed for the sector. The highest-value systems come with pre-built equipment models and alarm logic specific to the generating assets found at smaller facilities—gas turbines, steam turbines, heat recovery steam generators, cooling systems, and electrical balance-of-plant equipment.
Want to see how these monitoring capabilities apply to your specific equipment configuration? Book a 30-minute asset assessment with iFactory's power generation team.
How the Analytics Platform Works: From Sensor Data to Actionable Insight
The path from raw sensor readings to a maintenance recommendation that a plant operator can actually act on involves several distinct processing layers. Understanding this chain helps plant managers evaluate whether a platform is genuinely generating intelligence or simply displaying data more attractively than a historian interface.
Data Ingestion & Normalization
The platform connects to existing plant data sources—DCS historians, SCADA systems, PI tags, or direct OPC-UA feeds—without requiring sensor replacement or control system modifications. Raw tag data is normalized, bad actors identified and flagged, and time-series records aligned. For most small plants, this layer is operational within 2–4 weeks using standard industrial connectors.
Physics-Based Baselining
Pre-built thermodynamic and mechanical models establish expected performance for each equipment type at given operating conditions. A gas turbine's expected output at 95°F ambient and 85% load factor is calculable from first principles—deviations from that expectation signal actual equipment degradation rather than operational variation. This physics-based approach means the system produces useful baselines immediately, before months of historical data accumulate.
Anomaly Detection & Pattern Recognition
Machine learning models trained on thousands of equipment failure histories run continuously against normalized sensor streams. When a developing pattern matches a known failure precursor—compressor stall signatures, bearing defect frequencies, hot section thermal gradient changes—the system flags it with a confidence score and failure mode classification. Unlike rule-based alarm systems, these models detect subtle multivariate patterns invisible to threshold alarms.
Risk Prioritization & Work Order Generation
Detected anomalies are ranked by consequence severity and confidence level, then converted into prioritized maintenance recommendations with estimated remaining useful life windows. High-confidence, high-consequence findings automatically generate draft work orders in the connected CMMS. Plant managers see a ranked list of actions—not a list of alarms—with suggested inspection scope and parts requirements pre-populated.
Performance Loss Quantification
Beyond failure prediction, the platform continuously quantifies the financial cost of current degradation: how many MW of capacity are being lost to compressor fouling, what is the heat rate penalty from condenser tube scaling, and what is the incremental fuel cost of operating at current efficiency versus clean-unit performance. These figures connect equipment condition directly to operating margin—the metric plant owners actually manage to.
Continuous Model Improvement
Every confirmed finding, missed event, and false positive feeds back into model refinement. The platform learns the specific operating patterns and equipment characteristics of your facility over time, reducing false alarm rates and improving detection lead times. After 6–12 months of operation, facility-specific models outperform generic fleet models by a significant margin on precision metrics.
Want to see how these monitoring capabilities apply to your specific equipment configuration? Book a 30-minute asset assessment with iFactory's power generation team.
Deployment Comparison: Small Plant Analytics vs. Enterprise APM
The practical differences between platforms built for smaller facilities and enterprise APM solutions go beyond price. Deployment model, time-to-value, and ongoing operational requirements diverge significantly across every dimension that matters to a plant manager with limited IT resources.
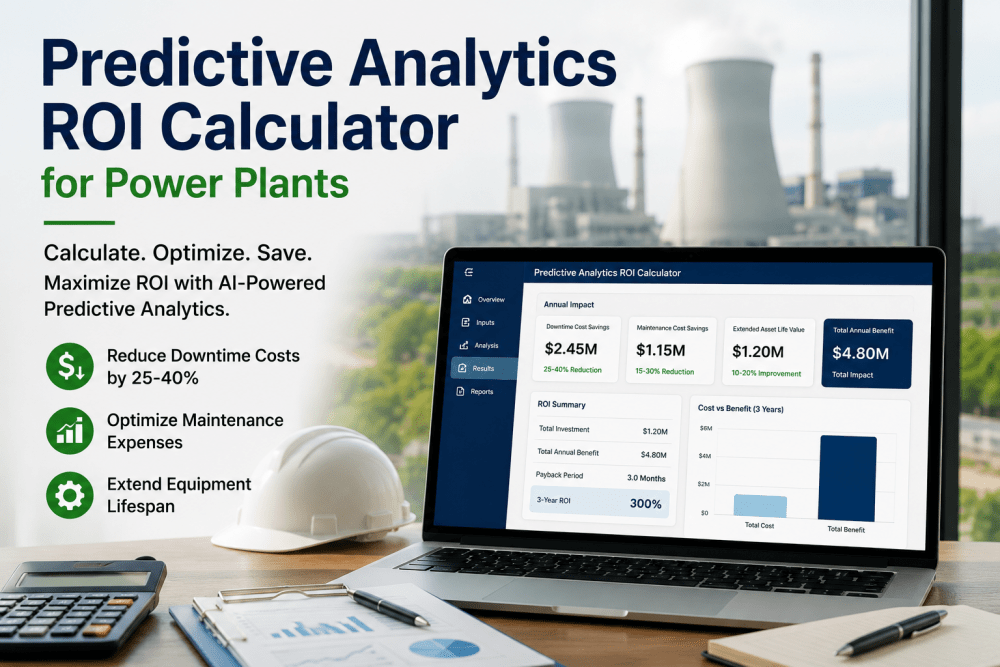
ROI Metrics: What Small & Mid-Size Plants Measure After Implementation
Analytics investments at smaller power plants are scrutinized more intensely than at large utilities—there's less budget cushion and less tolerance for long payback periods. The good news is that the measurable outcomes from AI-driven analytics are proportionally strong at smaller facilities, because the efficiency gains apply to every MWh produced regardless of plant size.
Expert Review: What Plant Managers Should Demand From an Analytics Vendor
After working with analytics implementations across more than twenty small and mid-size generation facilities—peakers, combined-cycle plants, cogen facilities, and small hydro stations—the pattern of what separates successful deployments from shelved software is consistent and predictable.
Conclusion
The analytics gap between large utilities and smaller independent power producers is a structural disadvantage that has persisted for years—not because the underlying technology was unavailable, but because the available technology was built for a different scale of operation. That has changed. Cloud-native analytics platforms with pre-built equipment models, physics-based performance baselines, and AI anomaly detection now deploy in weeks rather than years, at cost structures that produce positive ROI within the first year of operation for most facilities under 500 MW.
The plants that will generate the strongest returns from analytics investment over the next five years are not the ones that wait for a more perfect technology or a larger capital budget. They are the ones that start with a focused scope—predictive maintenance on the highest-consequence equipment, heat rate optimization on their primary generating units—and build from demonstrated value rather than aspirational scope. iFactory's platform is designed to support exactly that approach: deployable without disruption, producing actionable findings within weeks, and expanding naturally as the operational case compounds.
Ready to move from reactive maintenance to predictive operations? Schedule your plant assessment with iFactory's power generation analytics team.
Frequently Asked Questions
Purpose-Built Analytics for Plants That Can't Afford Enterprise Complexity
From peaker readiness monitoring to combined-cycle heat rate optimization, iFactory delivers AI-driven operational intelligence sized for small and mid-size power plants—deployable in weeks, with ROI in months.