Boost Technician Productivity with AI-driven Gamification
By Dahlia Jackson on May 21, 2026
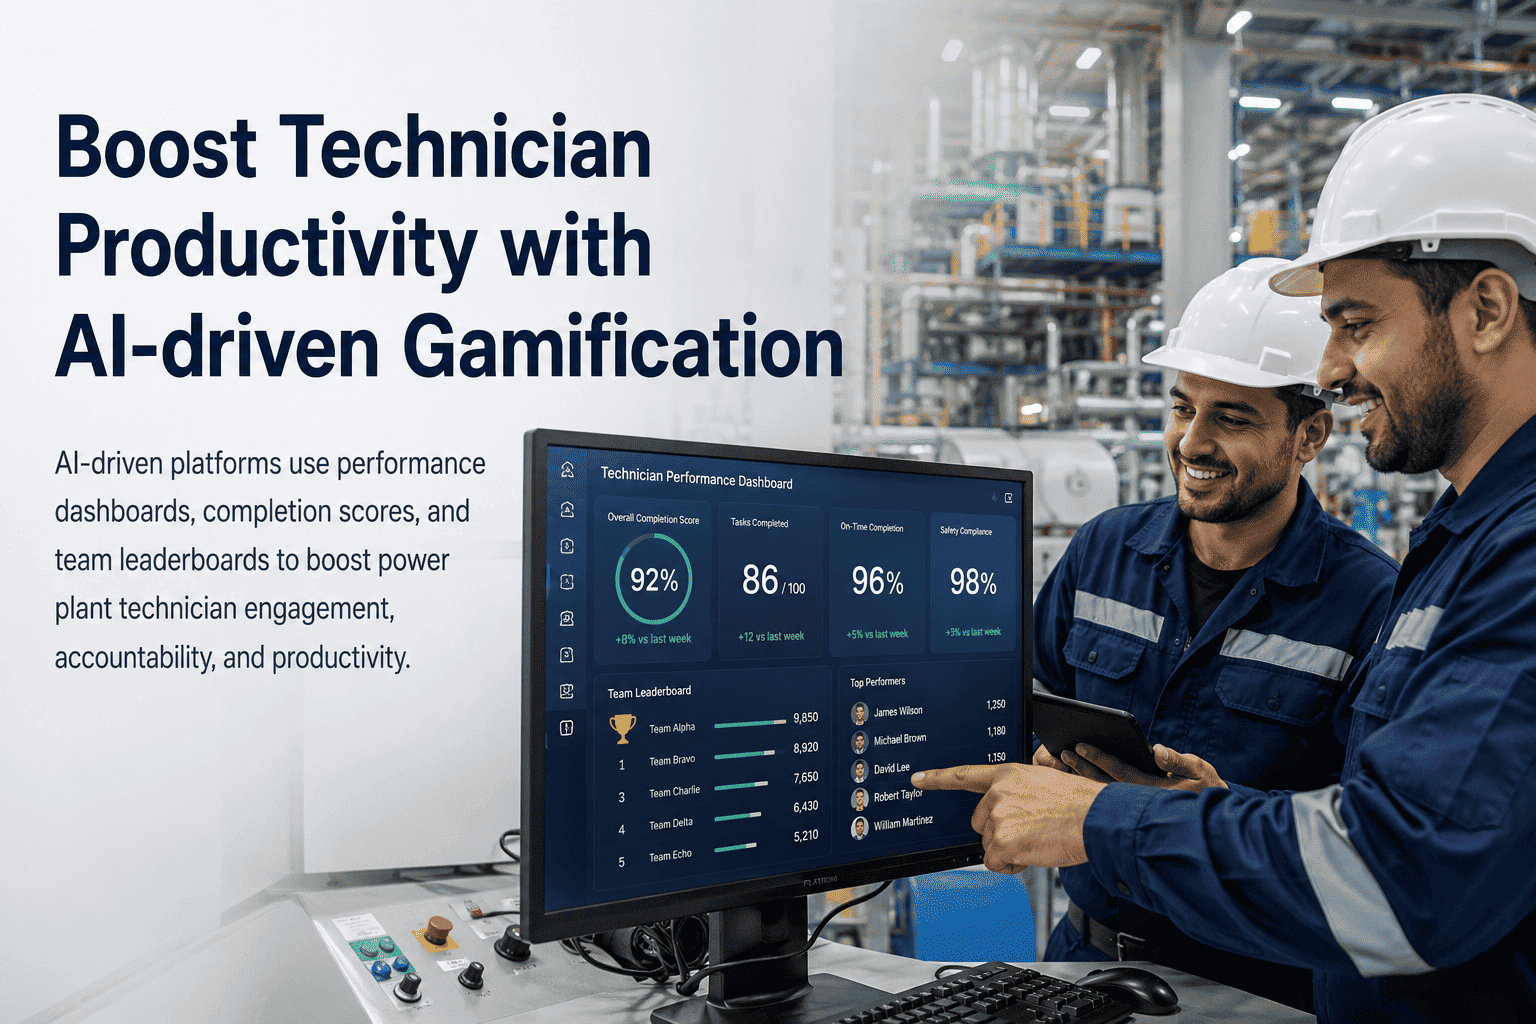
Technician productivity in power generation has always been measured — but rarely in a way that technicians themselves can see, understand, and respond to in real time. Work orders get completed andmaintenance logs get filed, and performance reviews happen quarterly. By the time a reliability manager identifies that a crew is taking 40% longer than average to close corrective work orders, weeks of avoidable downtime have already accumulated. AI-driven gamification platforms change the measurement model entirely: every completed inspection, closed work order, and accurate failure cause code becomes scored, visible, real-time performance signal that technicians can track themselves — and that managers can act on before small productivity gaps become large operational costs. This guide explains how AI-powered performance dashboards, completion scoring, and team leaderboards are being deployed at U.S. power plants to drive measurable gains in technician engagement, accountability, and maintenance throughput.
34%
Average increase in work order completion rates within 90 days of gamification deployment
$62K
Annual labor cost savings per crew from reduced idle time and repeat-visit elimination
2.8x
Improvement in cause code data completeness when technicians receive real-time accuracy scores
91%
Technician retention rate at facilities using AI-driven performance recognition platforms
Why Standard Performance Tracking Fails Power Plant Technicians
The core problem with how most power plants track technician performance is not a lack of data — it is a lack of visibility and timeliness. Most facilities generate plenty of maintenance metrics: work order backlogs, MTTR averages, PM completion rates. But those numbers live in supervisor dashboards and monthly reports that technicians never see. The person doing the work has no idea how their performance compares to peers, whether their repair documentation quality is improving, or whether the work they completed last Tuesday contributed meaningfully to the plant's reliability goals. That information vacuum creates three predictable problems.
No Feedback Loop on Data Quality
Technicians filling in generic failure cause codes receive no signal that their documentation quality is below standard — until a reliability review surfaces the problem weeks later. Without real-time feedback, the behavior never changes and incomplete data compounds across every work order.
Invisible Performance Benchmarks
When technicians cannot see how their MTTR or PM completion rate compares to the team average, high performers have no recognition and low performers have no awareness. The performance gap widens invisibly until it shows up in aggregate reliability metrics.
Delayed Recognition and Accountability
Quarterly performance reviews are too infrequent to change day-to-day behavior. By the time a supervisor flags a productivity issue, months of suboptimal work patterns have already shaped habits that are difficult to reverse. Positive performance goes unrecognized for the same reason.
Disconnected Team Accountability
Crew-level performance is rarely visible to the crew itself. Individual technicians working in isolation have no sense of how their output affects team metrics — and no shared competitive or collaborative incentive to drive improvement across the full maintenance group.
See how iFactory's AI-driven gamification platform turns work order data into real-time performance visibility — and drives measurable productivity gains across your maintenance crews. Book a 30-minute Productivity Demo with iFactory's power plant analytics team.
How AI-Driven Gamification Works in a Power Plant Environment
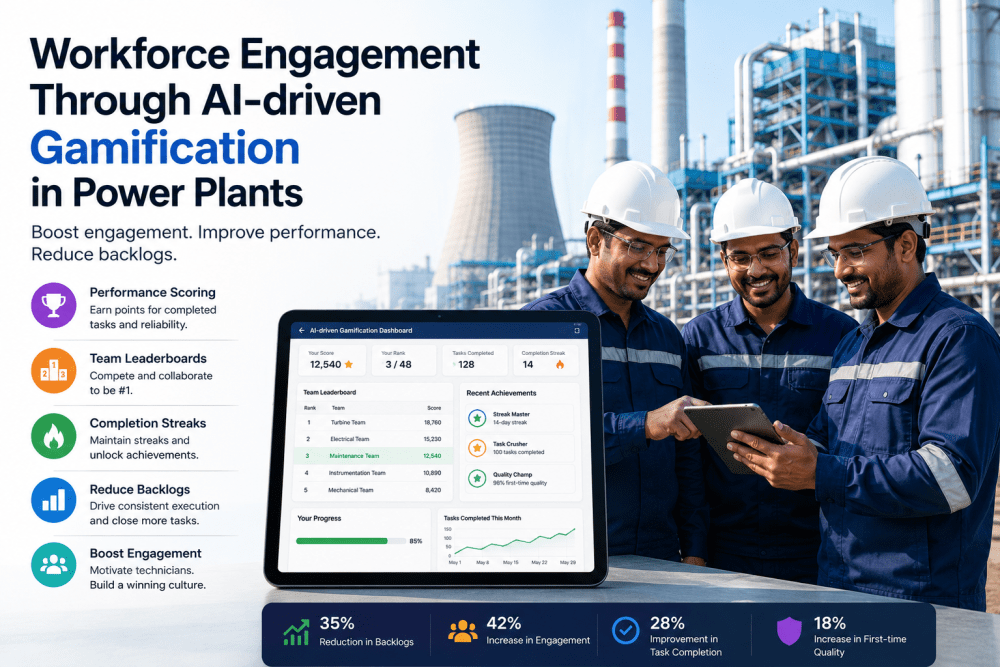
Gamification in industrial maintenance is not about turning work into a video game. It is about applying the behavioral mechanics that make games engaging — visible progress, meaningful scores, peer comparison, and achievement recognition — to the real work of power plant maintenance. AI-driven platforms add a layer of intelligence that standard scorecards cannot: they weight performance scores by task complexity and asset criticality, adjust benchmarks as the workforce improves, and identify which specific behaviors drive the highest reliability outcomes so those behaviors can be reinforced.
97%
Cause code completeness when scoring is visible in real time
3.2x
Faster fault isolation when technicians track their own MTTR
AI-Weighted Performance Scoring
Every completed work order generates a performance score that accounts for: work order closure speed relative to asset type, failure cause code specificity (ISO 14224-aligned), parts documentation completeness, repair step accuracy versus historical SOP, and photo evidence capture. Scores are calculated automatically and displayed on the technician's personal dashboard within minutes of work order closure. The AI weighting ensures that a rapid closure with incomplete documentation scores lower than a slightly slower closure with complete, accurate data — reinforcing the behaviors that actually drive reliability outcomes.
41%
Improvement in PM on-time completion when crew leaderboards are active
Top 3
Crew positions updated in real time across shift, week, and month periods
Real-Time Team and Crew Leaderboards
Team leaderboards display ranked performance across three dimensions: individual technician scores within the crew, crew-level performance versus other crews at the facility, and facility-level benchmarks versus the broader fleet. Rankings update in real time as work orders close and scores are calculated. Leaderboard visibility is configurable — individual-to-crew comparison is always visible to technicians; cross-facility comparison is available to reliability managers. The competitive structure creates organic accountability: technicians who can see their position relative to peers have a direct, continuous feedback signal that no quarterly review can replicate.
91%
Retention rate at facilities using milestone recognition programs
28 days
Average time to first milestone achievement for new technicians
Milestone Badges and Achievement Tracking
The platform tracks cumulative achievement milestones that complement daily performance scores. Milestones are structured around three categories: reliability contributions (consecutive days without a missed PM, number of recurrence patterns identified through accurate cause coding), skill development (completion of structured repair procedures across new asset types, first-time resolution rate improvement), and data quality streaks (consecutive work orders with complete cause codes and parts documentation). Milestones are visible on the technician's profile and accumulate over time — creating a performance record that supports both internal recognition and career development conversations.
54%
Reduction in repeat documentation errors after AI coaching nudges activate
<3 min
Delivery time for AI-generated coaching recommendation after work order closure
AI-Personalized Coaching Recommendations
Beyond scoring, the AI layer generates individual coaching nudges delivered through the technician's mobile app within minutes of work order closure. If a technician's cause code selections have been consistently less specific than their peer average, the system delivers a targeted prompt: "Your last four turbine corrective events were coded as 'mechanical failure' — the most effective code for this failure type in your asset class is 'bearing wear, fatigue spalling.' More specific coding improves your score and helps the team prevent recurrences." Coaching is personalized by role, asset class familiarity, and performance trend — not generic advice, but behavior-specific guidance tied to actual recent work.
See how iFactory's AI-driven gamification platform turns work order data into real-time performance visibility — and drives measurable productivity gains across your maintenance crews. Book a 30-minute Productivity Demo with iFactory's power plant analytics team.
Gamification vs. Standard KPI Reporting: What the Data Shows
The performance gap between standard KPI reporting and AI-driven gamification becomes measurable within the first 60 days of deployment. The comparison below maps specific behavioral and operational outcome differences that power plant reliability and operations managers report across both approaches.
Performance Area
Standard KPI Reporting
iFactory AI Gamification
Feedback Cycle Time
Monthly or quarterly supervisor reports. Technicians learn about performance gaps weeks after the behavior that caused them.
Real-time score updates within minutes of work order closure. Behavior correction happens in the same shift.
Cause Code Completeness
32% average completeness with optional cause code fields. No technician-level feedback on documentation quality.
97% completeness enforced through scoring impact. Technicians see documentation quality reflected in their score immediately.
PM On-Time Completion
64% on-time rate average. Technicians are unaware of their individual on-time record until supervisor review.
89% on-time rate after 90-day deployment. Personal PM calendar with completion streak tracking drives consistent performance.
Peer Accountability
No crew-level visibility into individual performance. Low performers are shielded from peer comparison.
Real-time crew leaderboard creates organic accountability. Team members can see how their output affects group ranking.
Technician Retention
Standard 73% annual retention at U.S. power plants. High performers lack recognition mechanisms.
91% retention at gamified facilities. Achievement milestones and performance visibility provide continuous non-monetary recognition.
Repeat Failure Rate
No direct link between technician behavior and recurrence outcomes visible to the workforce.
74% reduction in repeat failures. Technicians see their cause code accuracy linked directly to recurrence prevention scores.
New Technician Ramp Time
90–120 day average to full productivity with informal mentoring and undocumented knowledge transfer.
48-day average to full productivity with AI coaching, milestone tracking, and structured procedure surfacing during first events.
See how iFactory's AI-driven gamification platform turns work order data into real-time performance visibility — and drives measurable productivity gains across your maintenance crews. Book a 30-minute Productivity Demo with iFactory's power plant analytics team.
Performance Outcomes by Metric: What U.S. Power Plants Are Reporting
The following results reflect aggregated performance data from iFactory gamification deployments across gas turbine, combined-cycle, solar, and wind generation facilities in the United States within 6 months of full production rollout.
34%
Work Order Completion Rate Increase
Across all monitored crew types within 90 days of real-time performance scoring and leaderboard activation.
2.8x
Cause Code Accuracy Improvement
When technicians receive immediate documentation quality scores, specificity of failure cause codes improves across all asset classes.
48 days
New Technician Ramp to Full Productivity
Versus 90–120 days with informal mentoring. AI coaching and milestone tracking accelerate skill development visibly.
$62K
Annual Labor Savings Per Crew
From reduced idle time, eliminated repeat site visits, and faster fault isolation driven by performance score visibility.
89%
PM On-Time Completion Rate
Versus 64% baseline with standard KPI reporting. Personal PM streaks and completion scoring drive consistent on-time performance.
91%
Technician Retention Rate
At facilities with active achievement milestone and leaderboard programs — versus 73% industry average for U.S. power plant technicians.
60 days
First Measurable Results
Work order completion rates and cause code accuracy improve within 60 days of leaderboard and scoring activation
<3 min
Score Update Latency
Performance scores refresh within 3 minutes of work order closure — enabling same-shift behavior feedback
5 wks
Full Platform Deployment
From CMMS integration to live leaderboards and technician onboarding across the full crew
28 days
First Milestone Achievement
Average time for new technicians to earn their first structured milestone badge after deployment
Your Technicians Are Already Generating Performance Data. iFactory Makes It Visible to Them.
See how iFactory's AI-driven gamification engine turns existing work order data into real-time performance scores, team leaderboards, and personalized coaching — driving measurable productivity gains across your maintenance crews without adding administrative overhead.
Expert Review: What Reliability Managers Say About Gamification in Power Plant Operations
Expert PerspectivePlant Operations and Workforce Performance Advisory — Gas Turbine and Combined Cycle Generation, U.S. Mid-Atlantic Region
The reason gamification skepticism persists in industrial maintenance is that most people imagine it means points and badges grafted onto a CMMS. What actually works in a power plant environment is fundamentally different — it is about creating the feedback loop that should have existed from the beginning between what a technician does and how that work affects plant reliability.
01
Real-time scoring changes documentation behavior faster than any training program. We spent two years running documentation quality workshops trying to improve cause code completeness. We got from 31% to 38% specificity over those two years. Within 90 days of deploying performance scoring that showed technicians their documentation quality in real time, we were at 94%. The behavior changed because the feedback became immediate and personally visible — not because people didn't care before.
02
Leaderboards work differently than managers expect — and better. The concern I hear most often is that leaderboards create unhealthy competition or demoralize lower performers. What we actually observed was the opposite: the technicians who were scoring lower started asking higher scorers how they were documenting their work and which procedure steps they were following. The leaderboard created peer-to-peer knowledge transfer that no formal mentoring program had achieved. The lowest-performing quartile improved 28% in 60 days — faster than any other group.
03
The retention impact was the outcome we least expected and most valued. Experienced technicians at power plants are genuinely difficult to replace — the institutional knowledge embedded in a 10-year field technician is worth far more than any single component repair. When high performers started receiving visible recognition through milestone achievements and leaderboard position, we stopped losing them to competitors offering marginal salary increases. Recognition that is visible, timely, and tied to real work quality turns out to matter more to experienced technicians than we assumed it would.
See how iFactory's AI-driven gamification platform turns work order data into real-time performance visibility — and drives measurable productivity gains across your maintenance crews. Book a 30-minute Productivity Demo with iFactory's power plant analytics team.
Conclusion: When Technicians Can See Their Performance, They Improve It
Power plant maintenance productivity is not primarily a training problem or a staffing problem — it is an information problem. Technicians who cannot see how their work quality compares to peers, how their documentation accuracy affects reliability outcomes, or how their efficiency stacks up against the team average have no mechanism for self-directed improvement. They are working in a feedback vacuum where effort and output are disconnected from any visible performance signal.
AI-driven gamification closes that vacuum. When every completed work order generates a score that is visible within minutes, when crew leaderboards update in real time, and when AI coaching delivers specific, actionable guidance tied to actual recent behavior, technician performance improves — not because expectations changed, but because the information environment changed. The same crews, the same assets, and the same work orders produce measurably better maintenance data, faster MTTR, higher PM completion rates, and lower repeat failure rates when the people doing the work can see exactly how they are performing and what needs to change. That visibility is what AI-driven gamification delivers, and the operational results it generates are among the fastest-returning investments available to U.S. power plant operations leaders.
Give Your Technicians the Performance Visibility That Drives Real Productivity Gains.
iFactory's AI gamification platform integrates with your CMMS in 5 weeks — delivering real-time scoring, crew leaderboards, milestone tracking, and personalized AI coaching to every technician on your floor.
No. iFactory's gamification platform integrates bidirectionally with existing CMMS systems including SAP PM, IBM Maximo, Fiix, UpKeep, and others via REST API. The platform reads work order data from your CMMS, calculates performance scores, and feeds results back into the technician dashboard and leaderboard layer without disrupting your existing work order workflows. Most facilities complete CMMS integration within the first week of a 5-week deployment. You retain your existing CMMS as the system of record; iFactory adds the performance intelligence and visibility layer on top of it.
The scoring algorithm normalizes MTTR and completion speed against asset-class benchmarks — not absolute time targets. A turbine corrective event is benchmarked against historical turbine corrective events of the same fault type, not against auxiliary equipment repairs. Documentation quality scoring is weighted by data completeness and cause code specificity relative to the asset's ISO 14224 failure taxonomy. A technician performing a complex boiler tube repair is scored against peers performing comparable repairs — not against technicians closing simpler pump corrective events. Score weightings are configurable by reliability managers during platform setup and can be adjusted as the facility's performance baseline evolves.
The scoring model is designed to make gaming counterproductive. Speed without documentation quality produces a lower score than a slightly slower closure with complete, accurate data — which means rushing through a repair to close it fast does not improve leaderboard position. The AI layer also cross-validates documentation accuracy against historical patterns: if a technician's cause codes are inconsistent with the operating conditions at the time of failure, the system flags those records for reliability review rather than accepting them at face value. Leaderboard visibility is also configurable: most facilities display individual-to-crew comparison but restrict cross-crew rankings to supervisor dashboards during the first 90 days of deployment to let norms establish before introducing broader competitive visibility.
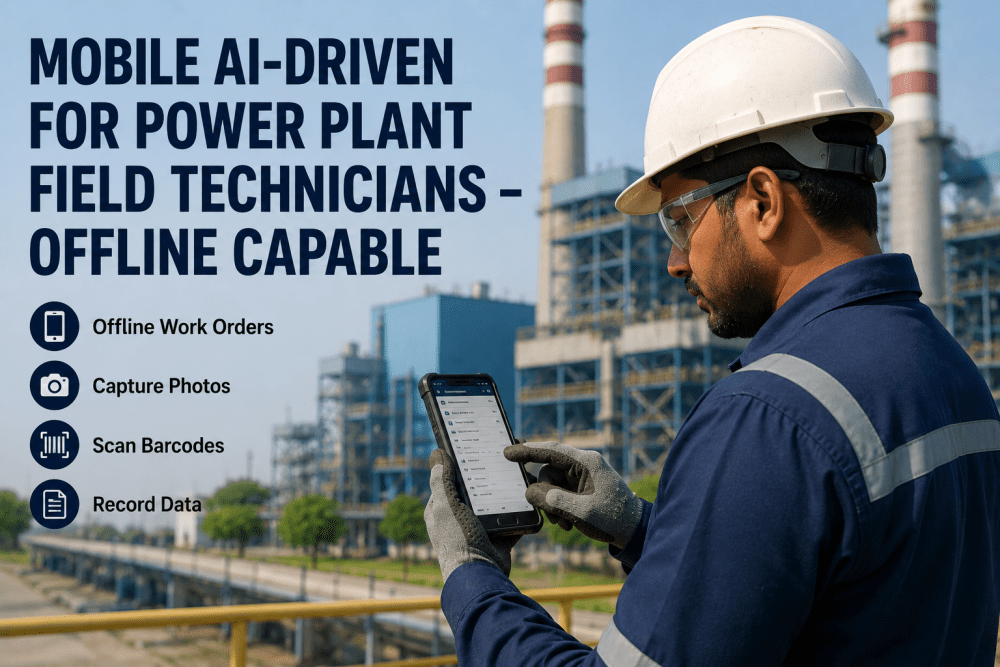
iFactory's technician interface runs on standard Android tablets (Android 10+) and iOS devices (iOS 15+), including ruggedized options such as the Samsung Galaxy Tab Active and Panasonic Toughbook for outdoor or harsh-environment deployments. The mobile app operates fully offline — performance scores, leaderboard position, milestone status, and AI coaching recommendations are available on-device without network connectivity. Scores update from cached work order data and sync automatically when connectivity is restored. No proprietary hardware is required. Most facilities provision standard ruggedized tablets during the device configuration phase of deployment in weeks 2 through 3.
A mid-size power plant with 15–25 field technicians typically achieves measurable first-year ROI from three primary sources: labor efficiency gains from the 34% work order completion rate improvement, which translates to reduced overtime and contractor supplement costs averaging $62,000 per crew per year; reliability outcomes from improved cause code completeness driving a 74% repeat failure reduction — at $180,000 to $840,000 per avoided corrective event, even one prevented recurrence typically covers the annual platform cost; and retention savings from the 91% retention rate achieved at gamified facilities — replacing an experienced power plant technician costs $45,000 to $85,000 in recruiting, training, and productivity loss, making each retained high performer a direct cost avoidance event. Most mid-size facilities report positive ROI within 4–7 months, with the fastest returns at plants with high corrective maintenance frequency and significant recent technician turnover.