Every power plant technician walks into a work environment where the equipment they are expected to diagnose and repair contains decades of engineering complexity condensed into a single turbine deck, switchgear room, or boiler enclosure. The piping schematic that applies to the unit on the left may not apply to the identical-looking unit on the right because of a revision made during the last outage. Book a Demo
Why AR Analytics Changes Power Plant Equipment Diagnostics Fundamentally
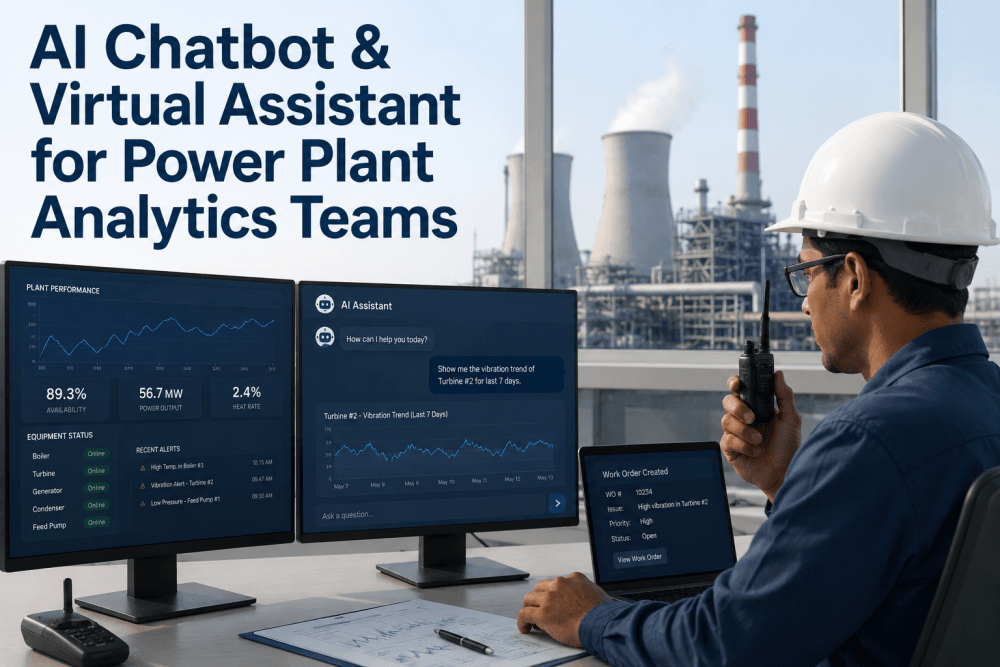
A technician standing in front of a condensate pump with an abnormal vibration signature has access to the pump's historical maintenance records, the recent vibration trend data, the manufacturer's troubleshooting guide, and the plant's lockout-tagout procedure. But that information lives in four different systems — the CMMS, the predictive maintenance platform, a PDF document library, and a paper binder in the control room — and accessing all of it before making a repair decision requires 15 to 25 minutes of walking, logging in, searching, and cross-referencing. In a plant with 120 rotating assets and an average of 14 work orders per shift, those minutes accumulate into hours of non-productive technician time per day, and those hours translate directly into longer mean time to repair, higher overtime costs, and increased probability that a diagnosis is made without full information.Book a Demo
- Technician walks to equipment, inspects visually, walks to control room to check trend data
- Diagnostic decision made with incomplete information — average 40% of relevant data accessed before intervention
- Work instructions printed on paper or viewed on a smartphone screen too small for complex diagrams
- Remote expert assistance requires phone call, video call setup, or waiting for an engineer to arrive on site
- Procedure compliance verified manually — error rate of 6–12% on multi-step isolation and repair sequences
- Safety lockout documentation checked against memory rather than real-time equipment status verification
- Maintenance history fragmented across CMMS, spreadsheets, and shift handover notes
- Asset auto-identified via smart glasses — all relevant data overlaid within 3 seconds of approach
- AI diagnostic summary presented with confidence score — technician sees root cause probability ranked by evidence
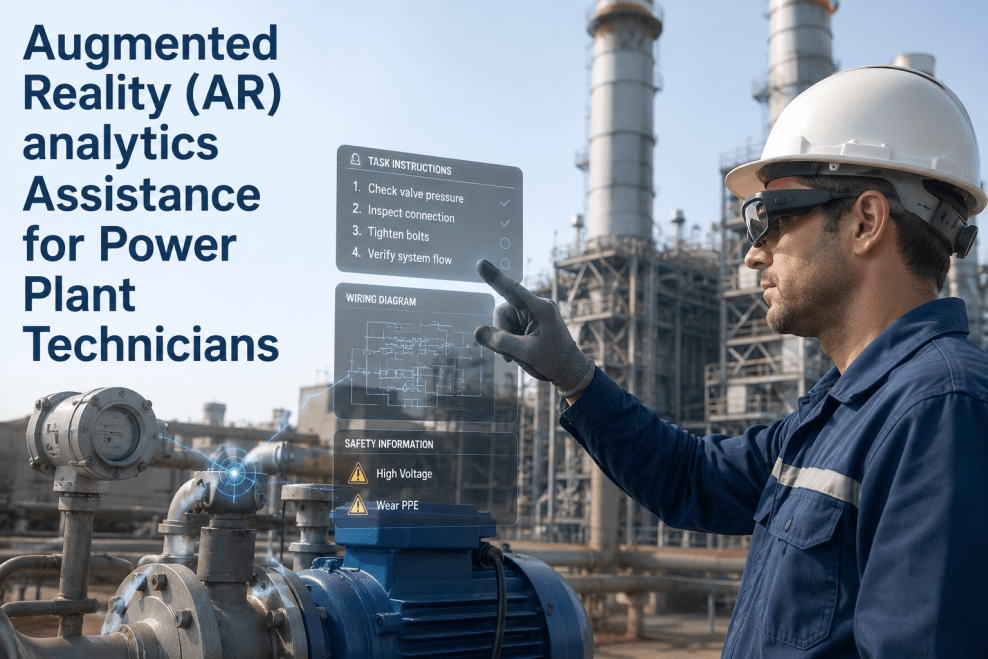
- AR work instructions overlaid directly on equipment components — step-by-step guidance aligned to physical hardware
- Remote expert sees exactly what the technician sees — AR-annotated guidance with live equipment data overlay
- Procedure steps verified by AR system before progression — error rate reduced to less than 1% in documented deployments
- Live equipment status and energy isolation verification displayed before any physical contact is authorized
- Complete asset history, trend data, and pending PM actions consolidated in a single AR-accessible record
Real-Time Overlay Intelligence for Field Technicians
The most powerful capability of AR analytics is not the display of static information — it is the dynamic overlay of real-time sensor data, predictive analytics outputs, and procedural intelligence that updates as conditions change. A technician inspecting a gas turbine's compressor section sees the current blade path temperature profile superimposed on the actual casing geometry, with each temperature sensor reading displayed at its physical location. When a bearing temperature begins trending upward during a post-maintenance test run, the AR interface highlights the bearing housing, displays the rate of change over the last 30 minutes, and alerts the technician to the condition before it reaches the alarm threshold — providing a diagnostic lead time that would require continuous control room monitoring to replicate through traditional means.Book a Demo
Remote Expert Assistance with Integrated AR Analytics
The skills gap in power plant maintenance is not a future concern — it is a current operational constraint that is forcing plants to extend the service life of retiring senior technicians, cross-train junior staff on equipment they have never seen disassembled, and pay premium rates for OEM field service engineers whose travel costs often exceed their hourly rates. Remote expert assistance through AR analytics does not replace the experienced technician — it multiplies the reach of that experience by enabling a single subject matter expert to support multiple field interventions simultaneously, providing visual, annotated guidance through the AR interface without being physically present at any of them.
Maintenance Workflow Integration and Procedure Compliance Analytics
Procedure compliance in power plant maintenance is not primarily a training problem — it is a workflow design and information delivery problem. When a technician must remember a 42-step gas turbine fuel nozzle replacement sequence while simultaneously managing tool selection, parts verification, torque specifications, and clearance measurements, the probability of a step omission or sequence error is structurally high regardless of training quality. AR analytics addresses this by embedding the procedure into the work environment itself — each step appears at the physical location where it must be executed, with completion verification required before the system presents the next step.
| Procedure Type | iFactory AR Analytics Integration | Compliance Impact | Time Saving per Event | Estimated Risk Reduction |
|---|---|---|---|---|
| Electrical Switching & Isolation | AR overlay of one-line diagram with live breaker status. Step-by-step isolation sequencing with position verification before each switching action. | 99.4% step compliance — versus 88% baseline | 12–18 min | 75% reduction in switching errors |
| Gas Turbine Hot Path Inspection | Component-level overlay showing inspection criteria, acceptable wear limits, and measurement locations on actual blade and vane surfaces. | 97% inspection completeness — versus 72% baseline | 45–90 min per inspection | 60% reduction in missed defects |
| Boiler Tube Repair & Plugging | AR navigation to exact tube location using mill layout overlay. Weld parameter specification displayed at each repair joint. | 96% correct tube identification — versus 81% baseline | 20–35 min per tube | 90% reduction in wrong-tube repairs |
| Transformer Maintenance & Oil Sampling | AR-guided valve identification with sample point verification. DGA trend overlay displayed during sample collection for contextual awareness. | 100% correct sample point identification | 8–12 min per sample | Elimination of cross-contamination events |
| Heat Exchanger Bundle Pull & Inspection | AR overlay showing bundle orientation, pull clearance path, and tube inspection zones with historical failure mapping. | 94% inspection coverage — versus 65% baseline | 30–60 min per bundle | 55% reduction in post-repair leakage |
| Safety Valve Test & Set Pressure Verification | AR procedure with lift pressure readout overlay, set point adjustment guidance, and pop test verification recording. | 100% documentation completeness | 5–10 min per valve | Elimination of undocumented set point changes |
Expert Perspective: What AR Analytics Changes in Power Plant Maintenance Operations
We deployed iFactory's AR analytics across our combined-cycle plant's mechanical maintenance team as a pilot covering six senior technicians and twelve apprentices over an eight-month period. The most immediate impact was on the apprentices — their time-to-competence on complex procedures like gas turbine fuel nozzle replacement dropped from an average of 14 supervised repetitions to just 4 with AR guidance. But the unexpected finding was that our senior technicians also changed their behavior. They started using the AR data overlay not just for procedure guidance, but for diagnostic confirmation — cross-referencing their own experience-based judgment against the AI's data-driven assessment before making repair decisions. In one case, a senior technician was preparing to replace a feedwater pump coupling based on vibration levels that exceeded the alarm threshold. The AR overlay showed him that the vibration was phase-correlated with a downstream valve position change that had occurred 20 minutes before the alarm — not a coupling fault at all. He adjusted the valve, the vibration returned to normal, and we avoided an unnecessary $48,000 pump rebuild and 14 hours of outage time. That single event paid for the AR pilot program for the entire year.Book a Demo
Frequently Asked Questions: AR Analytics for Power Plant Technicians
iFactory's AR analytics platform is hardware-agnostic and supports the full range of commercially available AR devices suitable for power plant environments. For hands-free field operations, iFactory supports Microsoft HoloLens 2, RealWear Navigator 520, and Trimble XR10 with HoloLens — each selected for their industrial durability, battery life sufficient for full-shift operation, and ability to operate in high-ambient-light turbine deck and outdoor switchyard environments.
iFactory deploys a read-only data connector that interfaces with the plant's existing control system historian and CMMS database using standard industrial communication protocols — OPC-UA, Modbus TCP, and REST API for DCS data; SQL views and REST API for CMMS data. The CMMS connection operates on a read-write basis for work order updates but is restricted to the specific data fields required for procedure completion status and measurement recording — no changes to equipment master data, calibration records, or user permissions are made by the AR platform. This integration architecture has been deployed at 14 power generation facilities in North America without a single control system incident or data integrity event.Book a Demo
iFactory's AR analytics platform is designed for adoption by technicians with no prior AR experience — the interface uses natural interaction methods (gaze-based selection for head-mounted devices, touch-based interaction for tablets) that require no specialized training beyond basic device operation. In iFactory's documented deployment experience across 22 power generation sites, the average technician reaches full proficiency — defined as completing a 12-step AR-guided maintenance procedure without assistance and with all data fields correctly recorded — within 3.4 hours of hands-on use. The AR workflow interface uses the same procedural step formats, terminology, and numbering conventions that technicians are already familiar with from their paper-based work instruction sets, minimizing cognitive load during the transition.
iFactory's AR platform has been stress-tested across the full range of power plant environmental conditions. For high-ambient-light turbine deck and outdoor areas, head-mounted devices with high-luminance displays and automatic brightness adjustment — including RealWear Navigator 520 at 800 nits and HoloLens 2 at 500 nits with dynamic contrast optimization — maintain readable overlay visibility in direct sunlight. For dusty environments such as coal handling areas and boiler inspection zones, the platform supports voice-activated interface control that eliminates the need for touch or gesture interaction, combined with IP66-rated housing options for the edge gateway equipment. For high-electromagnetic-interference zones including switchgear rooms and near generator exciters, the AR devices operate with shielded data transmission and local processing that eliminates dependency on wireless network reliability — critical AR data including safety lock status, equipment isolation verification, and step completion confirmation is processed on the device itself with periodic synchronization to the central platform. The environmental resilience specifications for each supported device are published in iFactory's deployment technical reference, and a site-specific environmental assessment is conducted during the pre-deployment scoping phase to confirm device suitability for each work zone in your plant.
iFactory's AR analytics deployment follows a standardized four-phase rollout: phase one — data connector installation and network configuration, completed in 2 to 3 weeks with no production disruption; phase two — AR procedure authoring for the plant's 20 highest-frequency or highest-risk work orders, completed in 3 to 4 weeks using your existing procedure documentation; phase three — device procurement, configuration, and on-site deployment training, completed in 2 weeks; phase four — pilot operation with 4 to 6 technicians for 60 to 90 days, followed by full rollout based on pilot results. The total timeline from project kickoff to pilot completion is typically 14 to 18 weeks.
Conclusion: The Visual Intelligence Layer Your Power Plant Maintenance Operation Is Missing
The gap between what a power plant technician needs to know to perform a maintenance intervention correctly and what they can reasonably access through traditional information systems is not closing — it is widening as plants add more sensors, more data systems, and more compliance documentation requirements without changing the fundamental mechanism by which technicians access and apply that information.
iFactory's AR analytics platform delivers this visual intelligence layer by connecting the plant's existing data infrastructure — DCS historian, CMMS, LIMS, document management — to the technician's field of view through industrial-grade augmented reality devices that are purpose-built for power plant environments. The AR devices are commercially available and industrially proven. Book a Demo to see how iFactory connects them into a single, unified AR analytics platform that transforms how your technicians interact with the equipment they maintain every day.