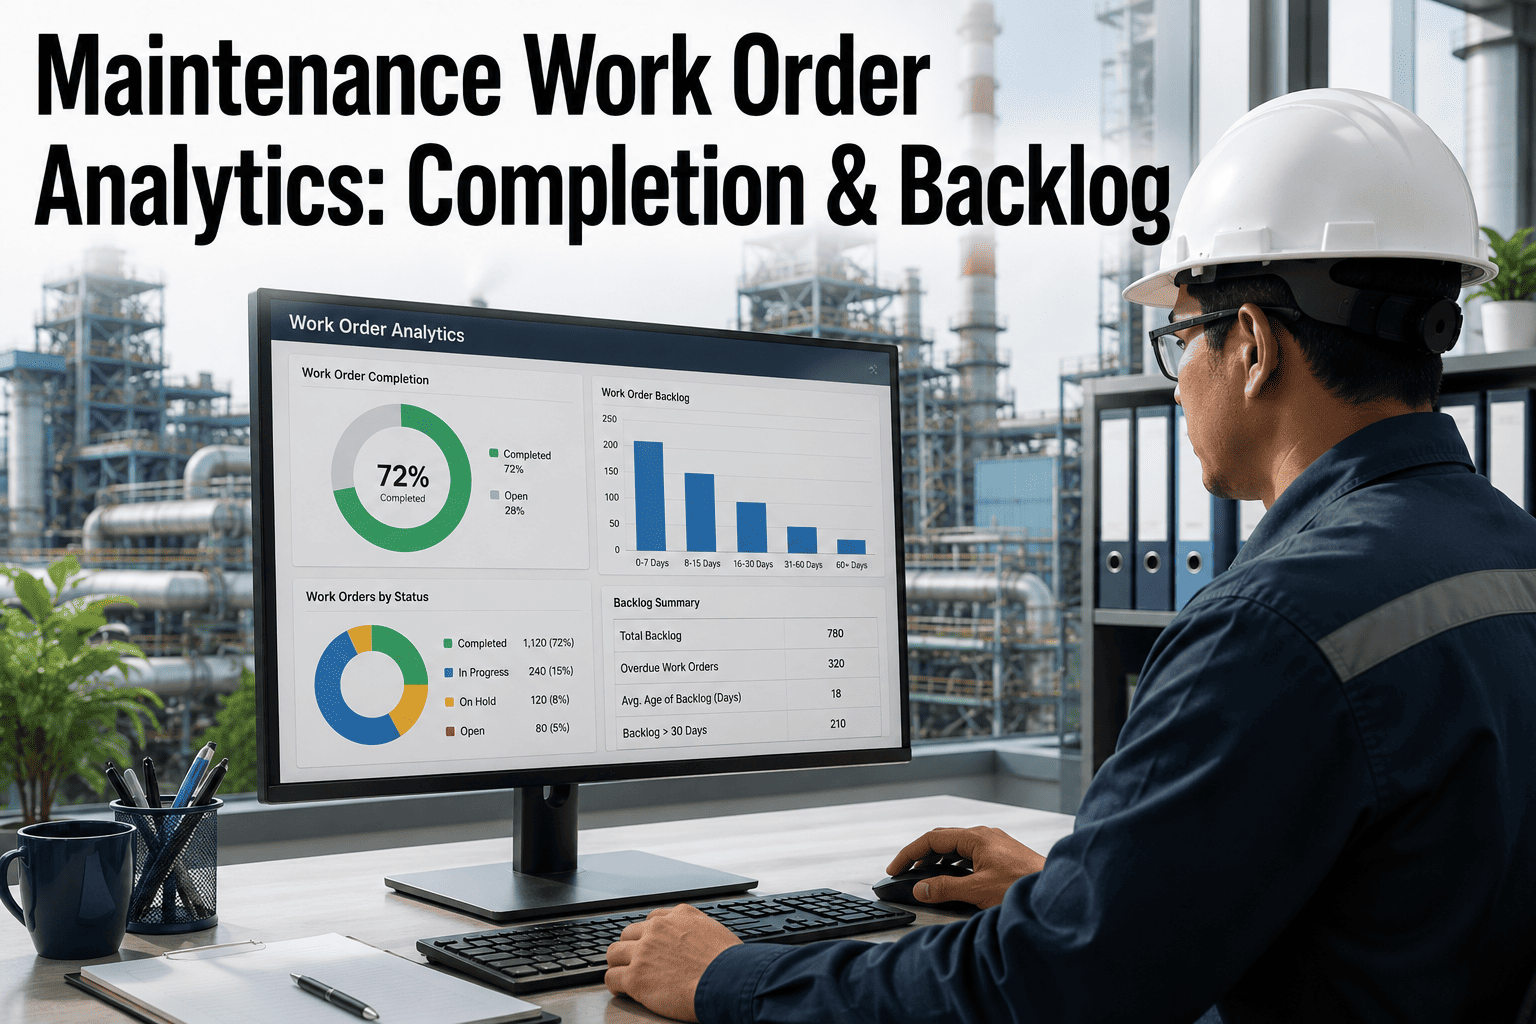
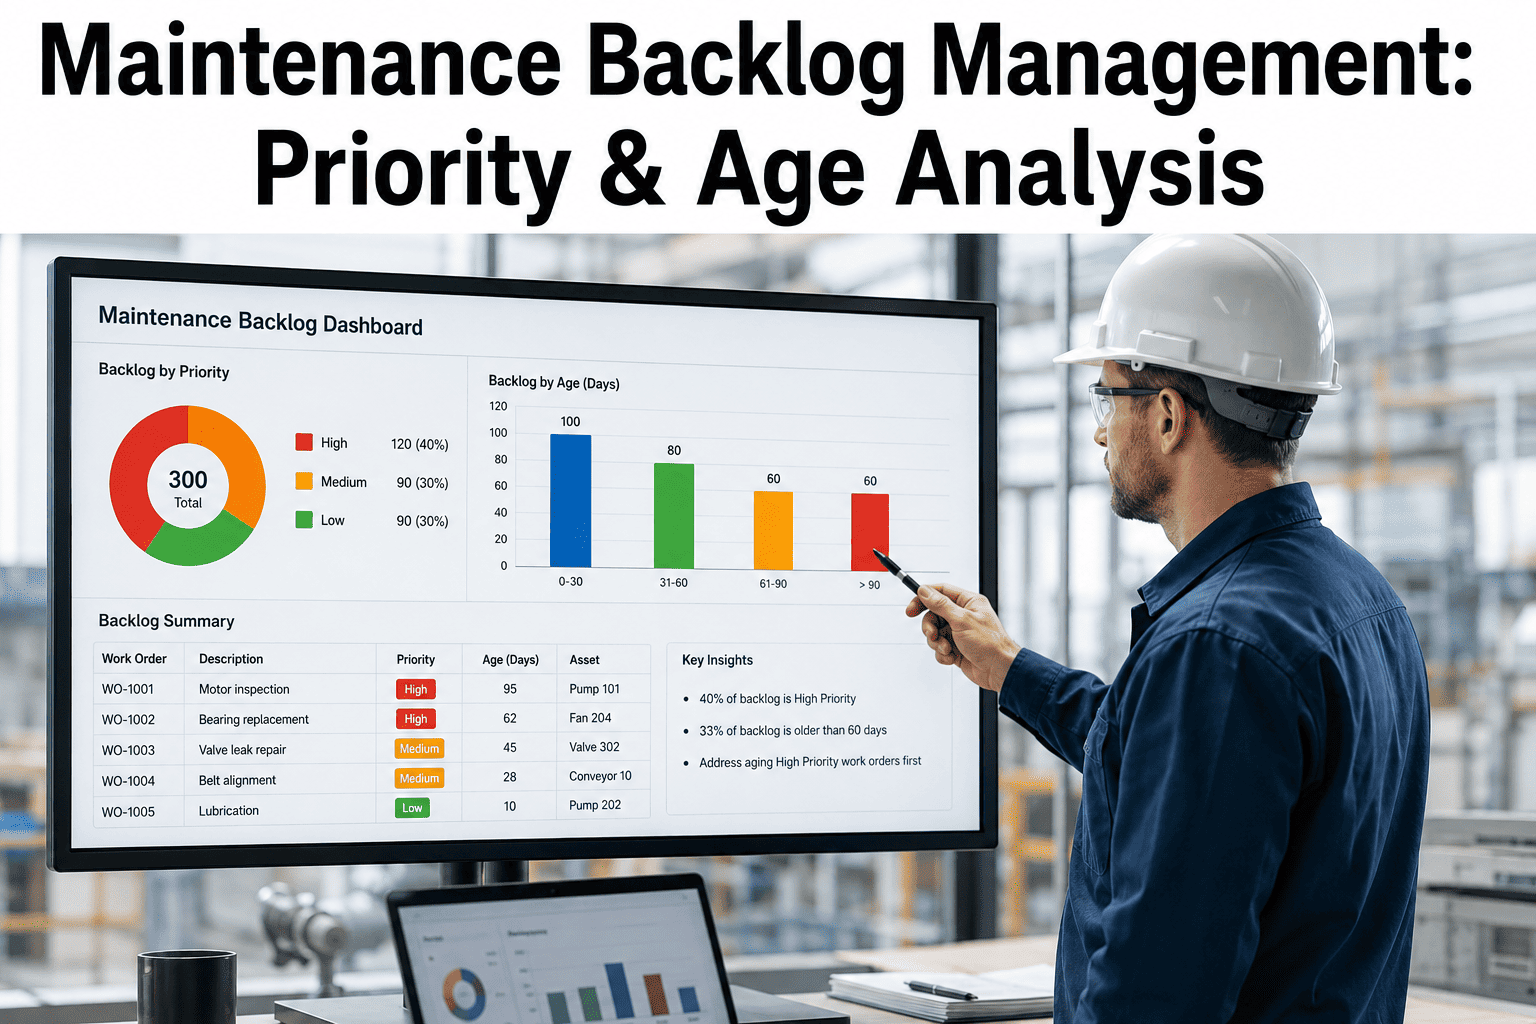
Your CMMS dashboard shows a work order completion rate of 91% this month. On paper, that looks like a program running comfortably inside the world-class range maintenance leaders chase. But pull the backlog report sitting underneath that number and a different story appears — 340 open work orders, dozens of them sitting untouched for more than ninety days, quietly excluded from the completion-rate math because they were never formally closed, never cancelled, and never flagged as late. A high completion rate calculated against a shrinking, hand-picked denominator is not evidence of a healthy maintenance program. It is evidence of a metric that has stopped measuring what it was originally built to measure. If your backlog has been drifting in one direction for the last two quarters while your completion rate stays flat, book a diagnostic walkthrough with the iFactory team.
Diagnostic Guide · Work Order & Backlog Analytics
Maintenance Work Order Analytics: The Completion Rate, Backlog, and Resource KPIs That Actually Predict Failure
A maintenance manager's playbook for reading work order data the way it deserves to be read — as a leading indicator of program health, not a lagging scoreboard that gets closer to 100% every time a stale ticket gets quietly dropped.
90%+
Completion rate that top-performing programs sustain on a rolling 30-day basis
90–95%
PM compliance range that separates world-class programs from average ones
25–35%
Typical wrench-time share of a technician's paid shift industry-wide
3–5x
Cost multiplier of an emergency repair versus the same job done as scheduled work
The Report That Looks Fine
Two Numbers, One Data Set, Two Completely Different Conclusions
What the scoreboard shows
Completion rate 91%. PM compliance 88%. Both numbers get reported up the chain every month, both land inside a range that reads as acceptable, and both get nodded through in the operations review without further discussion. The scoreboard tells leadership that the maintenance function is functioning.
What the backlog shows
Beneath that scoreboard sits 340 open work orders. Roughly a third of them have been open for more than 30 days. A smaller but growing cluster has been open for more than 90. None of these figures reduce the completion rate, because the completion rate only measures work orders that were closed against work orders that were opened in the same window — it says nothing about the work orders nobody closed at all.
The mathematical trick is simple and almost never intentional: a work order that never gets touched never enters the completion-rate calculation as a failure. It just sits in the backlog, aging quietly, until someone finally asks why the backlog is three times larger than it was a year ago and the completion rate somehow never moved.
KPI Reference Layer
The Eight Work Order Metrics Worth Tracking Together
No single work order KPI tells the full story on its own. Completion rate without backlog context can be gamed. PM compliance without a reactive-ratio check can hide a program that is completing preventive tasks while drowning in unplanned work. The table below is the minimum set most reliability-mature programs track as a single reviewed package, not as isolated numbers pulled up individually when someone asks.
| KPI |
Formula |
Benchmark |
What It Actually Tells You |
| Work Order Completion Rate |
Completed ÷ Opened × 100 |
90%+ rolling 30-day |
Throughput capacity, but only for work orders that entered the count |
| PM Compliance Rate |
PMs done on time ÷ PMs scheduled × 100 |
90–95%+ world class |
Whether preventive work is protecting reliability or slipping |
| Planned vs Reactive Ratio |
Planned hours ÷ Total labor hours |
70–80%+ planned |
Whether the team is working ahead of failures or chasing them |
| Mean Time To Repair |
Repair time ÷ Number of repairs |
4–6 hrs emergency, 8–16 hrs routine |
Diagnostic speed and technician competency on active jobs |
| First-Time Fix Rate |
Jobs fixed on first visit ÷ Total jobs |
85%+ |
Diagnostic accuracy and parts/tooling readiness |
| Schedule Compliance |
Work orders completed on schedule ÷ Scheduled |
90%+ |
Planning discipline separate from raw completion volume |
| Backlog (hours or count) |
Sum of open work order estimated hours |
2–4 weeks of crew capacity |
Whether demand is outpacing available labor capacity |
| Wrench Time / Utilization |
Hands-on repair time ÷ Paid shift time |
25–35% avg, 45–55% world class |
How much of a technician's day is lost to travel, waiting, and paperwork |
The Denominator Problem
Three Ways a Completion Rate Climbs While a Program Gets Worse
A completion rate is a ratio, and every ratio can be improved by changing either the numerator or the denominator. Reliability-mature teams watch for the denominator moving quietly in the background while the headline number looks stable or even improving.
01
Silent backlog exclusion
A work order that is never formally closed, cancelled, or re-scoped simply ages in the background. It never counts against the completion rate because it was never part of the "opened this period, must be closed this period" calculation the KPI is built on.
02
Task-splitting inflation
A single complex repair gets logged as five smaller work orders instead of one. Each small task closes faster, the completion count rises, and the completion rate improves — while the total time to actually restore the asset has not changed at all.
03
Premature closure
A technician marks a work order complete to hit a shift-end target, and the underlying fault resurfaces within days as a new, unrelated-looking ticket. The completion rate books a win twice — once for the original closure, once when the "new" problem eventually gets solved.
Worked example — mixed fleet maintenance shop
A twelve-technician shop reports a 93% completion rate for the quarter, comfortably above the 90% benchmark. A backlog-age audit run alongside that number finds 61 work orders older than 60 days, none of which were counted as failures because none had a due date attached at creation. Once those 61 orders are re-scoped with proper due dates, the true on-time completion rate for the quarter drops to 74% — nineteen points below what the scoreboard was reporting, and squarely in the range that should trigger a resourcing review rather than a passing grade.
See What Your Backlog Is Hiding
Most Programs Find 15–25 Points of Hidden Completion-Rate Gap in Their First Audit
iFactory's work order analytics layer sits alongside your existing CMMS and re-computes your KPIs against the full backlog — not just the work orders your current reports choose to count. No migration, no re-entry of historical data, no disruption to how technicians already log work.
Backlog Aging Framework
Not All Open Work Orders Carry the Same Risk
Backlog size alone is a weak signal. A shop with 200 open work orders averaging four days old is healthier than a shop with 80 open work orders averaging seventy days old. Age band is the variable that actually predicts risk, and it deserves its own tracked category rather than being buried inside a single backlog count.
| Age Band |
Risk Level |
What It Usually Means |
Recommended Action |
| 0–7 days |
Healthy |
Normal flow through the schedule |
No action — standard queue |
| 8–30 days |
Watch |
Waiting on parts, low priority, or scheduling gap |
Weekly review by supervisor |
| 31–60 days |
At Risk |
Resourcing conflict or repeated re-prioritization |
Escalate to planner, re-scope if needed |
| 61–90 days |
Chronic |
Structural capacity or skills gap on this work type |
Root-cause review, consider contractor support |
| 90+ days |
Stale |
Likely no longer accurate scope, or genuinely stuck |
Formal review — close, re-scope, or fund properly |
A program with more than 10–15% of its backlog sitting in the Chronic or Stale bands is not experiencing a temporary staffing dip — it is carrying a structural gap between demand and capacity that a completion-rate KPI, by design, cannot see.
Age-band tracking also changes how a backlog conversation with leadership actually goes. A raw backlog count invites a defensive response, because it sounds like an accusation of falling behind. An age-band breakdown invites a planning response instead, because it separates the healthy queue from the genuinely stuck work and points directly at where a resourcing decision or a process fix would have the most leverage.
Root Cause Layer
Where Backlog Growth Actually Comes From, Ranked
Once backlog is broken into age bands, the next question is why work orders are aging in the first place. Across the mixed-fleet and process-plant programs iFactory has profiled, the same handful of causes account for most of the chronic and stale backlog, and they rarely show up evenly.
Technician capacity shortfall
Open headcount, unplanned absence, or a skills mismatch between the work queue and the crew on shift. This is usually the largest single contributor to chronic backlog and the hardest to fix quickly.
Parts and inventory unavailability
A work order stalls the moment a technician discovers the part isn't on the shelf. Without a tie between the work order system and inventory levels, this shows up as "waiting" status with no visibility into how long the wait will last.
PM over-scheduling
A preventive maintenance program calibrated years ago keeps generating tasks at a frequency the current crew size cannot absorb, crowding out time for both corrective work and the PM tasks that matter most.
Dispatch and prioritization gaps
Work orders get assigned in creation order rather than criticality order, so a low-risk cosmetic repair sits ahead of a bearing running hot on a bottleneck asset simply because it was logged first.
Resource Utilization Layer
Where a Technician's Paid Shift Actually Goes
Wrench time — the share of a shift spent physically doing repair work — is the utilization number that most directly explains why completion rates plateau even when headcount looks adequate on paper. Industry-wide, wrench time averages 25–35% of a paid shift; world-class programs push it to 45–55%. The gap between those two numbers is almost never technician effort. It is almost always structural.
~30%
Wrench time
Hands-on diagnosis and repair — the only category directly reducing backlog
~20%
Travel between jobs
Walking or driving between the shop, the storeroom, and the asset location
~25%
Waiting on parts or approval
Idle time between diagnosis and the moment the repair can legally or physically proceed
~15%
Documentation and admin
Logging work orders, closing tickets, recording readings and parts used
~10%
Other and idle
Meetings, breaks beyond policy, and unassigned gaps in the schedule
Closing five points of the wrench-time gap on a twelve-technician crew is roughly equivalent to adding a technician and a half to the schedule — without adding headcount, and without touching the completion-rate calculation directly.
Implementation Roadmap
From Vanity Metric to Defensible Backlog Pareto in Six Weeks
Week 1–2
Audit and Baseline
Pull the full open work order list, not just the current-period report. Tag every open order with a creation date and age band. Recalculate completion rate against the true backlog rather than the reported denominator.
Week 3
Root Cause Tagging
Classify every work order in the Chronic and Stale bands by cause — capacity, parts, PM overload, or dispatch. Validate the tagging with supervisors who know the shop floor context behind each stuck ticket.
Week 4
Build the Weighted Pareto
Rank causes by total backlog hours contributed, not event count. Identify the two or three causes responsible for most of the aged backlog and present that ranked list to leadership alongside the corrected completion rate.
Week 5–6
Resourcing and Verification
Deploy targeted fixes — contractor support, inventory buffer adjustments, PM interval recalibration, or dispatch rule changes — against the top causes. Re-measure backlog age distribution monthly using the same method, not a fresh reset.
Alert Thresholds
When a KPI Crossing a Line Should Trigger a Conversation
Completion Rate
Below 85%
Sustained for two or more consecutive periods signals a capacity or prioritization problem worth a formal review, not just a note in the monthly deck.
PM Compliance
Below 85%
Predicts a rising emergency work order rate within four to eight weeks — this is a leading indicator, not a lagging one, and deserves to be treated that way.
Reactive Ratio
Above 30%
Reactive work above this line is actively displacing preventive capacity, which compounds the problem it was caused by in the following period.
Chronic + Stale Backlog Share
Above 15%
This is the clearest single indicator that demand has structurally outpaced capacity rather than experiencing a temporary dip.
Treat these thresholds as trigger points for a conversation, not as automatic verdicts on team performance. A single bad month driven by a known event — a major turnaround, a storm, a supplier shortage — should be annotated and excluded from trend analysis rather than allowed to quietly reset what "normal" looks like for the program going forward. The value of a threshold is in catching a sustained drift early, before it becomes the new baseline everyone has unconsciously accepted.
Practitioner Perspective
Every maintenance leader I have worked with inherited a completion-rate KPI that was built with good intentions and then quietly stopped meaning what it was supposed to mean. Nobody set out to game it. It happened one small decision at a time — a work order that never got a due date, a stale ticket left open because nobody wanted to be the one to close it without a fix, a big job split into smaller pieces because the smaller pieces closed faster. None of that is dishonest. It is just what happens when a single ratio carries the entire weight of a program's credibility. The fix is not a better dashboard. It is measuring backlog age and root cause with the same discipline you already apply to completion rate, so the two numbers can finally check each other instead of one quietly compensating for the other.
Marcus Whitfield
Reliability & Maintenance Program Manager · 16 years across mixed fleet, discrete manufacturing, and process industries · Former CMMS Implementation Lead for a multi-site industrial operator
Frequently Asked
Work Order Analytics — Common Questions from Maintenance Leaders
Why can our completion rate look healthy while our backlog keeps growing?
Completion rate is calculated as work orders closed divided by work orders opened within a defined window, which means a work order that is never formally closed simply never enters the equation as a failure. It ages quietly in the backlog instead. A shop can post a 90%+ completion rate every single month while its backlog of untouched, undated, or improperly scoped tickets grows steadily larger in the background, because the two metrics are measuring fundamentally different populations of work. This is exactly why backlog age distribution needs to be tracked as its own KPI rather than folded into a single completion-rate number. If you want to see how your own completion rate holds up once it is recalculated against your true open backlog,
book a diagnostic session with iFactory.
What is a good backlog size, and does a bigger backlog always mean a problem?
A commonly used rule of thumb is that a backlog equal to two to four weeks of available crew capacity is manageable, while anything sustained well beyond that starts to signal a structural resourcing gap. But raw size is a weaker signal than age distribution — a large backlog made mostly of work orders under thirty days old reflects normal queue flow, while a much smaller backlog with a meaningful share sitting past ninety days reflects a program that is genuinely stuck on specific categories of work. The age-band breakdown almost always tells a more actionable story than the total count alone, because it points directly at which work is at risk rather than just how much work exists.
How do we figure out whether our backlog problem is a labor shortage or something else?
Tag every work order sitting in the chronic or stale age bands with a root cause — technician capacity, parts and inventory unavailability, PM over-scheduling, or dispatch and prioritization gaps — and then total the backlog hours attributable to each cause rather than counting individual tickets. In most programs, one or two of these causes account for the majority of aged backlog hours, and it is rarely the cause leadership initially assumes. A capacity shortfall calls for staffing or contractor support, while a parts-driven backlog calls for inventory policy changes instead, and applying the wrong fix to the wrong root cause wastes a budget cycle without moving the KPI.
Reach out to our support team for a walkthrough of how the root-cause tagging process works against your own work order history.
What is wrench time and why does it matter more than headcount?
Wrench time is the percentage of a technician's paid shift spent actually performing hands-on repair or diagnostic work, as opposed to traveling between jobs, waiting on parts or approvals, or completing documentation. Industry averages sit at 25 to 35 percent, while world-class programs reach 45 to 55 percent, and that gap represents lost repair capacity that no amount of additional hiring will fully solve on its own. A program that closes even five to ten points of wrench-time gap through better dispatch, parts staging, or mobile documentation tools often gains the equivalent of an additional technician or more without adding a single person to the roster, which makes it one of the highest-leverage levers available before resorting to headcount growth.
How quickly can we expect to see our KPI dashboard reflect the real picture?
A full backlog audit and age-band reclassification of an existing work order history typically takes one to two weeks once access to the CMMS export is available, with root-cause tagging and the first weighted Pareto ready by the end of week three or four. Most programs see their corrected completion rate land noticeably below the previously reported figure in that first pass, which is expected and is the entire point of the exercise — it converts a single misleading scoreboard number into a diagnostic tool leadership can actually act on.
Book a session to see the timeline applied against a work order data set similar to yours.
Ready to See What Your Completion Rate Isn't Telling You?
Turn a Single Misleading Ratio Into a Defensible Backlog Roadmap
iFactory's work order analytics layer connects to your existing CMMS and recalculates your core KPIs against your full backlog, not the pre-filtered version your current reports show. Within two to three weeks you will have an age-banded backlog view, a root-cause Pareto, and a corrected completion rate leadership can actually trust.