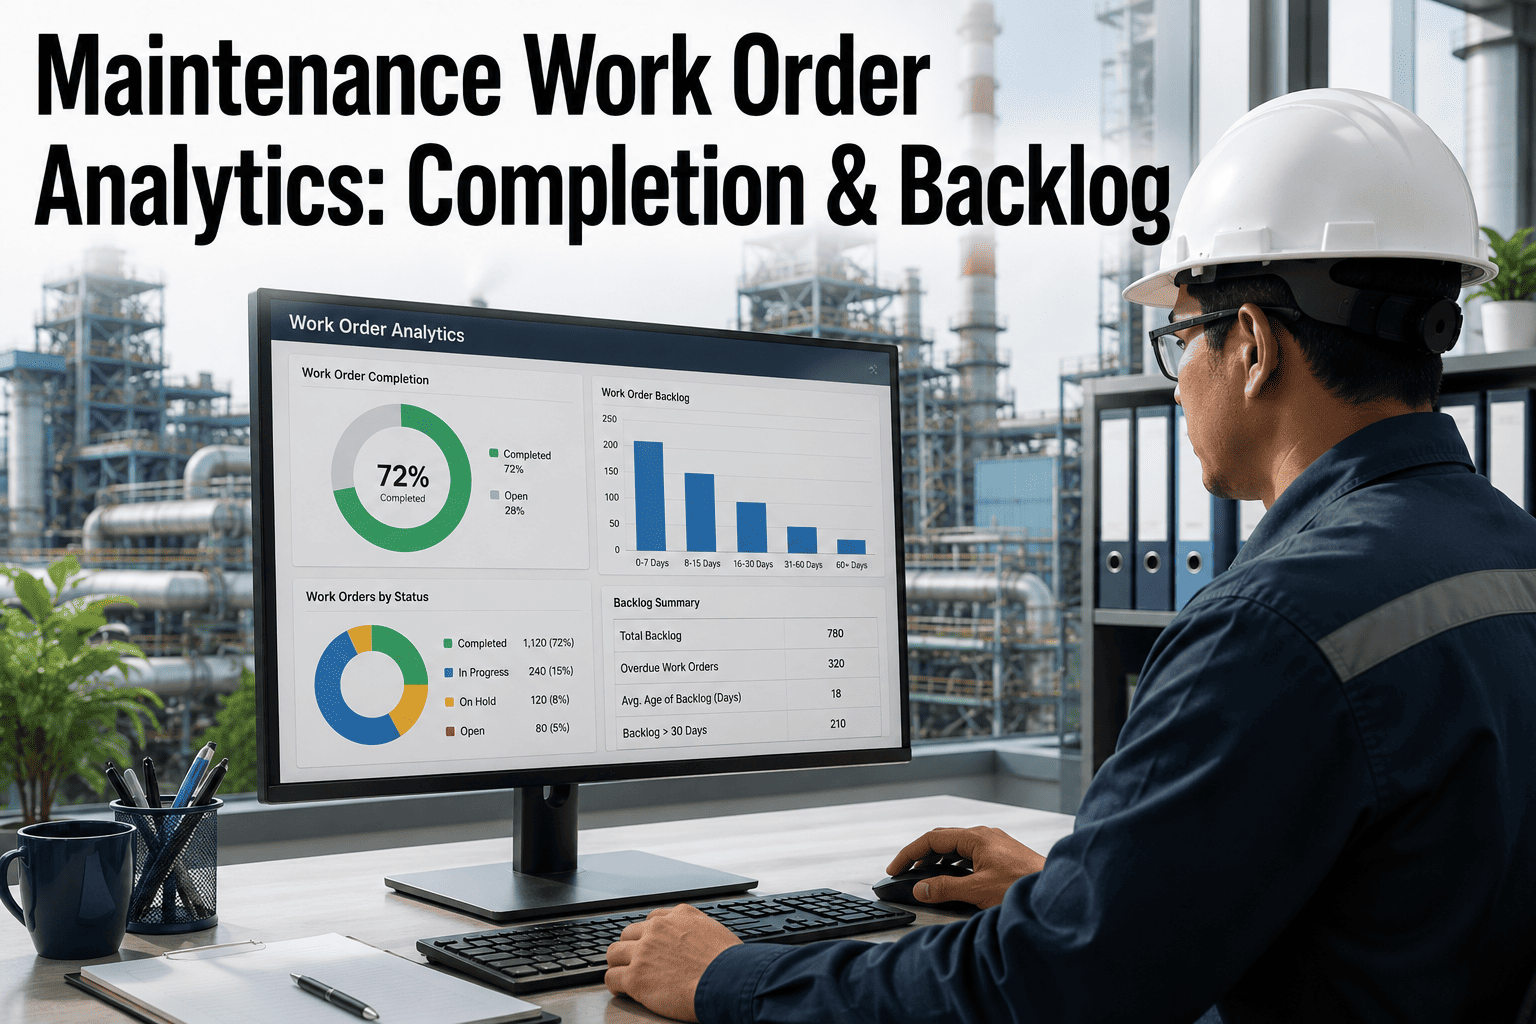
Every power plant maintenance team carries a backlog, but the size of that list tells you almost nothing on its own. What actually predicts unplanned downtime is how that backlog is prioritized and how long individual work orders have been sitting untouched. Reliability benchmarks across continuous-process plants put a healthy ready-to-schedule backlog at one to two weeks per craft, with total backlog stabilizing around three to six weeks before risk starts compounding. Most plants still track backlog as a single number on a spreadsheet, which hides exactly the work orders most likely to cause the next trip. AI-driven backlog management fixes this by scoring every open work order on both priority and age in real time, and it surfaces the aging, high-consequence jobs before they turn into a shutdown. Book a demo to see your backlog scored and aged automatically.
Your Backlog Isn't Too Big. It's Unpriced and Unaged.
iFactory continuously scores every work order in your maintenance backlog by failure risk and by how long it has been waiting, so your planners work the list that actually protects uptime instead of the list that came in first.
Why a Single Backlog Number Hides Your Real Risk
Most plants report backlog as one figure in a monthly meeting. That number can be perfectly normal while the plant is quietly carrying safety-critical work orders that have aged past their risk window. The problem is never the count. It is what is buried inside it.
What a Healthy Power Plant Backlog Actually Looks Like
Reliability benchmarks give plants a target range for each backlog category, and both ends of the range matter. Too little backlog usually means labor is being underutilized or the team has stopped generating proactive work, while too much backlog means work is aging and equipment risk is quietly accumulating. The gap between where your plant sits today and where it should sit is the first thing an AI-driven backlog model will show you, broken down by craft rather than as a single blended average.
A Four-Tier Priority Framework That Actually Reflects Risk
iFactory scores every incoming work order against a structured priority framework built on failure consequence, not on who submitted the request or how loudly they escalated it. Each tier carries a different response window and a different automatic escalation trigger, so the priority tag on a work order actually means something consistent across the whole plant rather than varying by which planner happened to enter it.
Four Mistakes That Keep a Backlog Stuck Instead of Shrinking
Plants that struggle to bring their backlog under control usually are not short on effort. They are working against a process that quietly undoes the progress every review cycle makes. These four patterns show up again and again.
Where Your Backlog Is Actually Aging
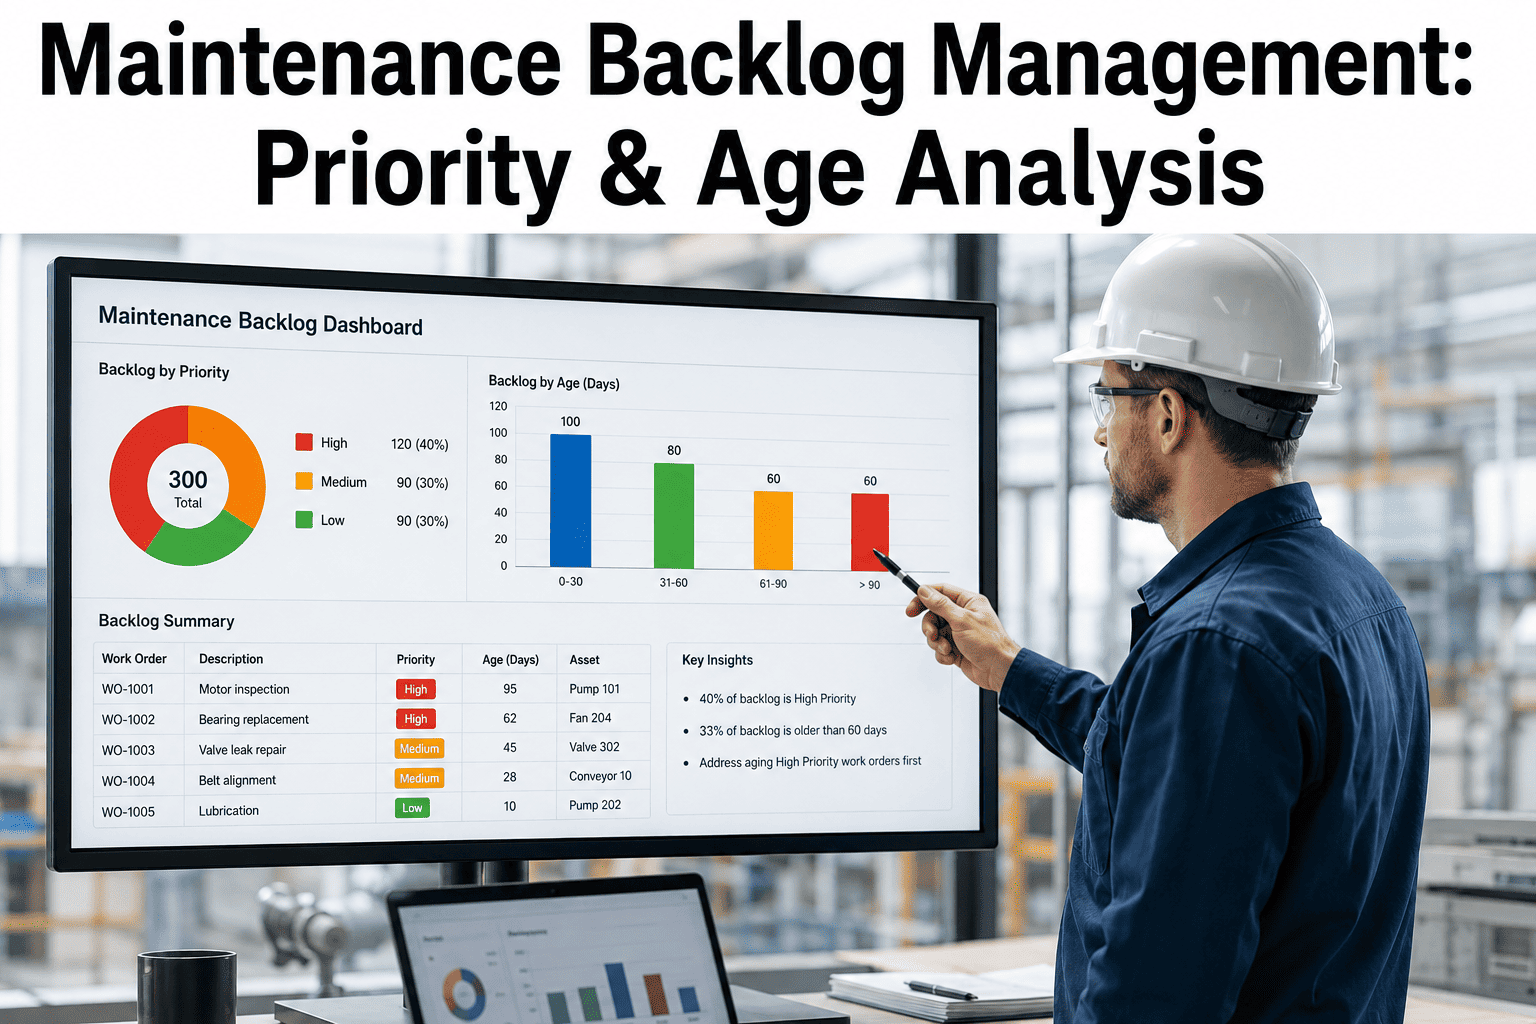
Age analysis breaks the backlog into buckets based on how long each work order has been open, then overlays priority so the highest-risk aging items surface immediately instead of being buried in a total count.
In most unmanaged backlogs, the 8+ week bucket is where P1 and P2 work quietly accumulates because it never gets an automated escalation trigger. AI-driven age analysis cross-references this bucket against priority tier daily, rather than waiting for the monthly backlog review to catch it. Plants that start tracking age this way are often surprised by what they find in the oldest bucket, since it typically contains a mix of genuinely difficult jobs that require an outage window and simpler jobs that were never actually escalated because nobody was looking. Separating those two categories is often the fastest win available, since the simpler jobs can usually be cleared within the next scheduled maintenance week once they are visible.
Spreadsheet Backlog Tracking vs AI-Driven Priority and Age Scoring
Most plants still manage backlog through a CMMS export dropped into a spreadsheet once a week, reviewed by whoever has time before the next planning meeting. That approach worked when backlogs were small enough to scan by eye, but it breaks down quickly once a plant is carrying several hundred open work orders across multiple crafts. Here is how that manual process compares to a continuously scored, priority-and-age-aware system running in the background every day.
| Capability | Manual Spreadsheet Tracking | AI-Driven Backlog Scoring |
|---|---|---|
| Update Frequency | Weekly or monthly manual export and review | Continuous, updated as work orders are created or changed |
| Priority Assignment | Set once at work order creation, rarely revisited | Re-scored dynamically as equipment condition and age change |
| Age Tracking | Visible only if someone manually calculates it | Automatic aging buckets cross-referenced against priority tier |
| Escalation | Depends on someone noticing and raising it manually | Automatic escalation when high-priority work exceeds its age threshold |
| Parts Status Separation | Parts-blocked and ready-to-schedule work often look identical | Explicitly separated so planners see genuinely actionable work |
| Reporting to Leadership | Single backlog number with limited context | Priority and age breakdown with trend direction by craft |
| Scalability | Becomes unmanageable above a few hundred open work orders | Scales to plant-wide and fleet-wide backlogs consistently |
Stop Letting Backlog Age Silently Into an Outage
iFactory scores every open work order by priority and age in real time, so the jobs most likely to cause downtime never disappear into a spreadsheet nobody has opened since last month.
A Five-Step Path to Bringing Backlog Under Control
Reducing an out-of-control backlog is not about clearing the list in one push, and plants that try usually see the number creep right back up within a few weeks. It is about installing a structured process that keeps priority and age visible every week, so the list stays under control on an ongoing basis rather than requiring another cleanup sprint every six months.
What Structured Backlog Management Delivers
Plants that move from spreadsheet tracking to continuous priority-and-age scoring report measurable gains within the first two review cycles.
These ranges hold up across plant sizes because they are tied to the same underlying mechanism: work that is both correctly prioritized and continuously aged simply cannot hide the way it can on a static spreadsheet. Once a P1 or P2 item crosses its escalation threshold, it surfaces automatically instead of waiting for someone to notice it during a monthly review. Schedule compliance improves as a direct result, because planners are building weekly schedules from a list that accurately reflects what is truly ready to execute rather than a list padded with parts-blocked or duplicate entries. The 7 percent annual risk compounding figure reflects how deferred maintenance costs grow when high-consequence work orders are left open rather than resolved within their intended window, which is the core argument for treating age as a first-class metric alongside priority.
How Automated Priority and Age Scoring Actually Runs
iFactory connects directly to the systems your team already uses, so backlog scoring runs in the background rather than requiring a separate manual process. The model pulls from four data sources and recalculates continuously as conditions change.
Frequently Asked Questions
What is considered a healthy maintenance backlog for a power plant?
Reliability benchmarks generally place a healthy ready-to-schedule backlog at one to two weeks per craft, with total backlog stabilizing around three to six weeks depending on plant size and staffing model. Below two weeks usually means planners do not have enough scope to build efficient schedules and may be overstaffed for the current workload. Above six weeks typically means the maintenance team is structurally under-resourced for the scope of the program, and deferred work is beginning to accumulate risk. The right number matters less than the trend, since a backlog that is climbing consistently is the earliest visible warning sign that performance is slipping, often before it shows up anywhere else. Book a demo to see your current backlog measured against these ranges.
How is maintenance backlog actually calculated?
Backlog is expressed in work weeks, calculated by dividing the total hours of pending maintenance tasks by the available weekly labor capacity of the maintenance department. For example, three hundred hours of pending work against a team with one hundred fifty available hours per week produces a two-week backlog. The calculation should be run separately for each craft, since a plant can show a healthy blended average while one craft, such as instrumentation or electrical, is dangerously overloaded and another is underutilized. Standardizing the estimate quality behind each work order matters as much as the formula itself, since inflated or missing time estimates will distort the resulting number regardless of how precisely it is calculated. Contact support to review your current backlog calculation methodology.
Why does work order age matter more than the total backlog count?
A total backlog count treats a work order created yesterday the same as one that has been open for nine weeks, even though the older item carries substantially more accumulated risk, particularly if it involves safety or reliability-critical equipment. Age analysis breaks the backlog into buckets, typically zero to two weeks, two to four weeks, four to eight weeks, and eight-plus weeks, then cross-references those buckets against priority classification. This combination is what actually predicts downtime, because a high-priority item aging past eight weeks is the profile most associated with unplanned failures, while the same age bucket filled with low-priority housekeeping items carries almost no operational risk. Book a demo to see age-and-priority cross-referencing on your own data.
Who should own backlog management day to day?
Day-to-day ownership typically sits with the maintenance planner, who audits the backlog for duplicate or stale entries, keeps time estimates and priority tags current, and builds the weekly schedule from the cleaned list. The reliability or maintenance manager owns backlog as a standing KPI and reports its trend to plant leadership, usually alongside schedule compliance and wrench time. In mature organizations, backlog review is a weekly standing meeting between planners, reliability engineers, and production supervisors, since clearing execution blockers and re-validating priority requires input from all three roles rather than a single owner working in isolation. Contact support to set up structured backlog ownership across your team.
How does missing spare parts availability distort backlog metrics?
Work orders waiting on spare parts inflate the total backlog number without reflecting a scheduling or prioritization failure, while genuinely ready-to-schedule work that has simply been deprioritized looks identical to parts-blocked work in most standard CMMS reports. This blending makes it difficult to tell whether a growing backlog is a labor capacity problem, a procurement and lead time problem, or a prioritization problem, and each of those root causes requires a completely different fix. Separating parts-blocked work into its own visible category, and tracking it against actual lead time data rather than nominal lead time, gives planners an accurate ready-to-schedule number to build the weekly plan from. Book a demo to see parts-blocked work separated automatically from your ready backlog.
Turn Your Backlog Into a Management Tool, Not a Monthly Report
iFactory keeps every work order scored by priority and age, every day, so your team is always working the list that actually protects uptime.