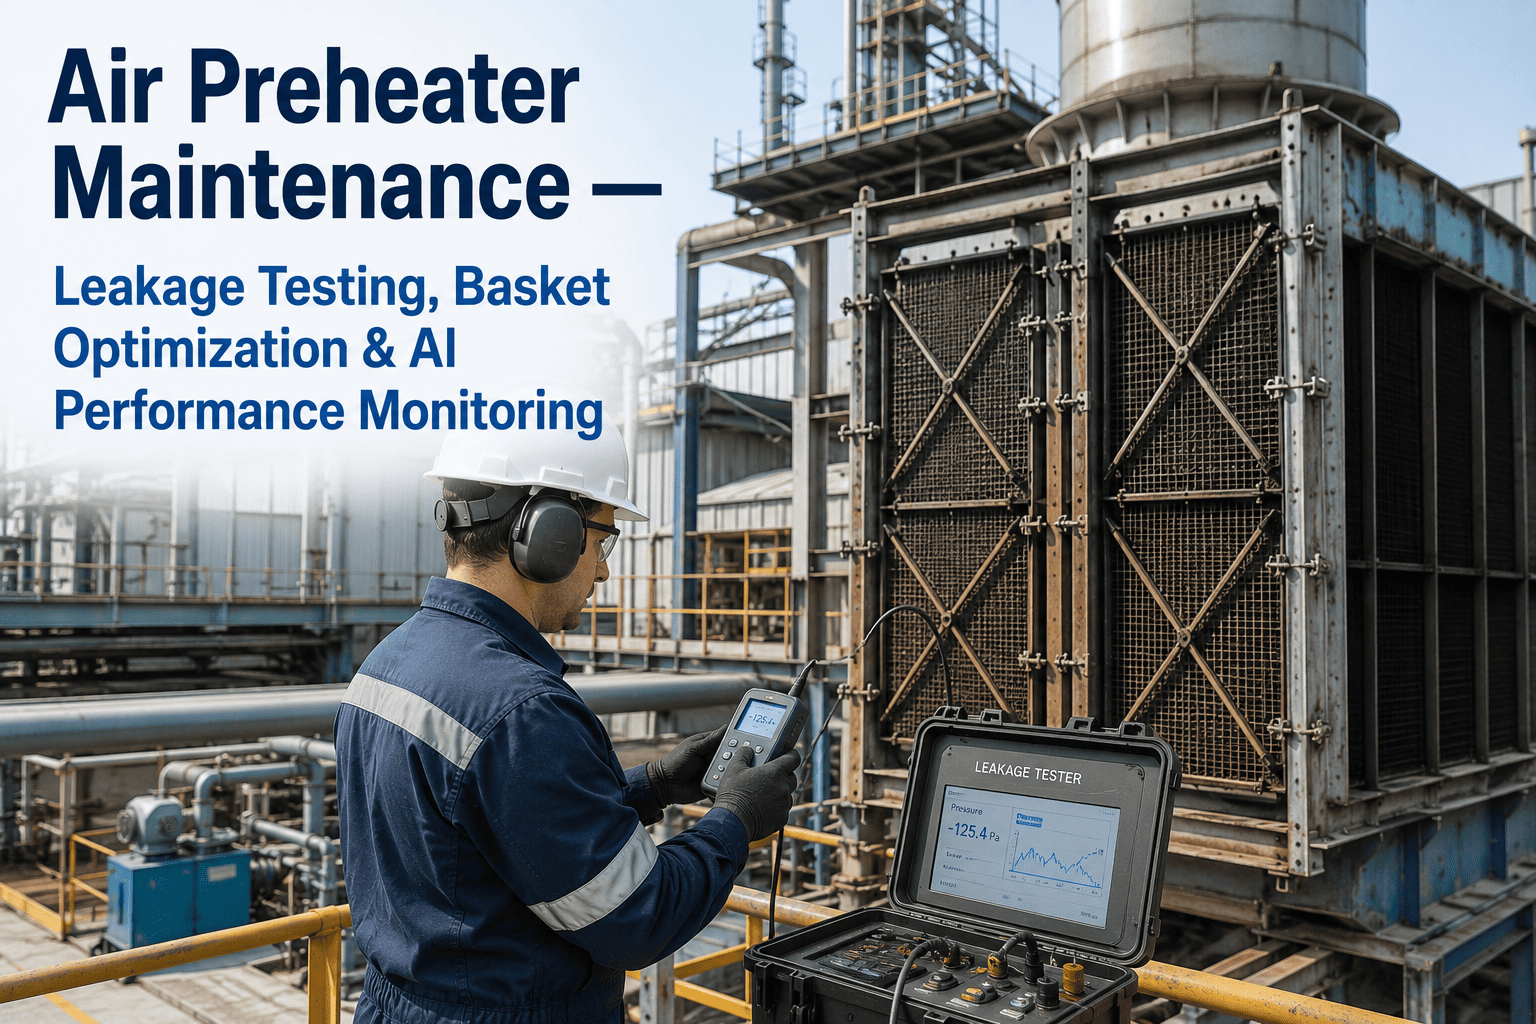
Air preheater leakage in a coal-fired power plant is a silent efficiency drain that most process engineers can only measure during an outage. A Ljungstrom-type air preheater operating at 12% leakage instead of the design 6% wastes approximately $1.2 to $2.4 million per year in excess fuel costs on a 500MW unit. The data to detect rising leakage exists in your DCS every second, but without AI analytics connecting these signals to specific degradation pathways, you discover the problem when your next outage leakage test reveals a number that forces an emergency basket order. Book a 30-minute walkthrough to see how iFactory detects APH degradation in real time.
Stop discovering air preheater leakage 18 months after it starts
iFactory's AI-powered APH monitoring detects leakage increases, basket degradation, and heat transfer loss in real time—using data you already have—so you can plan basket replacements and seal adjustments before your next outage.
Every air preheater has four failure modes running simultaneously
Ljungstrom and Rothemuhle air preheaters operate in a harsh environment where gas-side corrosion, particulate erosion, chemical plugging, and mechanical seal wear all progress at different rates. Understanding which zone is driving your leakage increase is the difference between a targeted seal adjustment and an unnecessary full basket replacement.
Acid Dew Point Corrosion
When flue gas temperature drops below the sulfuric acid dew point—typically 120 to 150°C depending on fuel sulfur content—H2SO4 condenses on basket elements. This acid aggressively corrodes both carbon steel and enameled elements, thinning the heating surface and creating holes that directly increase gas-to-air leakage. Cold end corrosion is the single largest driver of basket replacement in coal-fired units.
Ammonium Bisulfate Plugging
In units equipped with SCR systems for NOx control, unreacted ammonia combines with SO3 to form ammonium bisulfate. ABS is a sticky, hygroscopic deposit that adheres to basket surfaces in the 200 to 320°C temperature range. It progressively plugs basket passages, increasing gas-side differential pressure, reducing heat transfer area, and creating localized flow acceleration that erodes adjacent elements. Sootblowing has limited effectiveness against established ABS deposits.
Fly Ash Erosion
High-velocity fly ash particles impact the hot end basket elements at gas inlet temperatures of 340 to 380°C. Over thousands of operating hours, this erosive wear thins the basket profile sheets and corrugations, reducing heat transfer surface area and structural rigidity. Eroded elements are more susceptible to mechanical damage from sootblower steam impingement and can break loose, causing downstream damage to economizer tubes or creating rotating debris that damages seals.
Radial, Axial, and Circumferential Seal Wear
The sealing surfaces between the rotating rotor and stationary housing wear through continuous contact during thermal expansion and contraction cycles. Differential expansion between the rotor and casing causes the rotor to warp or "saddle" over time, increasing clearances non-uniformly around the circumference. Radial seals wear at different rates at the 12 o'clock position versus the 6 o'clock position, creating leakage pathways that cannot be corrected by uniform seal adjustments.
Every percentage point of excess leakage has a dollar value
On a 500MW coal-fired unit operating at 85% capacity factor, the relationship between air preheater leakage and boiler efficiency loss is well-established. Each percentage point of leakage above design costs approximately $400,000 to $500,000 per year in additional fuel. Here is what that escalation looks like as degradation progresses between outages.
Outage testing shows you a snapshot. The damage happens in between.
Process engineers rely on outage leakage testing—typically conducted every 8 to 18 months—to assess air preheater health. This approach has a fundamental limitation: it measures the cumulative result of months of degradation but provides zero visibility into how or when that degradation occurred. The result is reactive maintenance driven by lagging indicators.
Your APH leakage is increasing right now. You just cannot see it.
iFactory's AI monitoring fills the blind spot between outages with continuous leakage detection, basket health tracking, and efficiency impact quantification. Book a 30-minute demo and see the analysis on your boiler data.
Four data signals that reveal air preheater degradation between outages
iFactory analyzes data streams your DCS already produces—air and gas temperatures, differential pressures, oxygen levels, and mill outlet temperatures—to build a continuous picture of air preheater health. No new sensors, no modifications to the APH, deployed on an NVIDIA appliance inside your plant network.
Leakage Rate Estimation from Temperature Signals
iFactory calculates real-time APH leakage rate using air inlet and outlet temperatures, gas inlet and outlet temperatures, and air and gas flow measurements. The algorithm applies heat balance equations across the air preheater to estimate the fraction of gas that bypasses the heat transfer surface through leakage paths. This leakage estimate is updated every minute and trended over time to detect rate-of-change anomalies that indicate seal or basket degradation.
Differential Pressure Trending for Basket Health
Gas-side and air-side differential pressure across the APH are monitored and trended against baseline profiles established during clean-basket operation. Increasing gas-side DP indicates basket plugging from fly ash, ABS deposits, or corrosion products. The rate of DP increase reveals whether fouling is gradual—suggesting normal ash accumulation—or accelerating—indicating active ABS formation or cold-end corrosion debris. Sootblower activation events are correlated to DP response to measure cleaning effectiveness in real time.
Heat Transfer Effectiveness Tracking
iFactory calculates the actual heat transfer effectiveness of the air preheater by comparing measured air temperature rise against the theoretical maximum based on gas temperature drop and flow rates. Declining effectiveness—after correcting for load and ambient conditions—indicates basket surface degradation from erosion, corrosion, or fouling that reduces the active heat transfer area. This metric detects degradation that does not immediately show up in leakage or DP measurements.
Leakage-to-Efficiency Impact Quantification
Every leakage rate estimate is automatically correlated to boiler efficiency impact using unit-specific performance curves. Process engineers see not just that leakage is increasing, but exactly how much that increase is costing in terms of heat rate degradation, excess fuel consumption, and CO2 emissions per operating day. This quantified impact turns a technical parameter into a financial decision signal for maintenance prioritization and outage planning.
What iFactory delivers for your air preheater monitoring
These capabilities run on your plant network with zero cloud dependency. They connect to your existing DCS or historian and begin producing actionable insights within the first two weeks of data collection.
Continuous leakage rate calculation and trending
Real-time APH leakage percentage calculated from heat balance, updated every minute, with configurable alert thresholds for rate-of-change and absolute level. Trend visualization shows leakage trajectory since last outage with projected leakage at next scheduled outage date.
Basket condition scoring by zone
Separate health scores for cold end, intermediate, and hot end basket sections based on differential pressure trends, heat transfer effectiveness, and operating temperature profiles. Identifies which zone is driving degradation and whether the cause is corrosion, plugging, or erosion.
ABS plugging detection for SCR-equipped units
Pattern recognition on gas-side DP trends that distinguishes normal ash accumulation from ABS-related plugging. Detects the characteristic acceleration in DP rise rate that signals active ABS formation and recommends sootblowing strategy adjustments or water wash scheduling.
Sootblowing effectiveness monitoring
Measures the actual DP reduction achieved by each sootblower pass and tracks the declining effectiveness over time. When sootblowing returns diminish below a configurable threshold, iFactory alerts that mechanical cleaning or water wash is needed, preventing wasted steam and unnecessary sootblower wear.
Seal degradation pattern analysis
iFactory analyzes leakage rate changes during load ramps and temperature transients to infer seal behavior. Non-uniform leakage patterns—where leakage increases more at certain loads or temperatures—indicate rotor warping or localized seal wear that requires targeted adjustment rather than uniform seal repositioning.
Outage planning support with degradation forecasting
Projects basket condition and leakage rate to the next scheduled outage date based on current degradation trends. Provides maintenance recommendations—basket section replacement, seal adjustment, water wash—with estimated impact on post-outage leakage rate so you can evaluate the cost-benefit of different maintenance scopes.
From data connection to live APH monitoring
iFactory connects to your existing DCS or historian and delivers a working air preheater monitoring system without custom development, cloud migration, or new sensor installation.
Connect to your historian or OPC UA source for APH temperatures, differential pressures, air and gas flows, oxygen levels, and sootblower status. Import historical outage leakage test results for baseline calibration.
AI models learn the normal operating signatures for your APH including leakage baseline, DP profiles, heat transfer effectiveness, and sootblower response characteristics at different load points.
Live monitoring begins with iFactory operations team support. Leakage estimates are validated against next outage test results. Models are refined and full handover to your engineering team with documentation.
Air preheater monitoring with AI, explained
See your air preheater leakage trajectory before your next outage
Process engineers at coal-fired plants use iFactory to detect APH degradation continuously instead of discovering it during outage testing. Book a 30-minute walkthrough and see the monitoring analysis on your boiler data.