In the ecosystem of industrial thermal management, the cooling tower stands as a silent sentinel, often overlooked until a catastrophic failure disrupts production. For maintenance managers and plant engineers, the cooling tower is not merely a heat rejection asset; it is the critical interface between process efficiency and environmental compliance. The balance of plant (BoP) philosophy demands that every subsystem, from the condenser to the cooling tower, operates within its optimal thermodynamic envelope. Yet, traditional maintenance strategies—reactive repairs or calendar-based overhauls—consistently fail to address the complex, interrelated degradation mechanisms that plague these structures. Approach temperature, the difference between the cold water leaving the tower and the ambient wet-bulb temperature, is a key indicator that often drifts imperceptibly over weeks, masking the onset of fill fouling, scale accumulation, or biological growth. Similarly, cooling range, the temperature drop across the tower, can erode due to reduced airflow or maldistribution of water, leading to higher condenser pressures and increased energy consumption. Without continuous, AI-driven monitoring, these subtle shifts remain undetected until they manifest as capacity loss, unplanned downtime, or costly emergency repairs. At iFactory, we have developed a sophisticated predictive analytics framework that transforms raw sensor data into actionable intelligence, enabling proactive interventions that extend asset life, reduce water and chemical usage, and ensure thermal performance remains within design specifications. Book a Demo to see how our platform can revolutionize your cooling tower maintenance strategy.
AI-Driven Cooling Tower Optimization for Industry 4.0
Eliminate unplanned downtime and thermal efficiency losses with continuous, predictive monitoring of fill condition, biological fouling, and mechanical degradation.
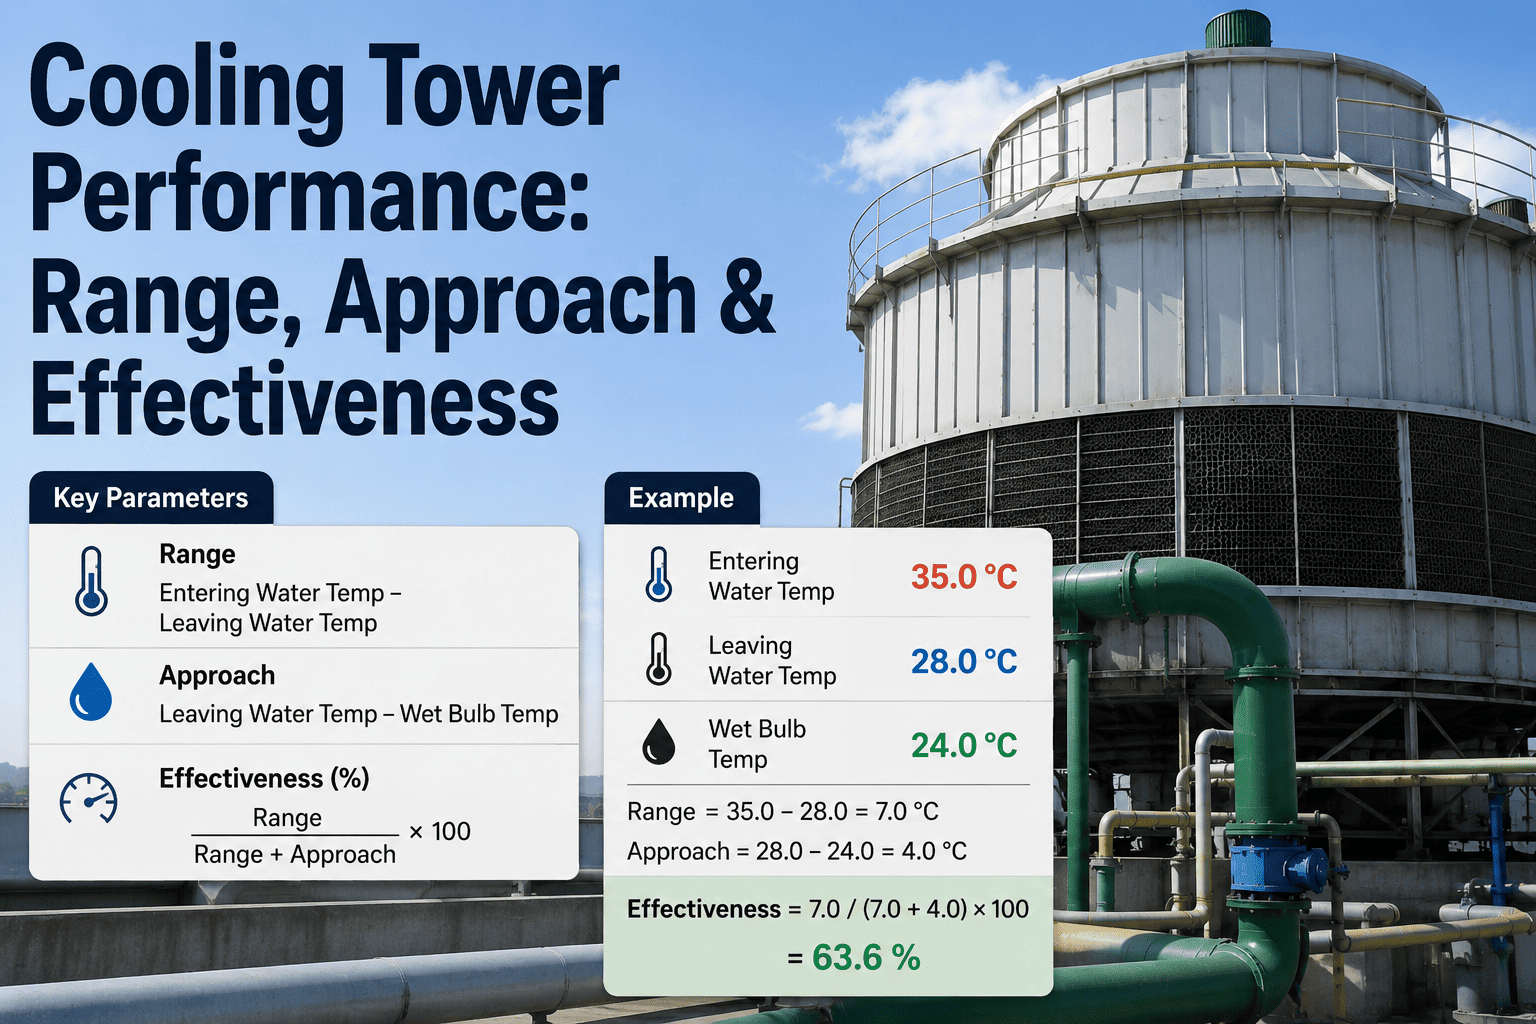
The Thermodynamic Imperative: Understanding Approach Temperature and Range
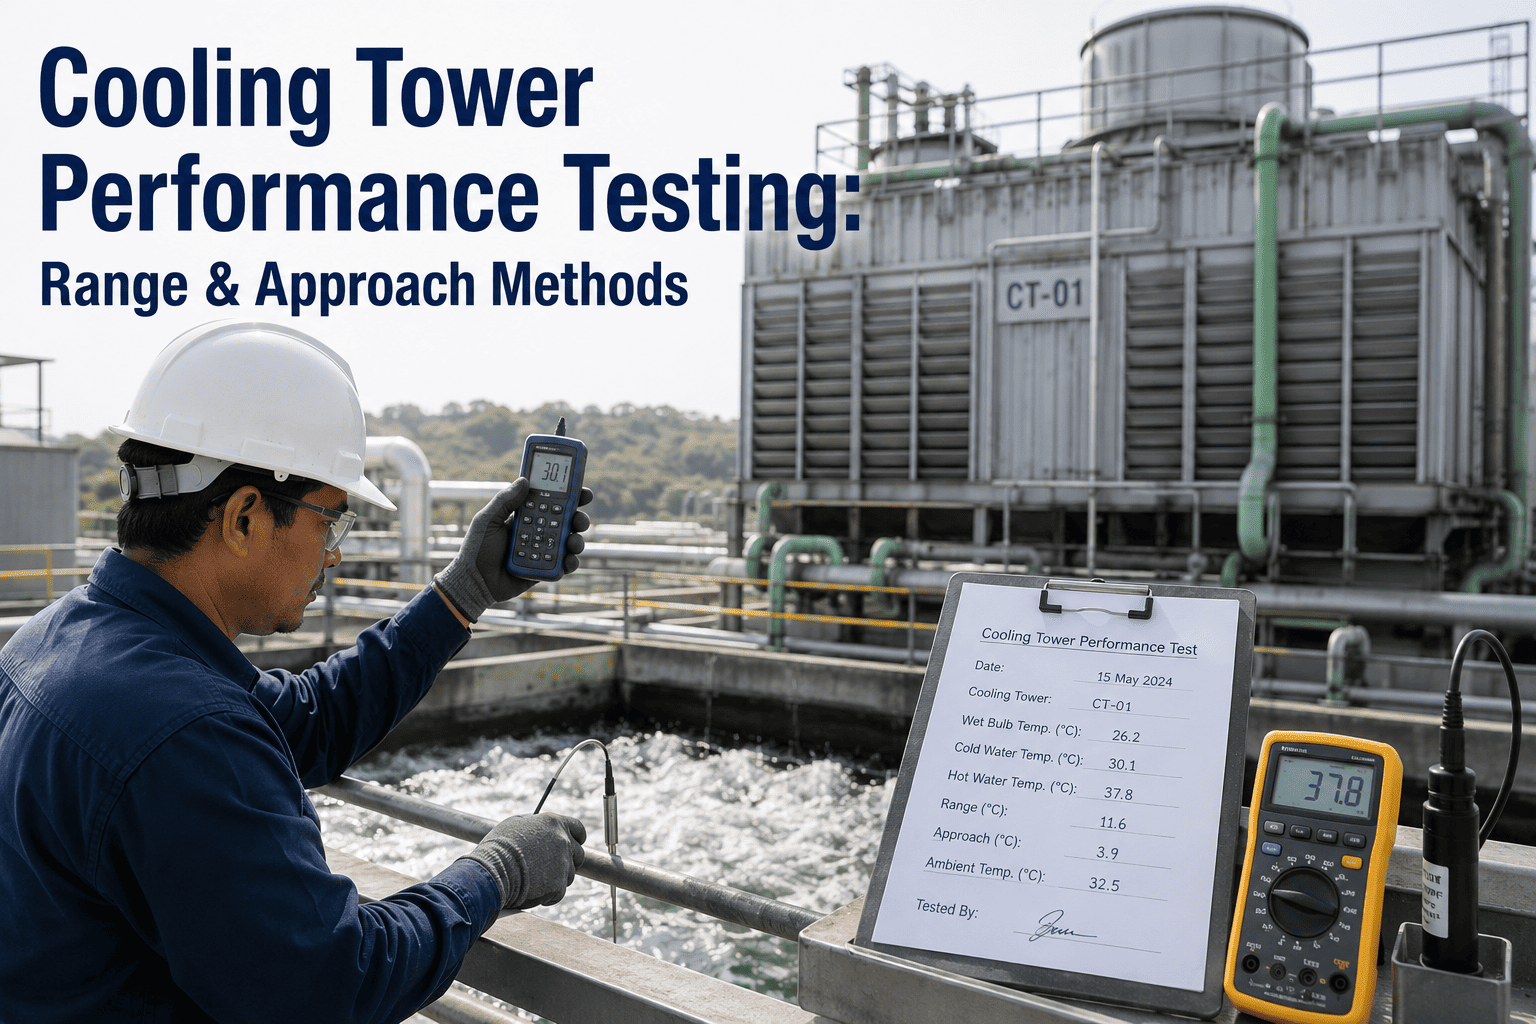
Approach temperature, defined as the difference between the cold water outlet temperature and the ambient wet-bulb temperature, is the single most critical metric for cooling tower performance. A low approach indicates efficient heat transfer, while a rising approach signals degradation in fill material, airflow obstruction, or water distribution issues. Similarly, cooling range—the difference between hot water inlet and cold water outlet—directly impacts condenser backpressure and, consequently, turbine efficiency in power generation cycles. In a typical industrial facility, a 1°C increase in approach temperature can lead to a 2-3% increase in energy consumption for the entire chiller plant. Traditional monitoring relies on periodic manual readings or simple trend analysis, which fails to capture the rapid onset of fouling events. AI models, trained on historical sensor data and environmental variables, can detect deviations in approach and range with high granularity, flagging anomalies days or even weeks before they impact production. For instance, a gradual rise in approach coupled with stable wet-bulb temperature often indicates fill fouling, while a sudden increase may point to a broken fan or blocked air intake. By integrating these insights into a digital twin of the cooling tower, maintenance teams can simulate interventions and prioritize actions based on cost-benefit analysis, ensuring that every maintenance dollar delivers maximum return.
Key Degradation Mechanisms Detected by AI
Fill Condition Deterioration
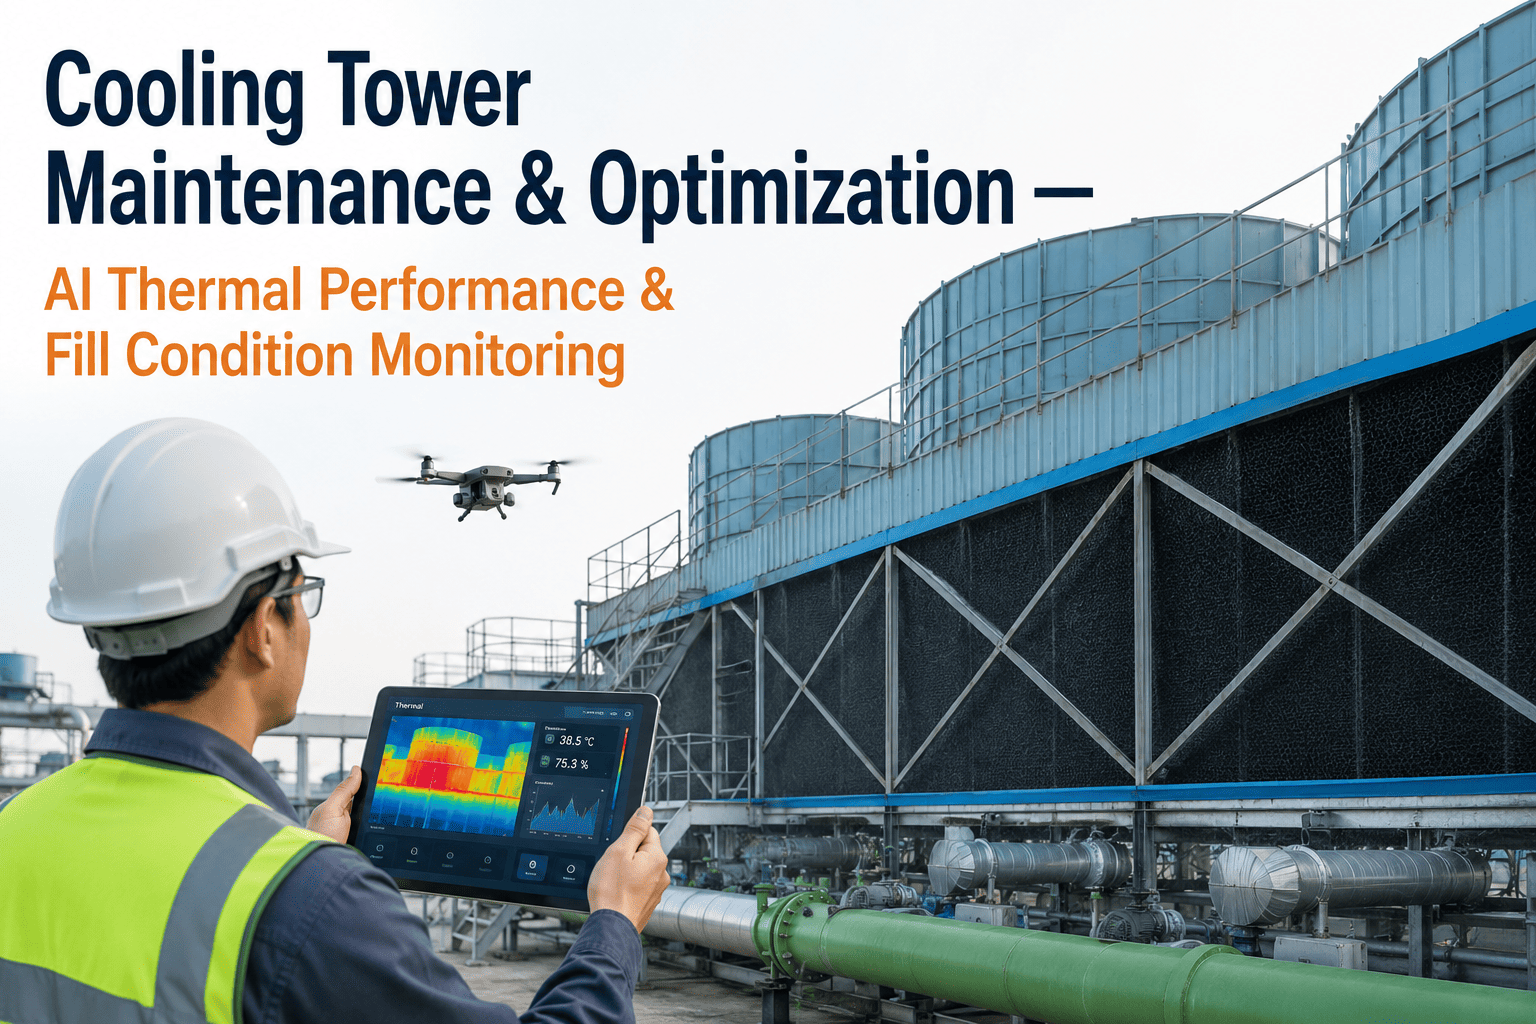
Fill media, typically made of PVC or polypropylene, provides the surface area for heat and mass transfer. Over time, scale deposits, biological slime, and debris clog the fill passages, reducing effective surface area and increasing pressure drop. AI models analyze differential pressure across the fill, outlet water temperature trends, and fan power consumption to estimate fouling thickness and predict the optimal cleaning schedule. Without intervention, fill fouling can reduce thermal performance by 20-30% within six months.
Biological Fouling and Legionella Risk
Warm, nutrient-rich water in cooling towers creates an ideal environment for microbial growth, including Legionella pneumophila. Biofilms not only impede heat transfer but also accelerate corrosion under deposits. AI-driven monitoring tracks oxidation-reduction potential (ORP), conductivity, and temperature gradients to detect early signs of biological activity. Predictive models can recommend biocide dosing adjustments in real time, reducing chemical usage by up to 40% while maintaining water quality within regulatory limits.
Scale and Mineral Buildup
Hard water minerals, primarily calcium carbonate and calcium sulfate, precipitate on fill surfaces and in the basin, reducing thermal efficiency and clogging distribution nozzles. AI algorithms analyze cycles of concentration, pH, and alkalinity trends to forecast scaling potential. When the Langelier Saturation Index (LSI) exceeds a threshold, the system automatically adjusts blowdown rates or triggers acid injection, preventing scale formation without manual intervention.
Mechanical Component Degradation
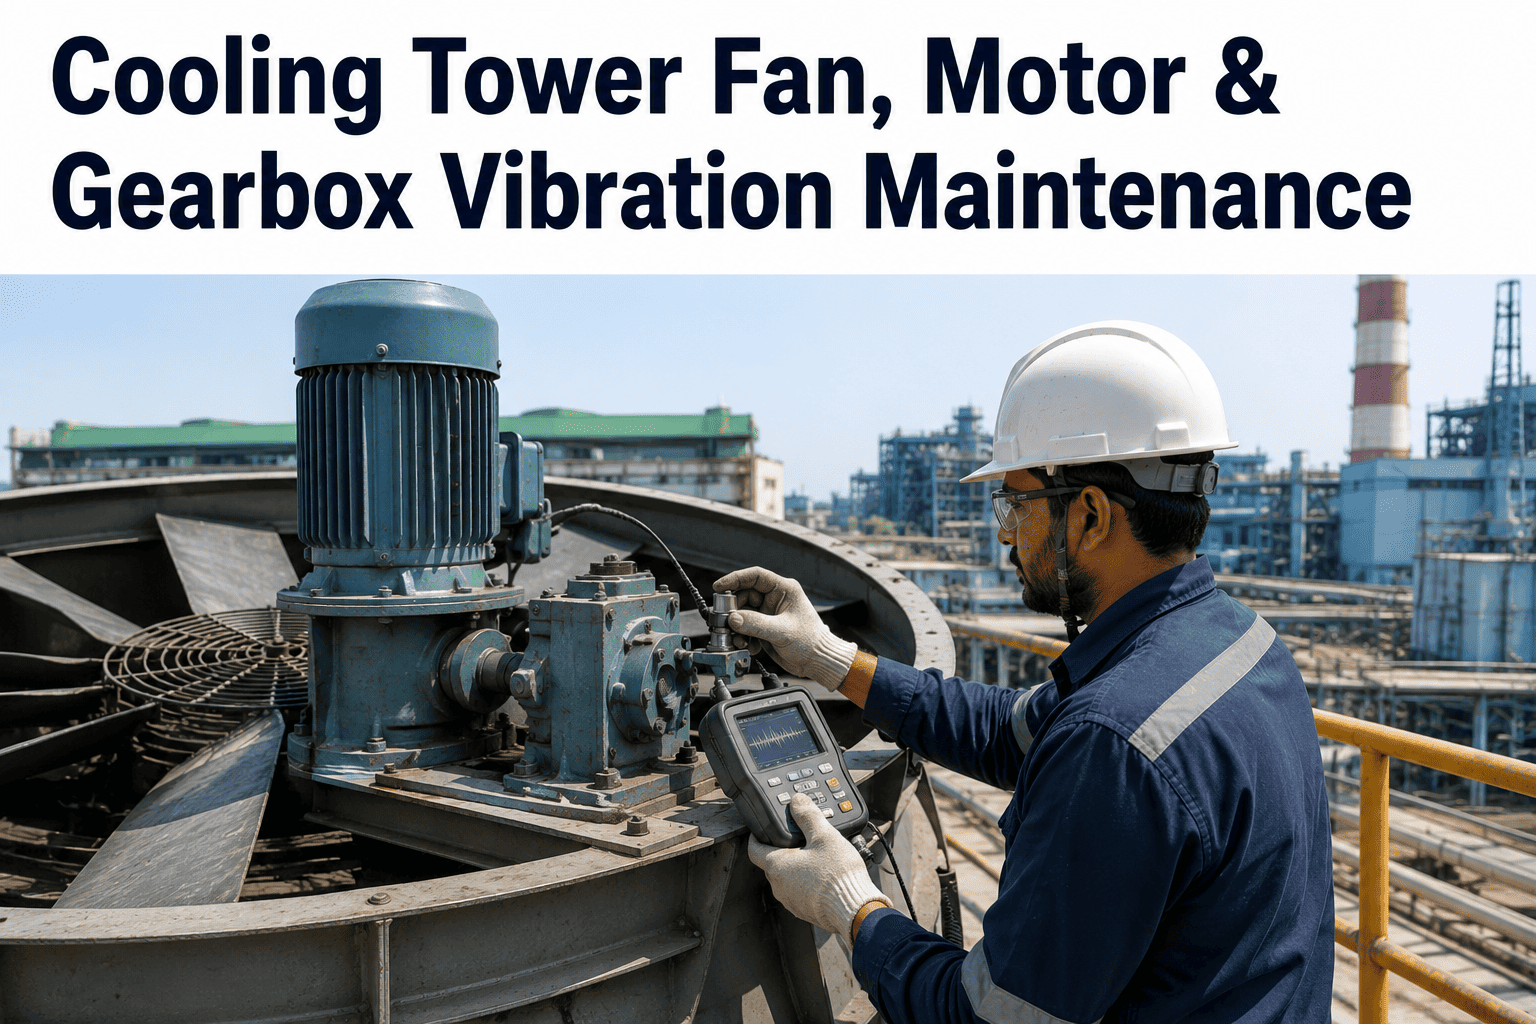
Fans, gearboxes, motors, and drives are subject to wear, misalignment, and lubrication degradation. Vibration analysis, combined with motor current signature analysis, allows AI models to detect bearing faults, gear tooth wear, and imbalance. By correlating vibration patterns with thermal performance data, the system can differentiate between a fan blade imbalance and a motor bearing failure, enabling targeted maintenance actions that reduce repair time by 50%.
From Data to Decision: The AI Workflow
Data Acquisition
Sensors measure temperature, flow, pressure, vibration, and water chemistry at multiple points. Data is streamed to the cloud at 1-minute intervals, ensuring high-resolution coverage.
Feature Engineering
Raw data is transformed into meaningful features: approach temperature, range, effectiveness, cycles of concentration, and fouling factor. Environmental variables like wet-bulb temperature and wind speed are integrated.
Model Training
Autoencoders and gradient boosting machines are trained on historical data to learn normal operating patterns. The models detect anomalies and predict remaining useful life of components.
Alerting & Visualization
Alerts are delivered via mobile app, email, or dashboard. The platform provides root cause analysis and recommended actions, such as “Clean fill section 2” or “Inspect fan bearing.”
Ready to Transform Your Cooling Tower Maintenance?
Move from reactive repairs to predictive, data-driven optimization. Reduce downtime, extend asset life, and lower operational costs.
Comparative Analysis: Traditional vs. AI-Driven Cooling Tower Maintenance
| Parameter | Traditional Approach | AI-Driven Approach |
|---|---|---|
| Monitoring Frequency | Weekly manual readings | Continuous 1-minute interval |
| Fouling Detection | Visual inspection only | Predictive via differential pressure & temperature |
| Chemical Dosing | Fixed schedule | Real-time, demand-based |
| Fan Bearing Failure | Detected after noise/vibration | Predicted 30+ days in advance |
| Water Consumption | High blowdown rates | Optimized cycles of concentration |
| Energy Efficiency | Degraded over time | Sustained near design value |
Advanced Analytics for Drift Loss and Water Conservation
Drift Loss Quantification
Drift, the loss of water droplets entrained in exhaust air, not only wastes water but also carries treatment chemicals and potential pathogens. AI models estimate drift rate using fan speed, airflow, and droplet size distribution data. By identifying excessive drift, operators can adjust eliminator maintenance or replace worn components, reducing water loss by up to 20%.
Blowdown Optimization
Blowdown is necessary to control dissolved solids, but excessive blowdown wastes water and chemicals. AI dynamically sets blowdown intervals based on conductivity, pH, and scaling potential, maintaining water quality while minimizing waste. In one case study, a petrochemical plant reduced blowdown by 35%, saving 12 million gallons annually.
Evaporative Cooling Efficiency
Evaporative cooling is influenced by ambient humidity and temperature. AI models predict how changes in weather affect tower performance, allowing preemptive adjustments to fan speed and water flow. This maintains stable condenser conditions even during heat waves, preventing production slowdowns.
Predictive Maintenance of Mechanical Components: A Deep Dive
The mechanical integrity of fans, gearboxes, and motors is paramount for consistent thermal performance. Vibration analysis, when combined with motor current signature analysis (MCSA), provides a comprehensive view of rotating equipment health. AI models trained on historical failure data can detect early signs of bearing wear, gear tooth cracking, and shaft misalignment. For example, an increase in vibration amplitude at the gear mesh frequency often indicates gear wear, while a rise in sideband frequencies suggests looseness or eccentricity. The system correlates these findings with thermal performance data—such as a simultaneous drop in cooling range—to confirm the impact on process. This integrated approach enables maintenance teams to plan repairs during scheduled outages, avoiding costly emergency shutdowns. Furthermore, the platform can optimize lubrication intervals based on actual usage and condition, rather than fixed schedules, extending gearbox life by 25-30%.
Frequently Asked Questions
How does AI detect fill fouling before it affects performance?
AI models analyze multiple parameters simultaneously: differential pressure across the fill, outlet water temperature trends, fan power consumption, and water distribution uniformity. By training on historical data from both clean and fouled conditions, the model learns to identify subtle patterns that precede measurable performance loss. For instance, a gradual increase in differential pressure accompanied by a slight rise in approach temperature indicates early fouling. The system then estimates the remaining useful life of the fill and recommends cleaning. This proactive approach can extend fill life by 40% and maintain thermal efficiency above 95%. For a detailed technical whitepaper, visit our support page.
What sensors are required for AI-driven cooling tower monitoring?
A comprehensive monitoring setup includes temperature sensors at inlet and outlet, wet-bulb temperature sensor, flow meters for water and air, pressure transmitters across fill and drift eliminators, vibration sensors on fans and gearboxes, and water quality sensors (conductivity, pH, ORP). For most industrial towers, the cost of sensor installation is recovered within 6-12 months through water savings, reduced chemical usage, and avoided downtime. The iFactory platform supports integration with existing PLCs and SCADA systems, minimizing additional hardware. For a sensor list tailored to your tower configuration, book a demo with our engineering team.
Can AI predict biological fouling and Legionella risk accurately?
Yes, AI models are highly effective at predicting biological fouling by correlating environmental conditions (temperature, pH, nutrient levels) with historical outbreaks. The system monitors ORP as a real-time indicator of biocide effectiveness and uses machine learning to forecast when ORP will drop below the threshold, triggering a biocide dose. Additionally, the model can predict Legionella growth risk based on temperature and stagnation patterns. In a case study at a food processing plant, the AI system reduced Legionella positive samples by 70% and cut biocide costs by 35%. For more details on our water quality modeling, refer to our technical documentation.
How does the platform handle false alarms and alert fatigue?
Our AI models are trained with a focus on reducing false positives through ensemble methods and context-aware thresholds. The system uses a tiered alerting system: informational alerts for minor deviations, warning alerts for trends that require attention, and critical alerts for imminent failure. Each alert includes a confidence score and root cause analysis, allowing operators to prioritize. Over time, the model learns from operator feedback and adjusts thresholds to minimize nuisance alarms. This approach has reduced alert fatigue by 60% in field deployments. To see how we customize alerting for your plant, schedule a demo.
What is the typical ROI for implementing AI-driven cooling tower optimization?
ROI varies based on tower size, water quality, and current maintenance practices, but typical payback periods range from 8 to 18 months. Savings come from multiple sources: reduced water consumption (10-30%), lower chemical costs (20-40%), decreased energy usage (5-15% due to improved thermal performance), and avoidance of unplanned downtime (which can cost $10,000-$100,000 per hour in lost production). Additionally, extended asset life reduces capital expenditure for replacement. We provide a detailed ROI calculator during the demo phase. For a preliminary estimate, visit our support page and submit your plant data.
Take Control of Your Cooling Tower Performance
Leverage AI to predict failures, optimize water and chemical usage, and maintain peak thermal efficiency. Your path to zero unplanned downtime starts here.