Cooling towers are the silent backbone of industrial thermal management, yet they remain one of the most analytically underserved assets across U.S. manufacturing. Facilities that schedule a discovery session with iFactory are discovering that continuous thermal and chemical visibility eliminates operational guesswork and prevents the cascading failures that lead to costly unplanned outages and regulatory penalties.
Unify Thermal Performance and Water Chemistry Monitoring
iFactory's AI-driven analytics platform provides real-time visibility into fill condition, fan health, drift eliminator performance, and chemical treatment — purpose-built for industrial cooling water systems.
The Hidden Cost of Reactive Cooling Tower Management
The core challenge in cooling tower management is the fragmentation of asset oversight. Mechanical health (fan vibration, bearing temperature, belt condition) is typically tracked by the reliability team, while water chemistry (pH, conductivity, biocide residual, cycles of concentration) falls under the utilities or environmental group. For plant leadership teams seeking to break out of this reactive cycle, booking a platform demo is typically the first step toward connecting mechanical and chemical intelligence into a single operational view.
Fill Media Degradation
Core Issue: Scale and biological fouling reduce effective heat transfer surface area. A 10% reduction in fill efficiency increases approach temperature by 2–3°F, directly raising condenser pressure and energy consumption.
Fan & Drive Train Failures
Core Issue: Fans consume 60–70% of tower energy. Bearing wear, belt slippage, and blade imbalance cause vibration that degrades quickly—often reaching critical levels within 30 days of initiation.
Drift Eliminator Bypass
Core Issue: Fouled or damaged drift eliminators allow water droplets to escape the tower, wasting treated water and creating aerosol drift that increases Legionella exposure risk for surrounding areas.
Chemical Imbalance
Core Issue: Manual adjustments to pH, biocide, and corrosion inhibitor dosing create sawtooth patterns of over- and under-treatment. This wastes chemicals, accelerates corrosion, and creates compliance gaps.
Key Cooling Tower Subsystems That Demand Analytics
Modern cooling towers contain four critical subsystems that each require independent monitoring logic and together determine the overall health of the thermal rejection loop. iFactory's analytics platform ingests data from each subsystem and correlates cross-domain events—such as a conductivity spike that indicates a drift eliminator bypass, or a fan amp draw increase that signals fill fouling. Reliability engineers who schedule a technical review consistently find that this cross-domain correlation is what differentiates true intelligence from simple data display.
Fill Media Condition Monitoring
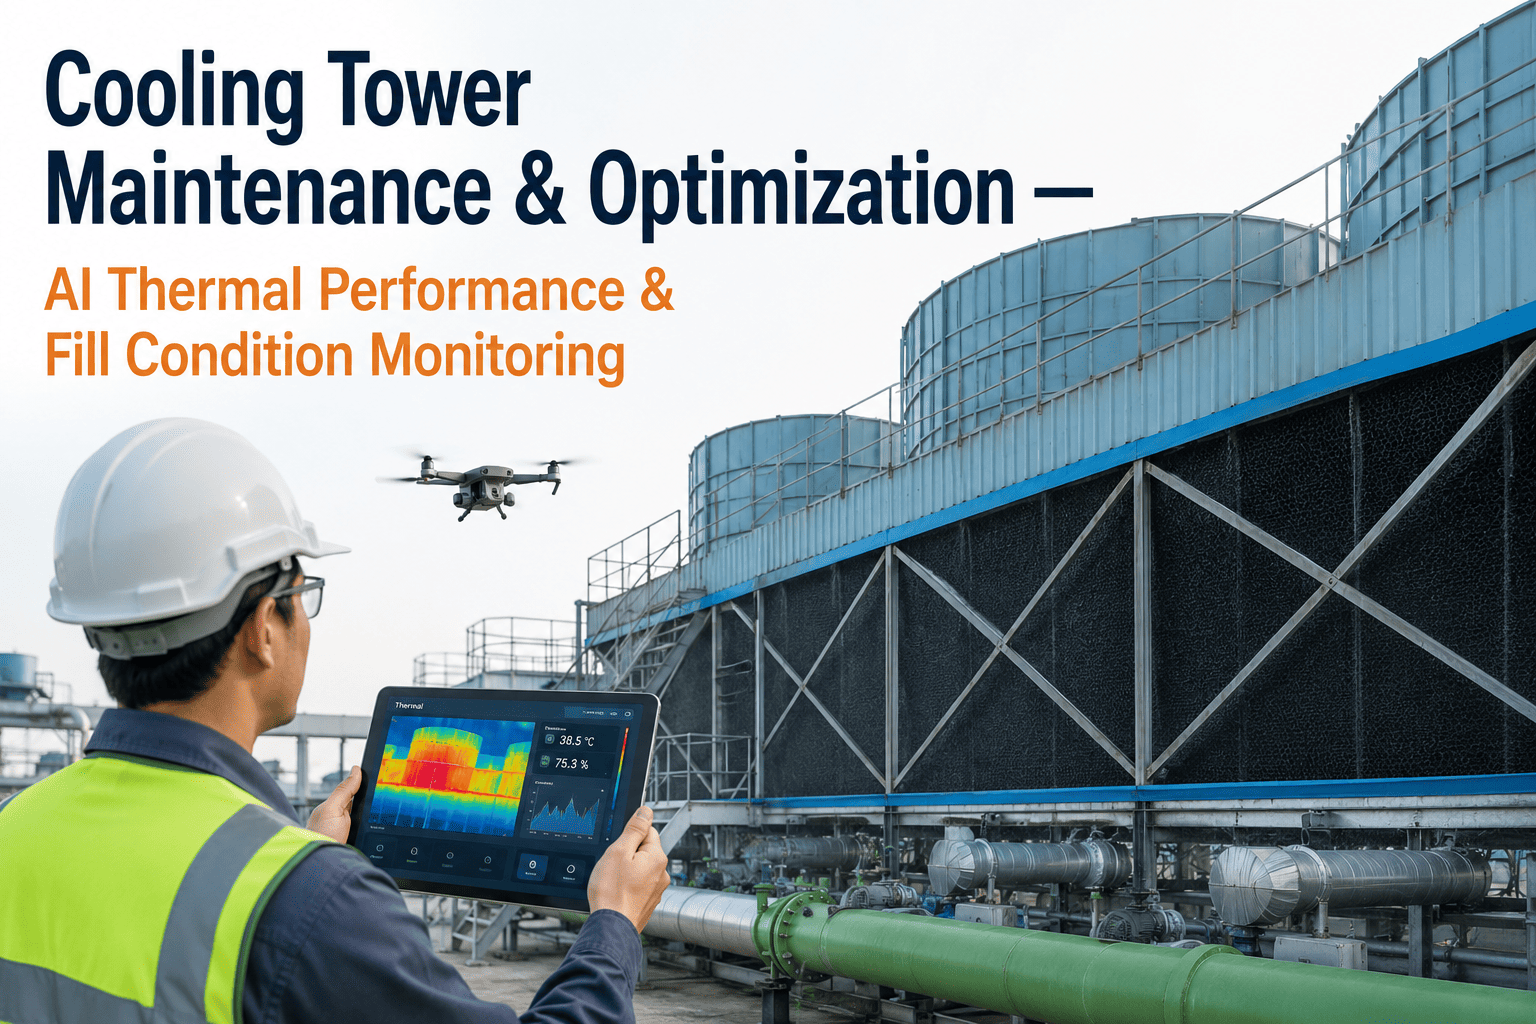
Cooling tower fills—whether splash bar or film type—are the primary heat transfer interface between process water and ambient air. Over time, fill surfaces accumulate calcium carbonate scale, biological slime, silt, and debris that insulate the heat transfer boundary. Traditional inspection requires a unit shutdown for visual entry, which typically happens only once per quarter or even annually.
- Key Metrics: Approach temperature, range, tower characteristic curve drift
- Early Warning: Progressive fan amp increase without ambient temperature change
- Resolution: Targeted chemical cleaning vs. mechanical fill replacement
Fan System Predictive Analytics
Axial and centrifugal cooling tower fans operate in one of the harshest environments in any plant: saturated air, temperature swings, and constant moisture. Bearing failures, belt degradation, blade imbalance, and motor winding degradation are the dominant failure modes. Most plants run a time-based preventive maintenance schedule—replace belts every 12 months, grease bearings quarterly—but this approach catches failures only on the PM date and misses inter-cycle degradation. iFactory's analytics platform ingests vibration data from bearing accelerometers, motor current from VFD drives, and temperature from RTD sensors to build a real-time health score for each fan assembly.
- Key Metrics: Velocity vibration (in/sec), bearing temperature, motor amp draw
- Early Warning: 2x line frequency sidebands indicating belt wear
- Resolution: Condition-based belt replacement, bearing repack scheduling
Drift Eliminator Performance Tracking
Drift eliminators are the final barrier between cooling tower process water and the atmosphere. When these chevron-style baffles become fouled with scale, debris, or biological growth, they lose their droplet-capture efficiency, allowing treated water—and the chemical additives it carries—to escape as aerosol drift. More critically, drift creates the primary vector for Legionella pneumophila transmission to surrounding cooling towers, air intakes, and occupied spaces. k book a compliance audit to understand how continuous drift monitoring strengthens their water management program.
- Key Metrics: Drift loss rate (gpm), conductivity mass balance, eliminator pressure drop
- Early Warning: Rising conductivity gap between circulating and makeup water
- Resolution: Targeted eliminator cleaning or section replacement
Water Chemistry & Automated Treatment Optimization
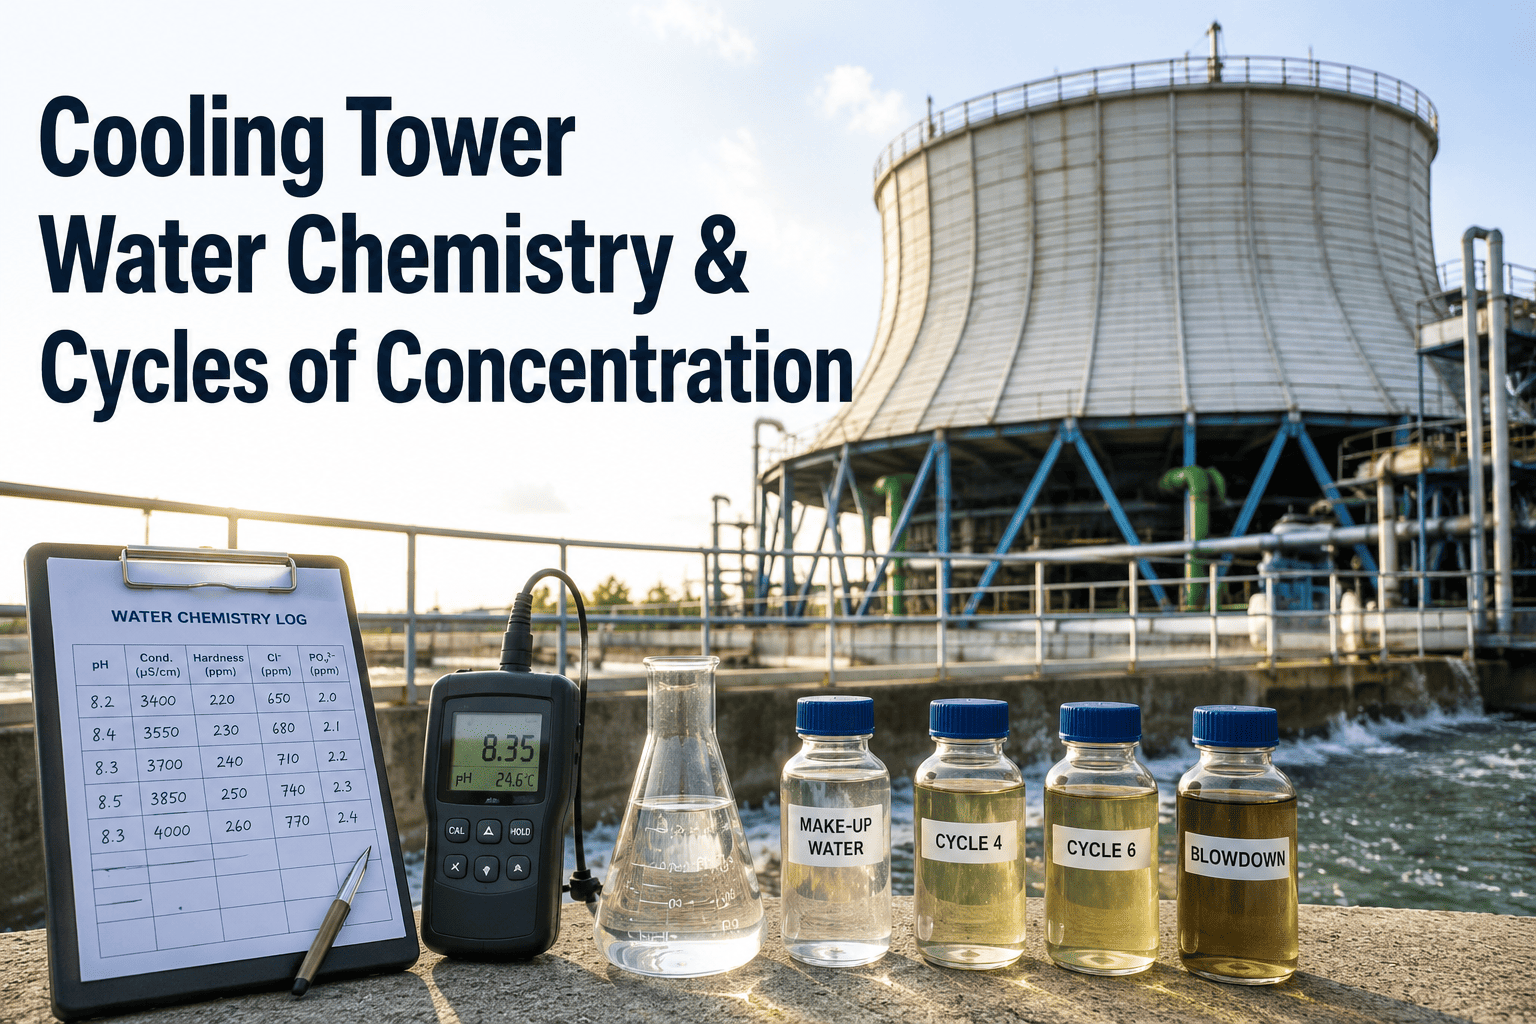
Water chemistry management is the most data-rich and decision-intensive aspect of cooling tower operations. pH, conductivity, total dissolved solids (TDS), hardness, alkalinity, orthophosphate, and biocide residual must all be maintained within tight bands to prevent scaling, corrosion, and biological growth simultaneously. Traditional programs rely on a field technician collecting grab samples once or twice per week, making chemical feed adjustments based on lab results that are 24–48 hours stale. This lag creates oscillation in chemical concentration—.
- Key Metrics: pH, conductivity, Langelier Saturation Index, biocide residual
- Early Warning: Conductivity trend deviating from cycle setpoint
- Resolution: Automated feed pump modulation, blowdown optimization
"We were managing our cooling water systems the same way we had for two decades—weekly grab samples, quarterly fill inspections, and reactive fan repairs whenever a vibration trip shut us down. After deploying iFactory across our eight cooling tower cells, we detected a developing fan bearing failure 47 days before predicted failure and optimized our chemical dosing to reduce treatment spend by 34% in the first six months. The cross-domain correlation between water chemistry and mechanical health changed how we think about utility asset management entirely."
Traditional vs. AI-Driven Water Treatment and Tower Management
The difference between conventional cooling tower management and an AI-driven approach is not incremental—it represents a fundamental shift in how plants perceive and respond to their thermal utility assets. Traditional programs are calendar-based and reactive; AI-driven programs are condition-based and predictive. The table below illustrates the gap across the key operational dimensions that determine cooling tower reliability, water efficiency, and compliance posture.
| Operational Dimension | Traditional Approach | AI-Driven Approach | iFactory Advantage |
|---|---|---|---|
| Water Sampling | Manual grab samples, 1–2 per week | Continuous online sensor array | Real-time anomaly detection at 1-second resolution |
| Fill Condition | Visual inspection every 3–6 months with unit shutdown | Continuous thermal efficiency tracking via AI | Automated degradation alerts with 30-day lead time |
| Fan Maintenance | Time-based PM every 6–12 months | Condition-based vibration and current analysis | 47-day failure foresight for bearing and belt faults |
| Chemical Dosing | Manual field adjustments based on stale lab data | AI-optimized closed-loop MPC control | 34% chemical cost reduction, stable corrosion rates |
| Drift Monitoring | Annual isokinetic stack testing | Continuous mass balance drift coefficient tracking | Real-time drift loss alerts between test cycles |
| Legionella Control | Culture-based testing, 10–14 day lag | Predictive risk modeling with ATP and conductivity | Automated biocide triggers before detectable growth |
| Compliance Reporting | Manual data compilation in spreadsheets | Automated dashboard with audit-ready exports | Zero-lag compliance posture for EPA and OSHA |
Measurable Impact: ROI of Cooling Tower Analytics
Cooling tower analytics deliver measurable financial returns across four distinct levers: energy reduction through optimal fan operation, chemical savings through precision dosing, water conservation through cycles optimization, and risk avoidance through predictive failure detection. iFactory's platform compounds these benefits by correlating data across levers—for example, optimizing cycles of concentration simultaneously reduces both water consumption and chemical demand. Plant financial officers reviewing the business case for cooling tower digitization schedule an ROI briefing to examine the detailed payback model using their specific tower configuration and local utility rates.
Phased Deployment: From Baseline to Autonomous Optimization
Deploying cooling tower analytics requires a structured progression that builds data integrity, validates predictive models, and earns workforce trust. iFactory's implementation team follows a proven three-phase approach calibrated for industrial cooling water systems. If your plant manages multiple tower cells across different process units, booking a strategic planning session can help prioritize deployment sequence for maximum early ROI.
Visibility & Baseline Establishment
Deploy online sensors for pH, conductivity, temperature, flow, and fan vibration. Connect to iFactory's data ingestion layer and establish baseline performance curves for each tower cell. Train operators on the mobile dashboard for real-time awareness. Timeline: 8–12 weeks.
Predictive Intelligence & Automated Alerts
Deploy iFactory's causal AI models to correlate sensor streams with failure mode trees. Activate 45-day failure foresight for fan bearings and drives. Implement MPC-based chemical dosing optimization. Establish automated compliance reporting. Timeline: 10–14 weeks.
Autonomous Optimization & Closed-Loop Control
Enable closed-loop chemical feed pump modulation and automated blowdown control based on real-time conductivity and LSI calculations. Activate cross-tower load balancing using AI-determined optimal fan speed and cell sequencing. Timeline: Ongoing continuous improvement.
Cooling Tower Analytics & Water Treatment — Frequently Asked Questions
Manual chemical dosing relies on grab samples taken once or twice per week, with adjustments made based on lab results that are 24–48 hours old. This creates a sawtooth pattern of over- and under-treatment. AI-driven model predictive control uses real-time sensor data—pH, conductivity, temperature, and flow—to anticipate chemistry changes before they occur. iFactory's platform adjusts chemical feed pump rates every 30–60 seconds instead of twice per week, eliminating oscillation, keeping corrosion inhibitors and biocides at their precise target concentrations, and reducing total chemical spend by an average of 34%.
The minimum viable sensor set for cooling tower analytics includes: pH, conductivity (for cycles of concentration tracking), inlet and outlet water temperature, ambient wet-bulb temperature, fan motor amp draw, and fan vibration velocity. An enhanced deployment adds: orthophosphate (corrosion inhibitor residual), oxidation-reduction potential (biocide activity), turbidity, hardness, alkalinity, and make-up/blowdown flow meters. iFactory's platform ingests all of these streams and derives higher-order KPIs such as approach temperature, drift loss coefficient, Langelier Saturation Index, and tower characteristic curve drift automatically.
Yes. iFactory features bidirectional connectivity with major building management systems, distributed control systems, and PLC platforms via OPC-UA, Modbus TCP, BACnet, and MQTT. The platform also provides REST API and SDK connectors for custom integrations with SAP, Oracle, and other enterprise systems. This means you can overlay iFactory's AI analytics on top of your existing sensor field without replacing your control layer, preserving capital while adding intelligence.
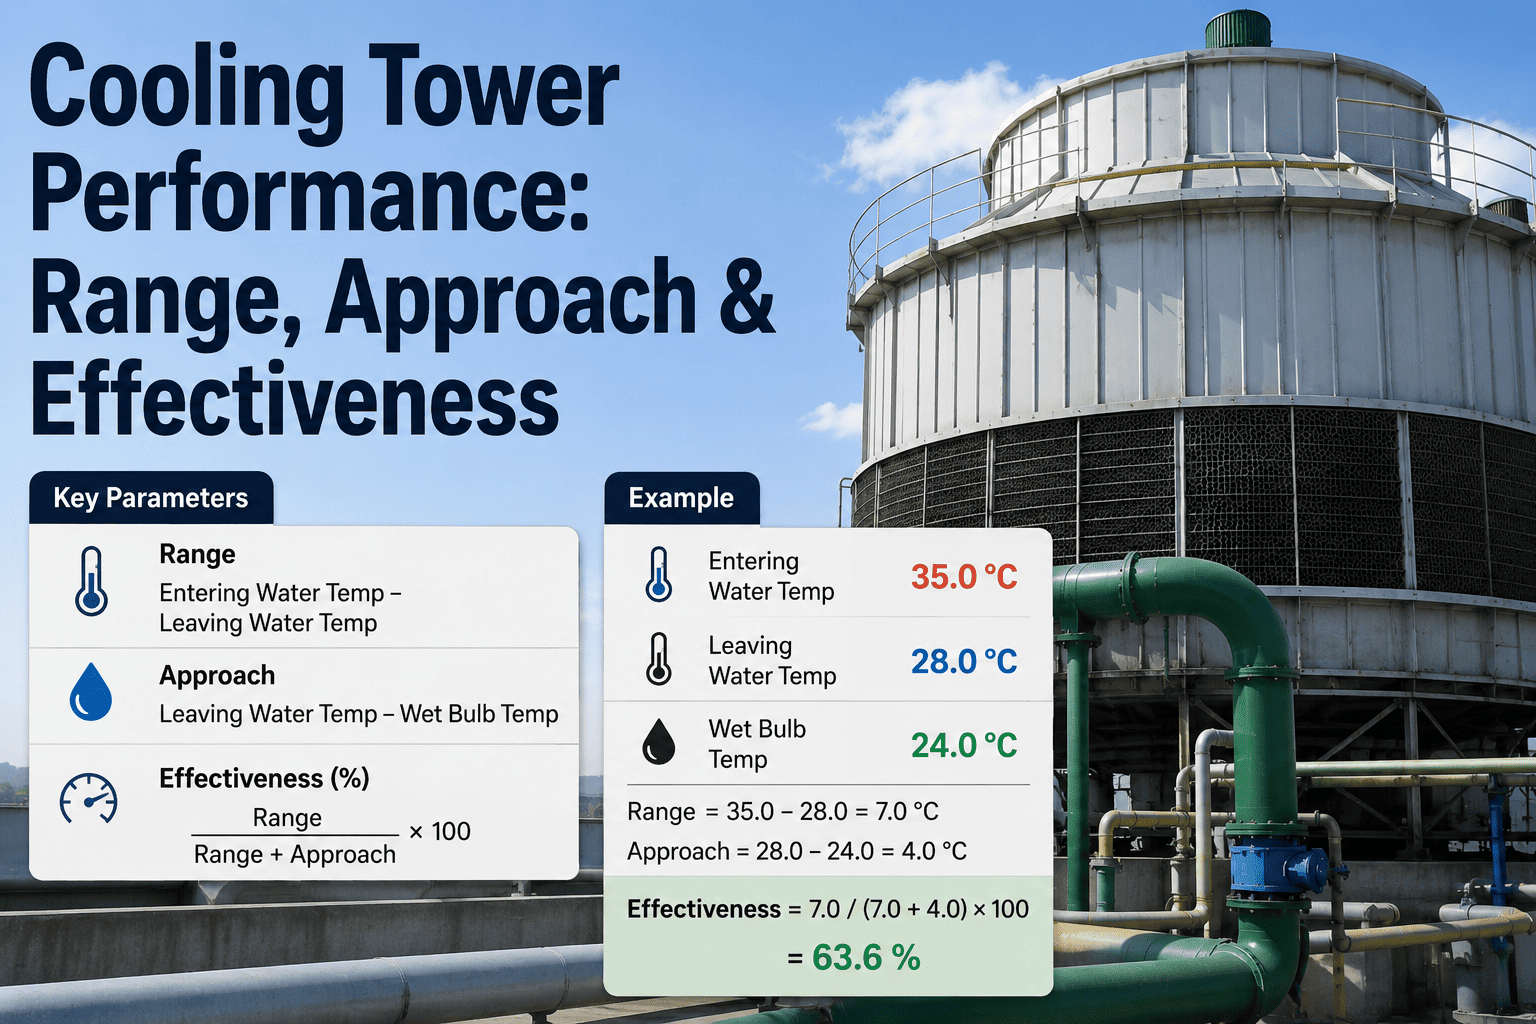
Fill media degradation manifests thermally as a shift in the tower characteristic curve—the relationship between cooling range, approach temperature, and water-air ratio. iFactory's platform continuously computes this curve from real-time temperature and flow data. When the curve drifts outside the baseline envelope (e.g., approach temperature rises 2°F above expected for the current wet-bulb condition), the AI flags a potential fill issue. The causal AI layer then cross-references this thermal drift against water chemistry trends—if conductivity and hardness are elevated, the likely cause is scaling; if turbidity and ATP are high, biological fouling is more probable. This diagnostic precision enables targeted intervention rather than costly empirical treatment.
Based on iFactory's deployment history across chemical, refining, and food & beverage facilities, the typical payback period is 8–14 months. The primary ROI drivers—chemical cost reduction (34%), fan energy savings (18%), and avoided unplanned outage costs—compound to deliver a first-year return of 1.5–3.0x the initial investment. Facilities with multiple tower cells, high local water costs, or stringent Legionella compliance requirements typically achieve payback at the faster end of this range. A detailed ROI model tailored to your specific tower configuration and utility rates is provided during our live platform demonstration.
Transform Your Cooling Tower from a Utility Cost into a Competitive Advantage
iFactory's industrial analytics platform delivers the unified intelligence needed to optimize thermal performance, chemical treatment, and mechanical reliability across every cooling tower cell in your network.