Generator failures are among the most consequential events in industrial power generation and large motor-driven processes — a single stator winding fault or rotor earth fault in a medium-voltage generator can trigger weeks of unplanned outage, emergency rewinding or replacement, and auxiliary system damage. Operations that have deployed iFactory's generator analytics platform are reporting 62% reduction in unplanned generator outages and 40% extension in mean time between rewinds within the first 18 months of live monitoring.
Why Generator Condition Monitoring Needs Predictive Analytics, Not Just Protection Relays
Protection relays are designed to trip a generator off-line when a parameter exceeds a threshold that indicates active damage — stator differential current, rotor earth fault current, over-excitation, loss of field, negative sequence current. The trip event proves that the protection system worked. It does nothing to prevent the failure that triggered it. By the time a protection relay operates, the damage requiring rewinding or rotor replacement has already occurred. The gap in most generator maintenance programs is condition analytics that detects the degradation trajectory before it reaches the protection threshold — and converts that detection into a scheduled intervention during planned maintenance rather than a forced outage followed by emergency repair.
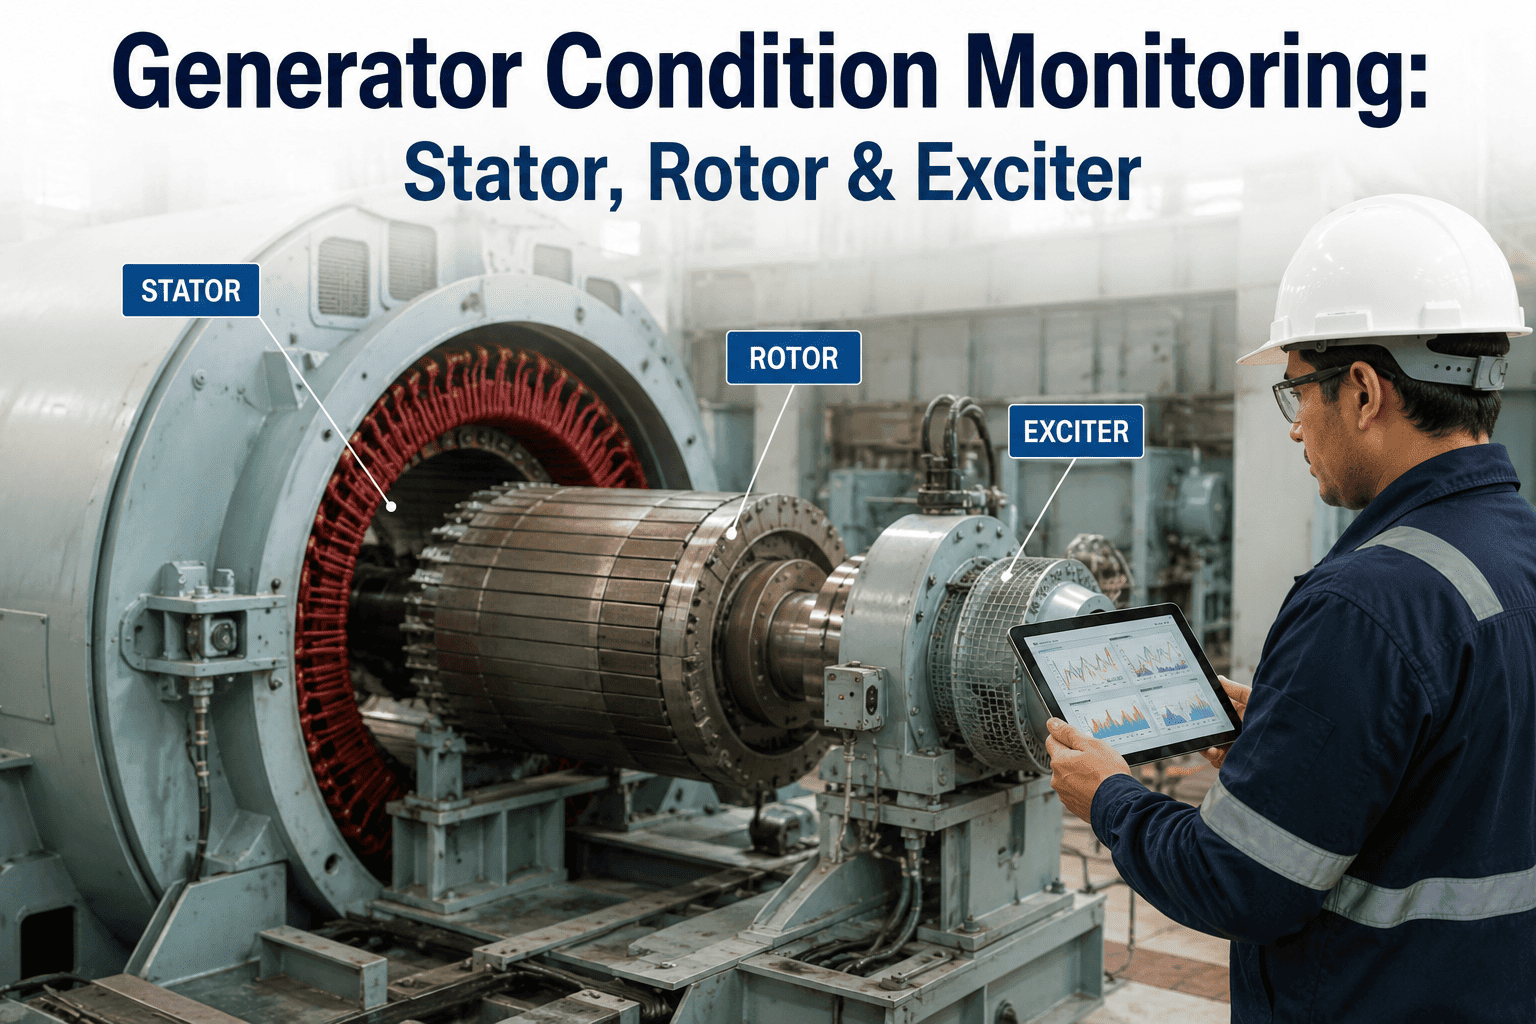
The Four Critical Generator Subsystems Where Predictive Analytics Prevents the Most Costly Failures
Generator condition monitoring must be structured around the four subsystems that account for over 90% of forced outage events. Each has distinct failure physics, monitoring parameters, and detection windows that determine whether a developing fault is detected with time to intervene or only when the protection relay operates.Book a Demo
Stator Winding Insulation and Core Condition Monitoring
Stator winding insulation failure accounts for 37% of all generator forced outages and is the single highest-consequence failure mode in any generator. The failure mechanism is typically a combination of thermal aging (insulation delamination and embrittlement), mechanical vibration (slot discharge and abrasion), electrical stress (partial discharge activity accelerating as insulation degrades), and contamination (moisture, oil, or conductive dust creating tracking paths).
Rotor Field Winding and Rotor Mechanical Condition Monitoring
Rotor failures account for 25% of generator forced outages and divide roughly evenly between electrical faults (field winding turn-to-turn shorts, rotor earth faults, thermal sensitivity) and mechanical faults (turbine-end coupling fatigue, retaining ring stress corrosion, fan blade cracking). The unique challenge with rotor monitoring is that the rotating component is inaccessible during operation — all monitoring must be performed through non-contact measurement of magnetic field, vibration, and excitation parameters.
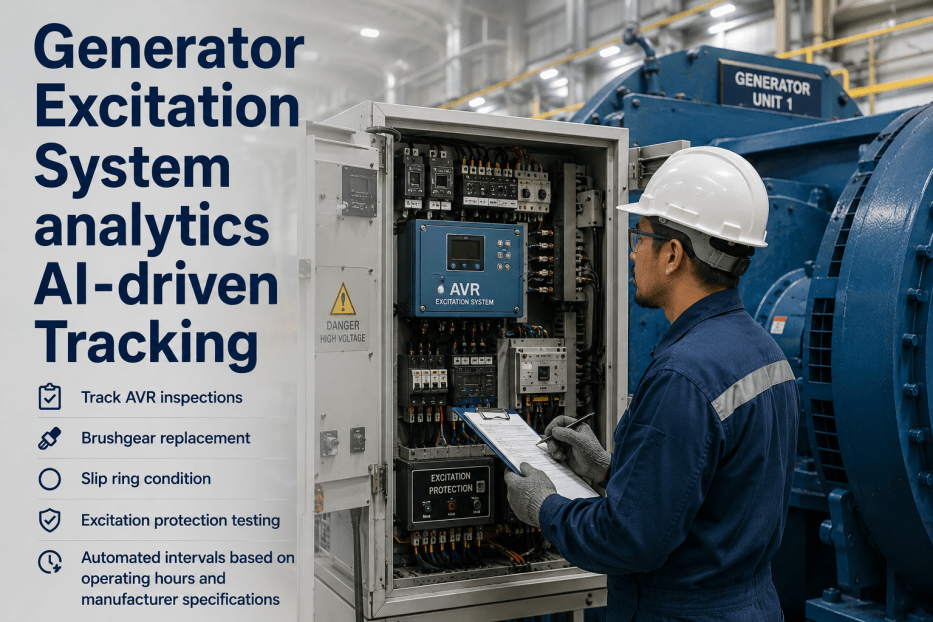
Excitation System and Voltage Regulation Performance Monitoring
Excitation system failures account for approximately 15% of generator forced outages and are disproportionately costly because an excitation system trip at full load initiates an immediate generator trip regardless of the condition of the stator or rotor. The most common failure modes are brush gear degradation in brush-type exciters, AVR tuning drift causing unstable voltage regulation, thyristor firing circuit failure in static excitation systems, and field breaker or discharge resistor malfunction.
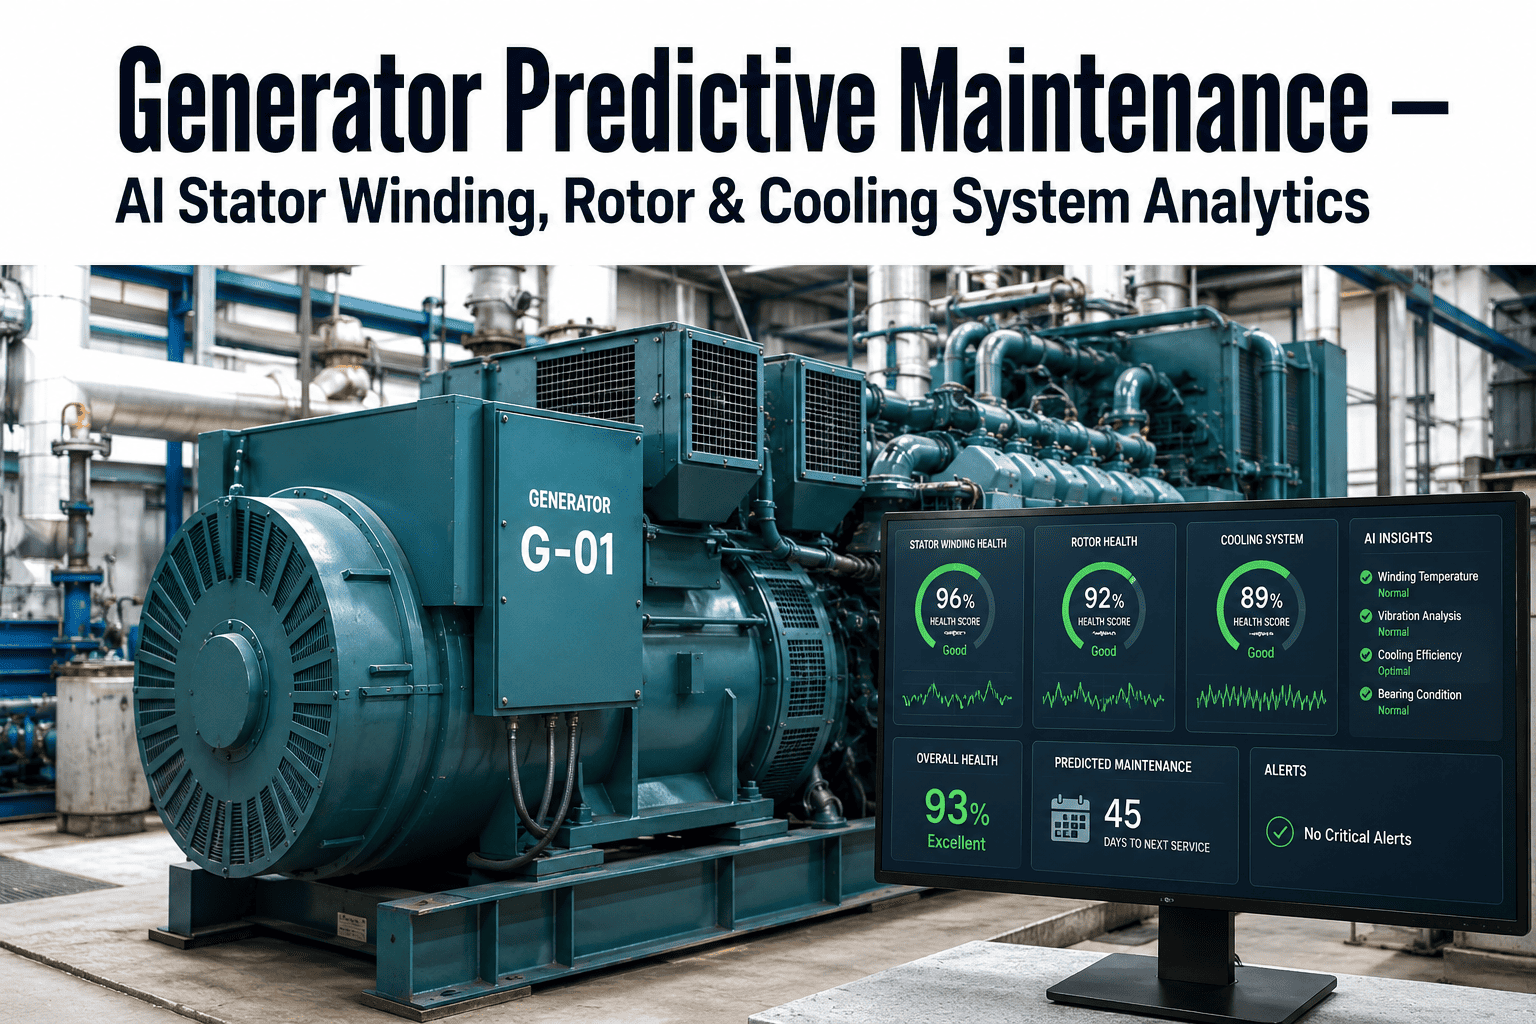
Generator Cooling System and Auxiliary Component Condition Monitoring
Cooling and auxiliary system failures — hydrogen cooling system leaks, stator cooling water blockages, seal oil system malfunctions, bearing failures — account for approximately 23% of generator forced outages.Book a Demo
How iFactory's Consequence-Weighted Risk Engine Converts Generator Condition Data into Prevented Outages
Standard generator monitoring systems display parameter trends on a screen and fire an alarm when a single parameter exceeds a fixed threshold. The problem is that generator failures rarely result from a single parameter exceeding a fixed threshold. They result from the interaction of multiple degradation mechanisms — stator insulation weakened by thermal aging, then stressed by a load cycle that produces additional winding movement, then contaminated by oil mist from a seal system with a developing leak.
Automated Inspection Scheduling: Closing the Gap Between Condition Data and Generator Maintenance Action
The most common finding in post-outage investigations of generator failures is not the absence of a testing program — it is the failure of an existing testing program to trigger the right diagnostic action at the right time. FThe table below documents how this approach changes each element of the generator maintenance program and what reliability impact the change delivers. Book a Demo
| Inspection Element | Traditional Approach | iFactory AI Approach | Reliability Impact | Compliance Benefit |
|---|---|---|---|---|
| Stator PD Testing | Quarterly offline PD test during scheduled outage | Continuous online PD monitoring with monthly trend analysis and automatic alert at 2× baseline | PD activity detected at onset, not at next scheduled test | IEEE 1434 test data continuously available for condition assessment |
| Rotor Winding IR Testing | Annual insulation resistance test, manual scheduling | Continuous injection-based monitoring with automatic IR trend and work order at 50% of minimum acceptable value | Rotor earth fault detected before second fault creates trip condition | IEEE 56 test records maintained continuously per winding |
| Excitation System Check | Annual AVR performance verification, manual log entry | Continuous AVR step response tracking with automatic alert at IEEE 421.2 criterion deviation | AVR tuning drift corrected before it causes voltage instability | IEEE 421.2 compliance records documented per operating day |
| Cooling System Inspection | Monthly H2 purity check, quarterly seal oil sample | Continuous H2 purity and pressure monitoring with automatic seal oil condition tracking | Cooling degradation detected before it causes temperature-related load reduction | H2 purity records maintained continuously per ASTM D1945 |
| Bearing Vibration Analysis | Monthly portable vibration data collection | Continuous proximity probe and accelerometer monitoring with automatic spectral band trending | Bearing degradation detected weeks before failure through trend rate analysis | ISO 10816 vibration severity records trending per bearing |
| Protection Relay Testing | Annual relay calibration test, frequently deferred | Interval tracking with automated scheduling and 90/30/14-day advance work order generation | Relay calibration verified on schedule for every generator protection function | NERC PRC-005 compliance documentation per relay per interval |
The True Financial Cost of a Generator Forced Outage — and What Prevention Is Worth
- Stator rewind for medium-voltage generator: $380,000–$1,200,000 depending on rating and rewind scope
- Rotor field winding replacement or rewind: $200,000–$800,000 including balancing and overspeed testing
- Emergency repair premiums: 30-50% surcharge for expedited rewinding and off-hours labor
- Crane mobilization, rigging, and transport costs for rotor removal and rewind facility logistics
- Diagnostic testing post-repair to confirm winding condition before return to service
- Generator forced outage duration: 2-6 weeks typical for mid-size industrial generator rewind
- Replacement power cost at $60–$120/MWh for utility-scale units; lost production margin for industrial users
- Process plant derated operation or full shutdown depending on generator criticality and redundancy
- Emergency power purchase agreements or spot market premiums during outage window
- Contract penalty exposure for power delivery or process output shortfall
- Stator cooling water system contamination from winding failure debris: chemical cleaning and component inspection
- Hydrogen cooling system contamination requiring purging and filtration system rebuild
- Bearing damage from vibration event during trip sequence: replacement and alignment verification
- Excitation system component stress from fault current during winding failure event
- Generator step-up transformer through-fault stress from winding failure — may require DGA and electrical testing
- Insurance premium increases: 15-30% for 3-5 policy years following a major generator failure claim
- Reliability penalty: derated operation or shortened inspection intervals following root cause investigation
- Spare generator or rewinding lead time requirement increases after documented failure event
- Regulatory reporting requirement for NERC GADS reportable events — public record of forced outage rate increase
Expert Review: Why Generator Maintenance Programs Need Predictive Analytics, Not More Protection Relays
In 22 years of generator engineering and condition assessment across more than 120 machines from 5 MVA to 800 MVA, I have reviewed the forensic evidence from dozens of stator winding and rotor field failures in industrial and utility service. The pattern is consistent across every case I have investigated: the data that would have predicted the failure existed in the monitoring system, but it was not being analyzed as a trending data set — it was being reviewed as individual parameter checks against fixed thresholds. A 15% increase in partial discharge magnitude between quarterly tests was recorded as 'within acceptable limits' because it did not exceed the absolute alarm threshold. An 8°C increase in slot-to-slot.
Conclusion: The 11-Day Window That Separates Scheduled Rewinds from Forced Outages
Generator failures are not sudden events. They are the endpoint of a degradation trajectory that unfolds over days to weeks — a trajectory that is visible in the condition data that the generator produces continuously during operation. The 11-day average advance warning documented across published generator failure studies means that every forced outage that occurs is a failure of data utilization, not a failure of measurement technology. The PD couplers are installed. The RTDs are reading. The vibration transducers are streaming.
Frequently Asked Questions
Most generator OEMs provide a condition monitoring package that displays real-time parameter trends and fires alarms at fixed thresholds set during commissioning. These systems are calibrated to protect the generator from immediate damage — they are designed to trip the machine or alert an operator when a parameter approaches the OEM's design limit. The gap is that OEM systems do not apply degradation physics models that predict failure trajectories weeks before they reach the protection threshold. iFactory can integrate protection relay data, portable test results, and manual inspection records to build the analytics baseline. Book a Demo
iFactory supports continuous online partial discharge monitoring in accordance with IEEE 1434 (Guide for the Measurement of Partial Discharges in AC Electric Machinery). The platform ingests PD data from capacitive couplers, high-frequency current transformers.
Yes. iFactory detects rotor turn-to-turn shorts using air gap flux probe analysis and excitation current harmonic monitoring. An air gap flux probe installed in the stator bore measures the magnetic field waveform as the rotor rotates at operating speed and load. A turn-to-turn short on the field winding produces a characteristic collapse in the flux waveform at the position of the shorted turn — visible as a missing or reduced pole slot pattern in the flux waveform when analyzed phase-resolved against the rotor rotational position.
For a single medium-voltage generator with existing partial discharge couplers, RTD instrumentation, vibration transducers, and protection relay data available via OPC-UA or Modbus, deployment runs 6-10 weeks from kickoff to live condition monitoring. The implementation breaks into three stages: Stage 1 (weeks 1-3) covers data source identification, connectivity validation, and generator baseline data collection — establishing the normal operating envelope for PD, temperature, vibration, and excitation parameters across load ranges. Stage 2 (weeks 4-7) covers degradation model calibration for each generator subsystem, compound risk signature definition for known failure modes, and inspection workflow automation — including threshold setting, alert escalation logic, and work order template deployment.
Yes. iFactory is designed as a vendor-agnostic analytics layer that integrates with existing generator monitoring infrastructure through standard industrial communication protocols. Protection relay data is ingested via Modbus RTU/TCP, DNP3, IEC 61850, or OPC-UA — supporting all major relay manufacturers including SEL, GE Multilin, ABB, Siemens, and Beckwith. . Book a Demo