A cooling tower doesn't fail loudly. It fails a few degrees at a time — approach temperature creeping up, range narrowing, effectiveness quietly sliding from a healthy number toward one that's costing real thermal efficiency at part load. Most plants only notice once condenser vacuum has degraded enough to affect heat rate, by which point the underlying cause — fouled fill, an imbalanced fan, drift loss nobody was tracking — has usually been building for weeks. Range, approach, and effectiveness are the three numbers that catch this early, if someone is actually watching them continuously instead of during an occasional walkdown, and plants that track them as a matter of routine tend to catch fill fouling and fan problems long before they show up in a heat rate report.
Thermal Efficiency · Cooling Tower Performance Monitoring
Cooling Tower Performance Monitoring: Range, Approach, and Effectiveness Explained
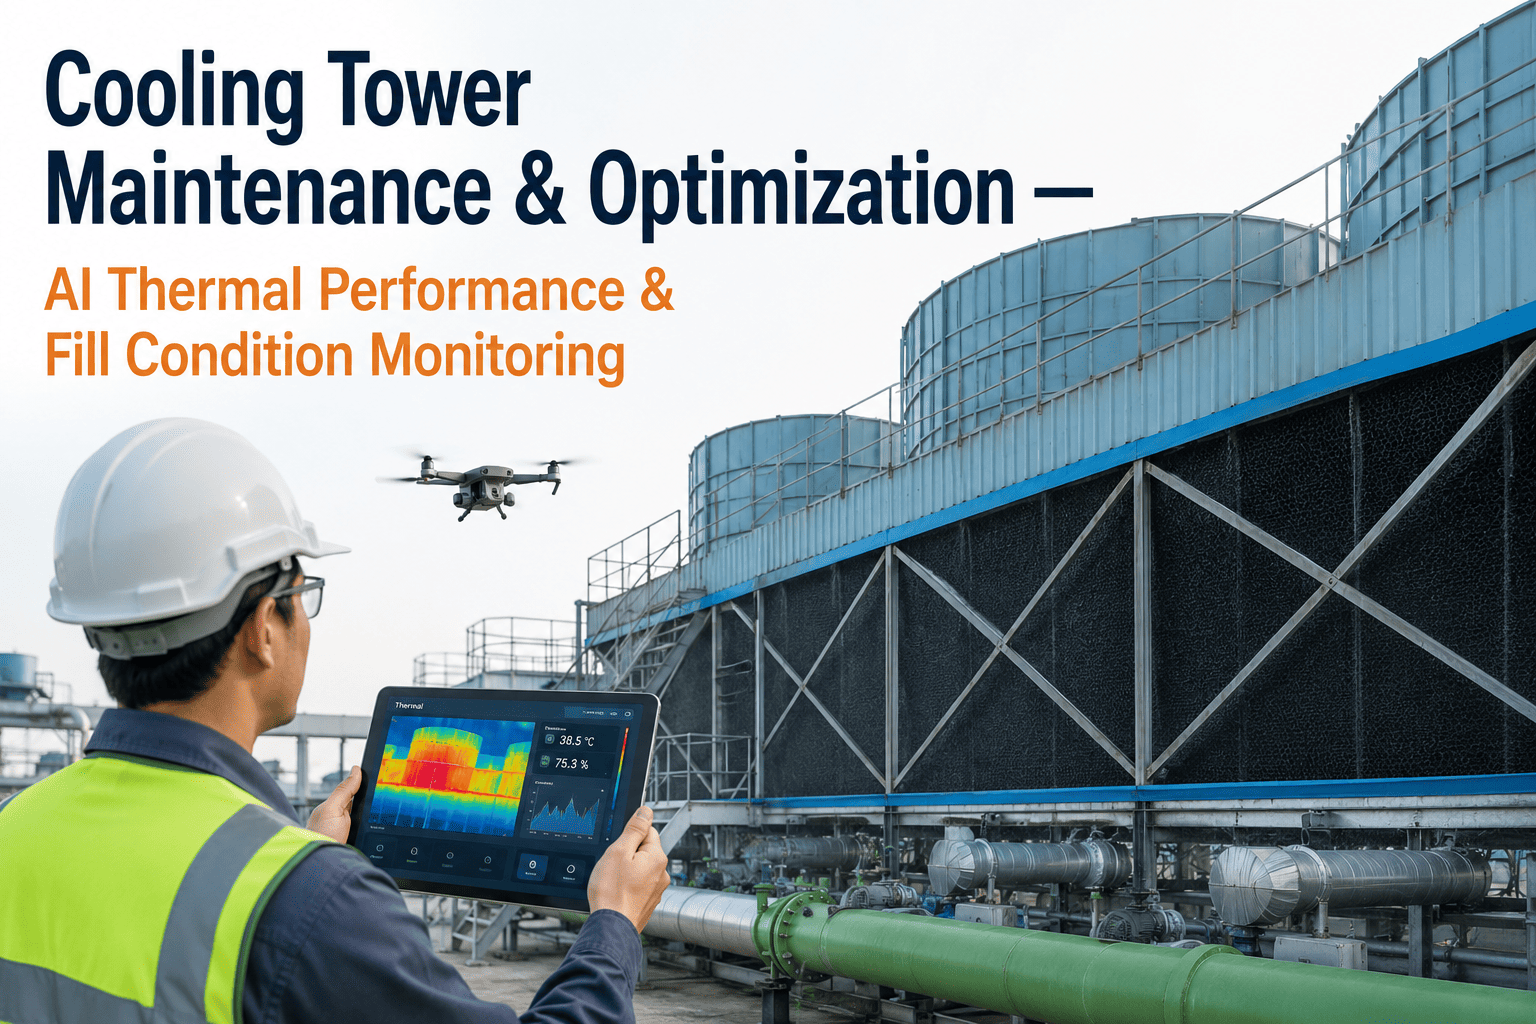
iFactory tracks range, approach, and effectiveness continuously against wet bulb conditions, flags fill fouling and fan issues before they erode part-load thermal efficiency, and gives operators a clear read on cooling capacity instead of a once-a-shift estimate.
3
Core metrics tracked continuously
Early
Warning before heat rate is affected
Live
Comparison against wet bulb conditions
The Three Numbers That Matter
Range, Approach, and Effectiveness — What Each One Actually Tells You
Metric 1
Range
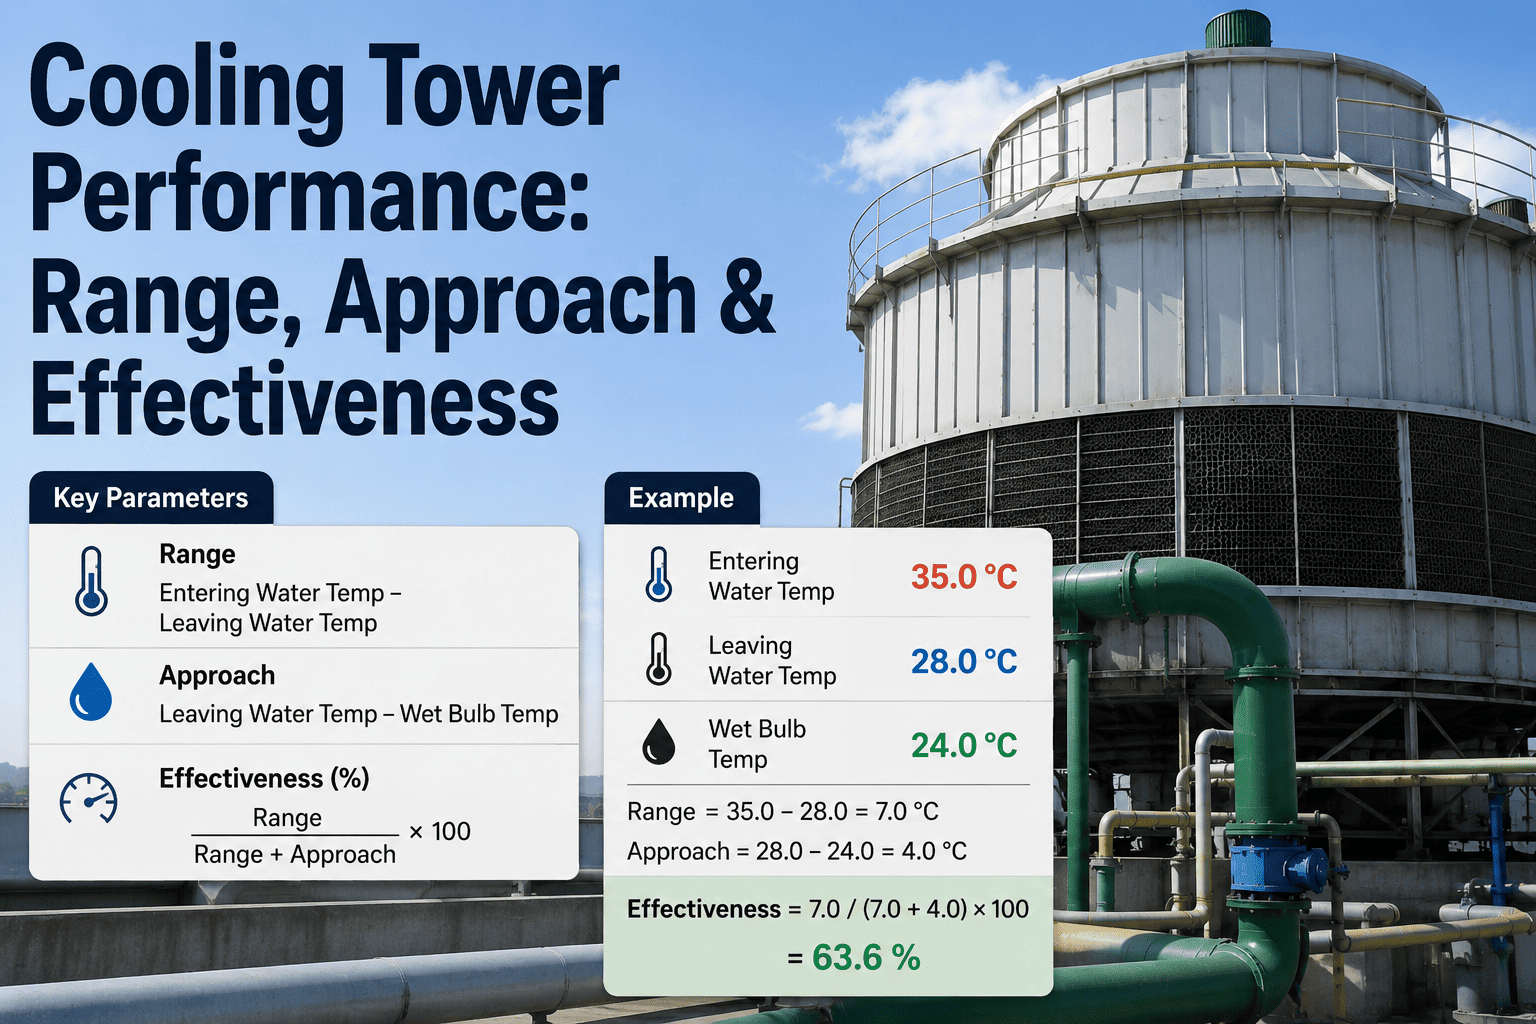
The difference between the water temperature entering the tower and the water leaving it. Range reflects how much heat the tower actually removed during that pass, and it should track closely with plant load.
Metric 2
Approach
The difference between the cold water leaving the tower and the ambient wet bulb temperature. A lower approach means the tower is getting closer to the theoretical best it can do — a rising approach is one of the earliest signs something is wrong.
Metric 3
Effectiveness
Range expressed as a percentage of the maximum possible range given current conditions. It's the single number that best summarizes whether the tower is performing the way it was designed to, regardless of weather.
Healthy vs. Degraded
What the Numbers Actually Look Like When Something's Wrong
Approach Temperature
Typical: 5–7°F above wet bulb
Degraded: 10°F+ above wet bulb
Tower Effectiveness
Typical: 70–75% effective
Degraded: below 60% effective
Range Stability
Typical: tracks steadily with load
Degraded: fluctuates independent of load
Root Causes
What's Usually Behind a Rising Approach
01
Fouled or Scaled Fill
Fill media loses surface area to scale, algae, or debris buildup over time, reducing the water-to-air contact that drives evaporative cooling in the first place.
02
Fan Imbalance or Blade Pitch Drift
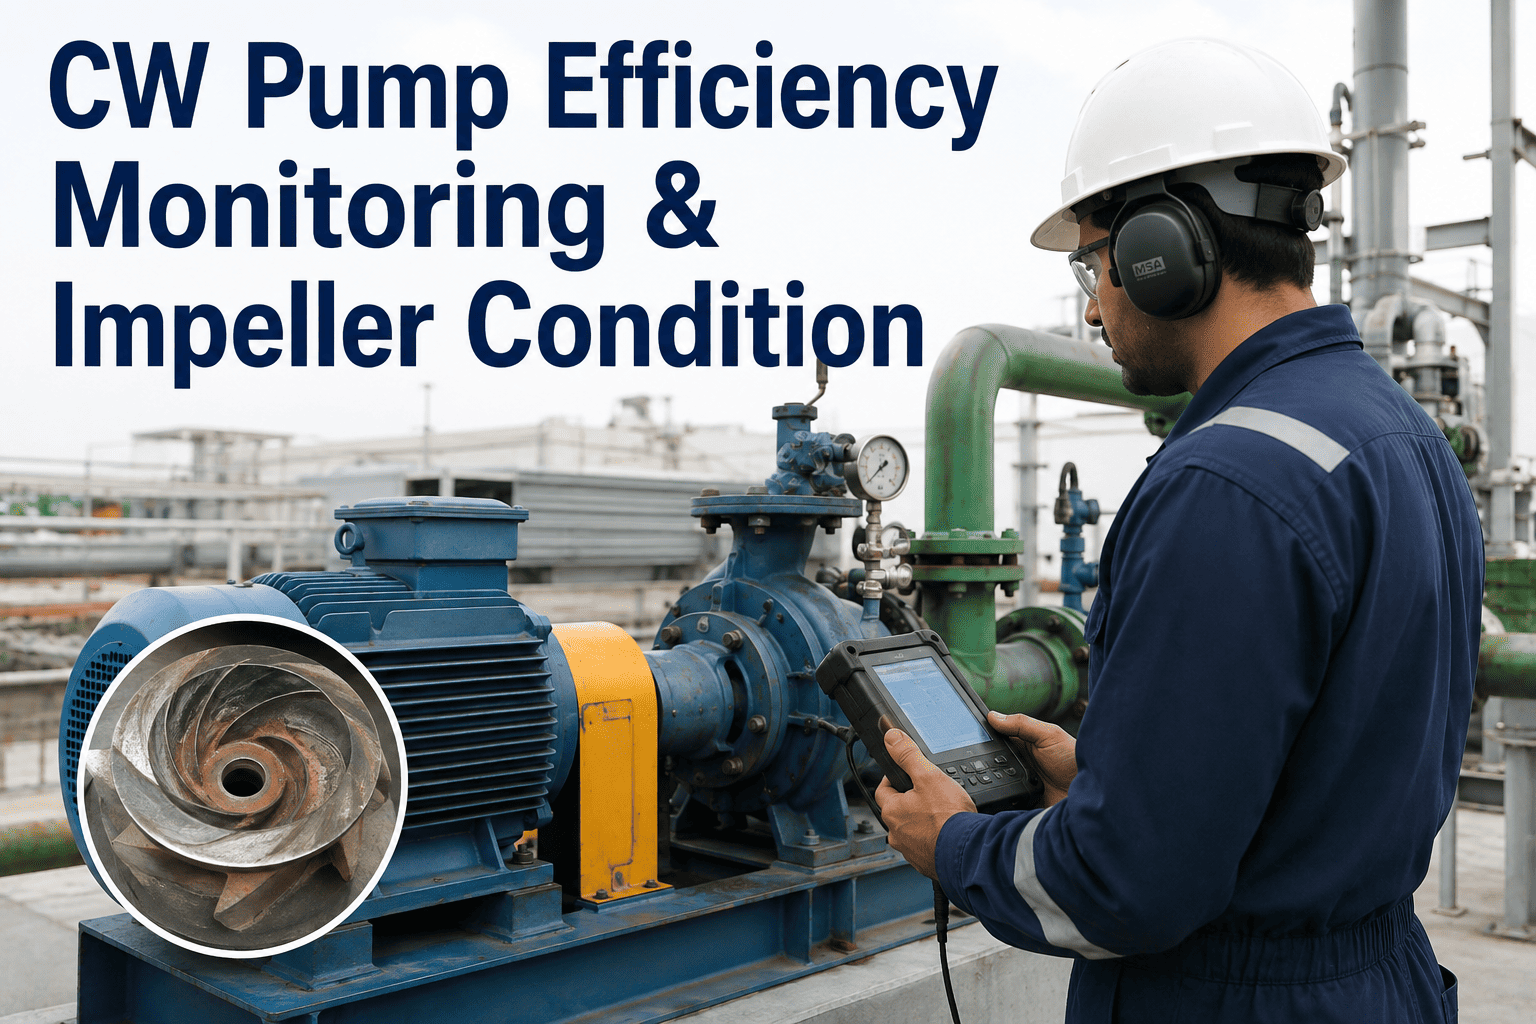
A fan running below its designed airflow — from blade wear, pitch drift, or a slipping belt — starves the tower of the air volume its effectiveness depends on.
03
Excess Drift Loss
Water droplets carried out with the exhaust air represent lost cooling capacity and lost water, and rising drift often points to worn or damaged drift eliminators.
04
Uneven Water Distribution
Clogged or misaligned spray nozzles create dry spots across the fill, so part of the tower's surface area is doing none of the cooling work it was designed for.
See Your Own Tower's Numbers
Compare Your Current Approach Against What It Should Be
Bring your last few months of cooling water temperatures and we'll walk through how your approach and effectiveness trends compare to what a healthy tower should show at the same wet bulb conditions.
Reading the Symptoms
Diagnostic Signals: What a Symptom Usually Points To
| Symptom | Likely Cause | What to Check |
| Approach rising steadily over weeks |
Gradual fill fouling |
Fill surface condition and water flow distribution |
| Approach spikes after a wind or storm event |
Fan or louver damage |
Fan blade condition and airflow rate |
| Range falls out of step with load |
Water flow imbalance across cells |
Basin water levels and distribution nozzles |
| Visible mist or water loss downwind |
Drift eliminator wear |
Eliminator condition and drift loss rate |
| Effectiveness drops only at high load |
Airflow limitation under demand |
Fan capacity margin at peak load conditions |
How Continuous Monitoring Works
From Raw Temperatures to an Actionable Alert
1
Temperatures Captured Continuously
Inlet, outlet, and ambient wet bulb readings are logged in real time instead of spot-checked once a shift.
2
Range, Approach, and Effectiveness Calculated
All three metrics are computed automatically from the live readings, so nobody is doing the math by hand from a logbook.
3
Trends Compared Against Baseline
Current performance is checked against the tower's own historical baseline at similar wet bulb and load conditions, not a generic industry number.
4
Alerts Routed Before It's a Heat Rate Problem
A drifting approach or falling effectiveness triggers an alert while it's still a maintenance item, not after it's already shown up in fuel consumption.
A Composite Scenario
An Approach That Drifted for Six Weeks Before Anyone Noticed
Before
Cooling water temperatures were logged manually once a shift, with no ongoing comparison against wet bulb conditions. Approach crept up gradually over six weeks as fill fouling worsened, and the trend wasn't caught until condenser vacuum had degraded enough to show up in a heat rate review — well after the fill had gone from lightly fouled to a full cleaning job.
After
Approach is now tracked continuously against live wet bulb readings, and the same gradual drift triggered an alert within the first two weeks, while the underlying fouling was still minor. A scheduled fill cleaning during a planned outage resolved it before condenser vacuum or heat rate were ever affected.
Before You Start
Getting Ready to Monitor Cooling Tower Performance
Confirm inlet, outlet, and wet bulb temperature sensors are in place and calibrated
Establish a baseline for range, approach, and effectiveness at a few representative load and weather conditions
Decide what approach and effectiveness thresholds should trigger a maintenance alert
Schedule a fill and eliminator inspection to correlate physical condition against the current numbers
Common Questions
Cooling Tower Performance Monitoring — FAQ
What's a normal approach temperature for a cooling tower?
Most towers are designed for an approach somewhere in the 5 to 7°F range above wet bulb temperature, though the exact design target depends on the specific tower and its original specification. What matters more than hitting an exact number is whether the approach is holding steady relative to its own historical baseline, since a rising trend is the real warning sign regardless of where it started.
Our team can help establish what normal looks like for your specific tower.
Why does effectiveness matter more than range on its own?
Range by itself is heavily influenced by current load and can look fine even when the tower is underperforming, since a lightly loaded tower naturally shows a smaller range. Effectiveness accounts for the maximum possible range under current conditions, which makes it a more reliable single number for judging whether the tower is actually performing the way it was designed to.
Can fan issues really cause this much of a performance drop?
Yes. Airflow is one of the two inputs driving evaporative cooling, alongside water distribution across the fill, so a fan running below its designed capacity limits how much cooling the tower can achieve no matter how clean the fill is. A fan producing even a modest airflow shortfall can show up clearly in a rising approach trend.
How is drift loss different from evaporative loss?
Evaporative loss is the cooling process working as intended — water evaporating to remove heat. Drift loss is liquid water droplets escaping with the exhaust air without evaporating at all, which represents pure lost water and lost cooling capacity, and is usually a sign that drift eliminators need inspection or replacement.
How quickly can continuous monitoring catch a developing problem?
Because range, approach, and effectiveness are calculated from live temperature data rather than periodic manual readings, a developing trend like gradual fill fouling typically becomes visible within days to a couple of weeks, well before it would show up in a monthly heat rate review.
Book a demo to see how the alerting thresholds are typically set for a tower like yours.
Stop Waiting for Heat Rate to Tell You
Track Range, Approach, and Effectiveness Before They Cost You Efficiency
iFactory monitors your cooling tower continuously against live wet bulb conditions, flags fill fouling and fan issues early, and keeps thermal efficiency from quietly eroding at part load.