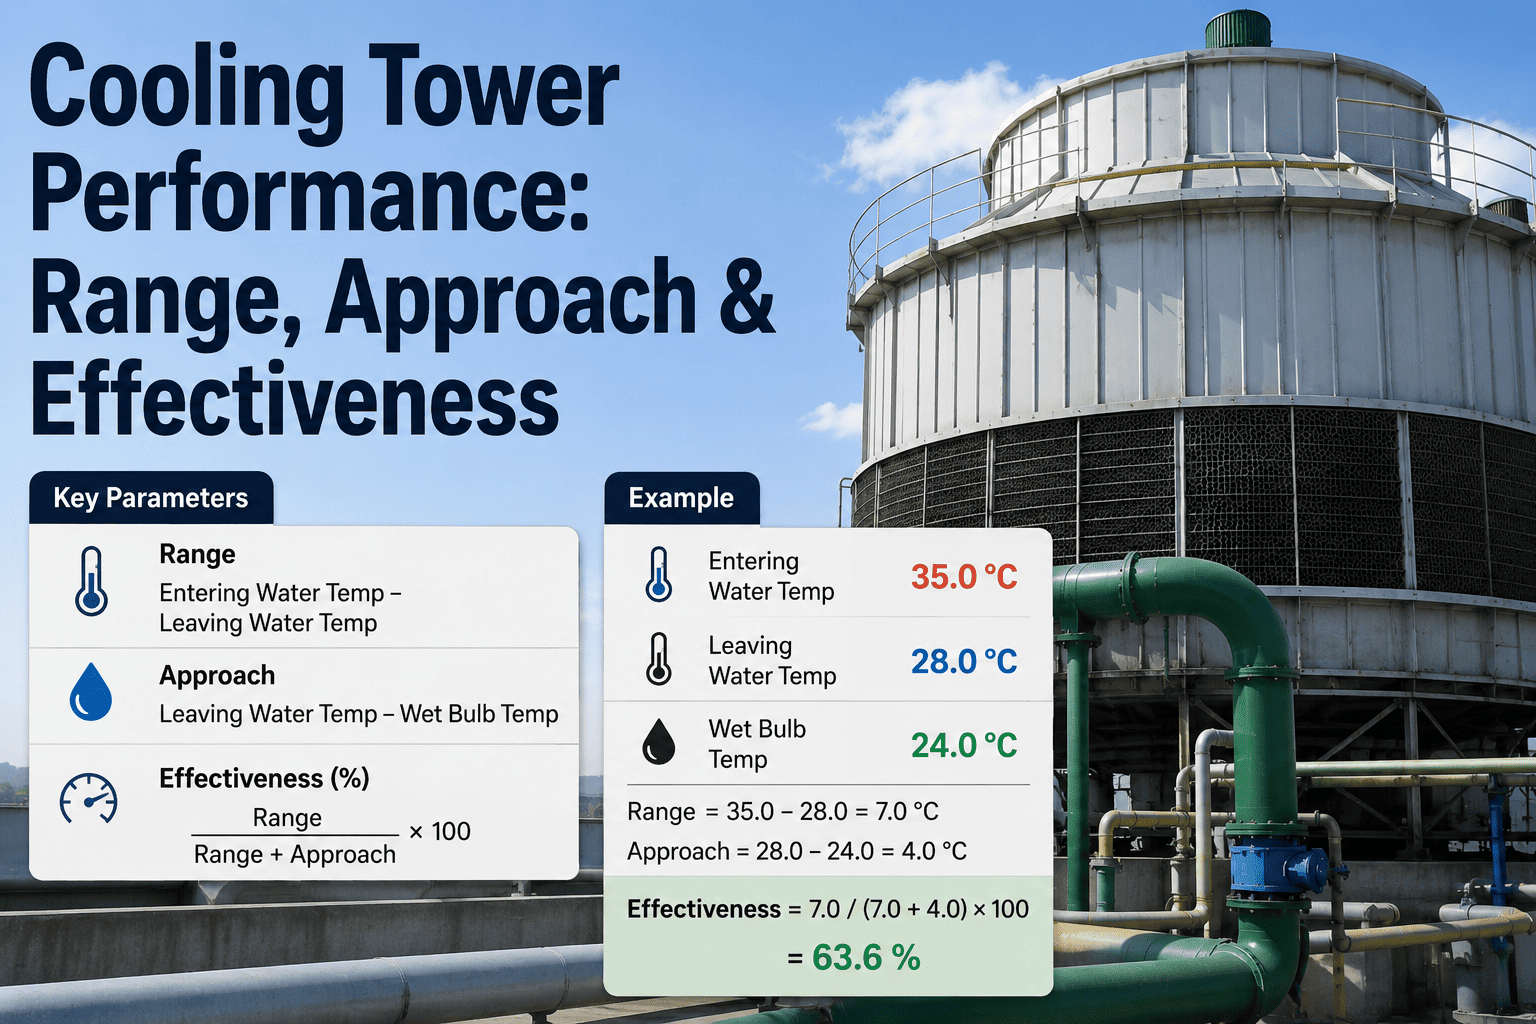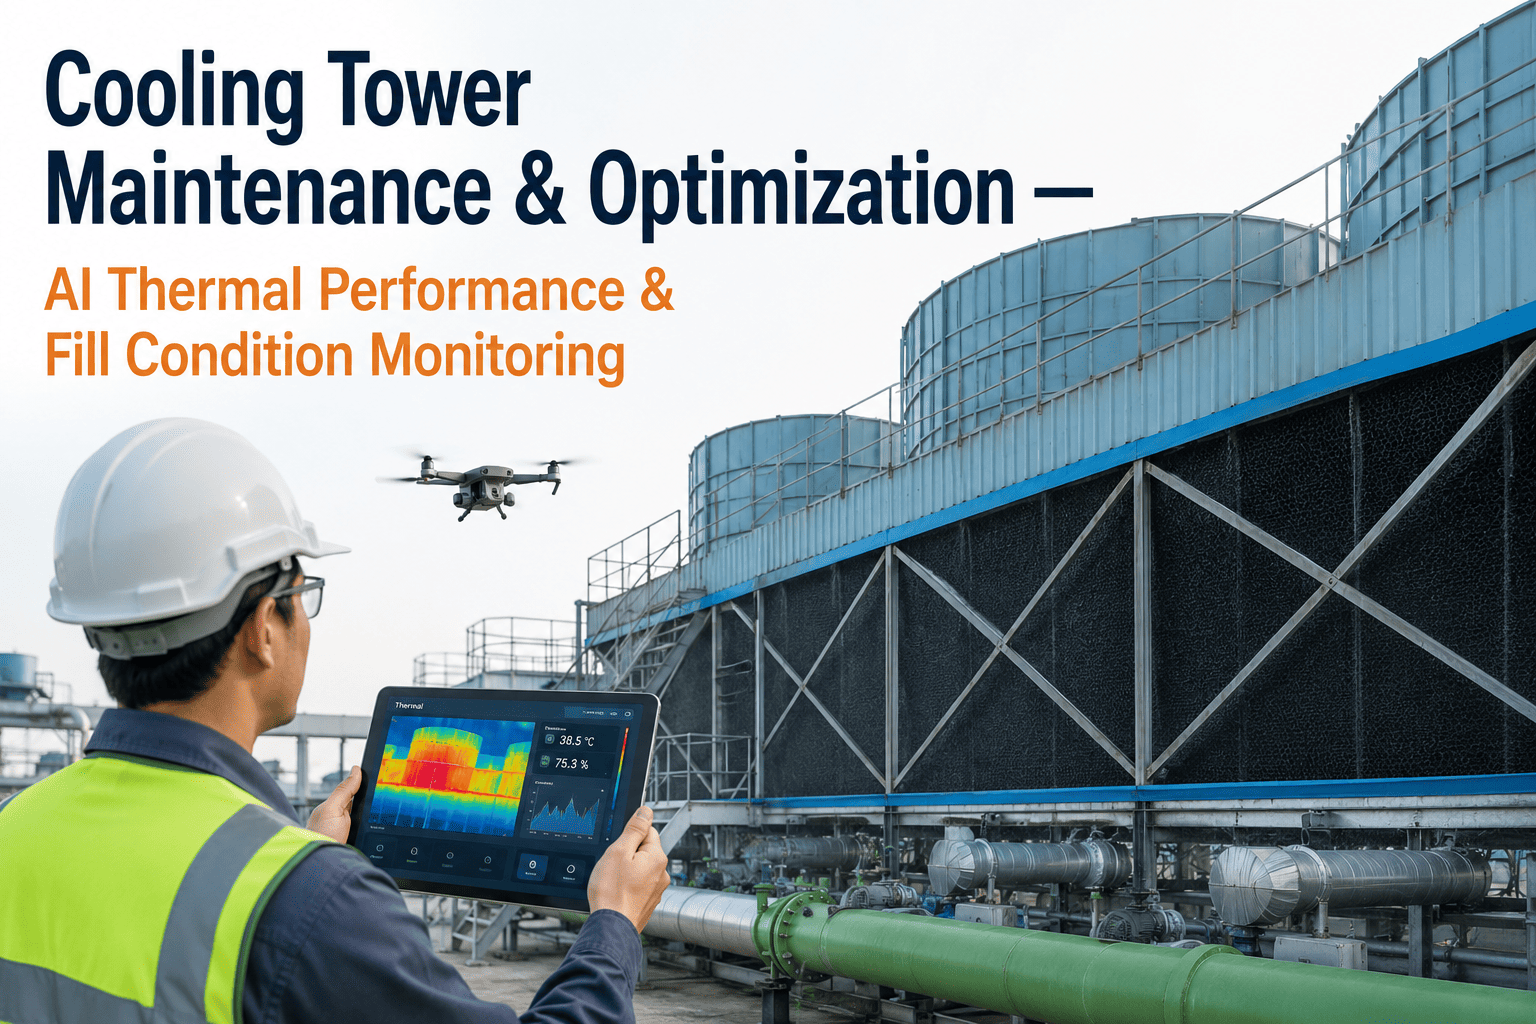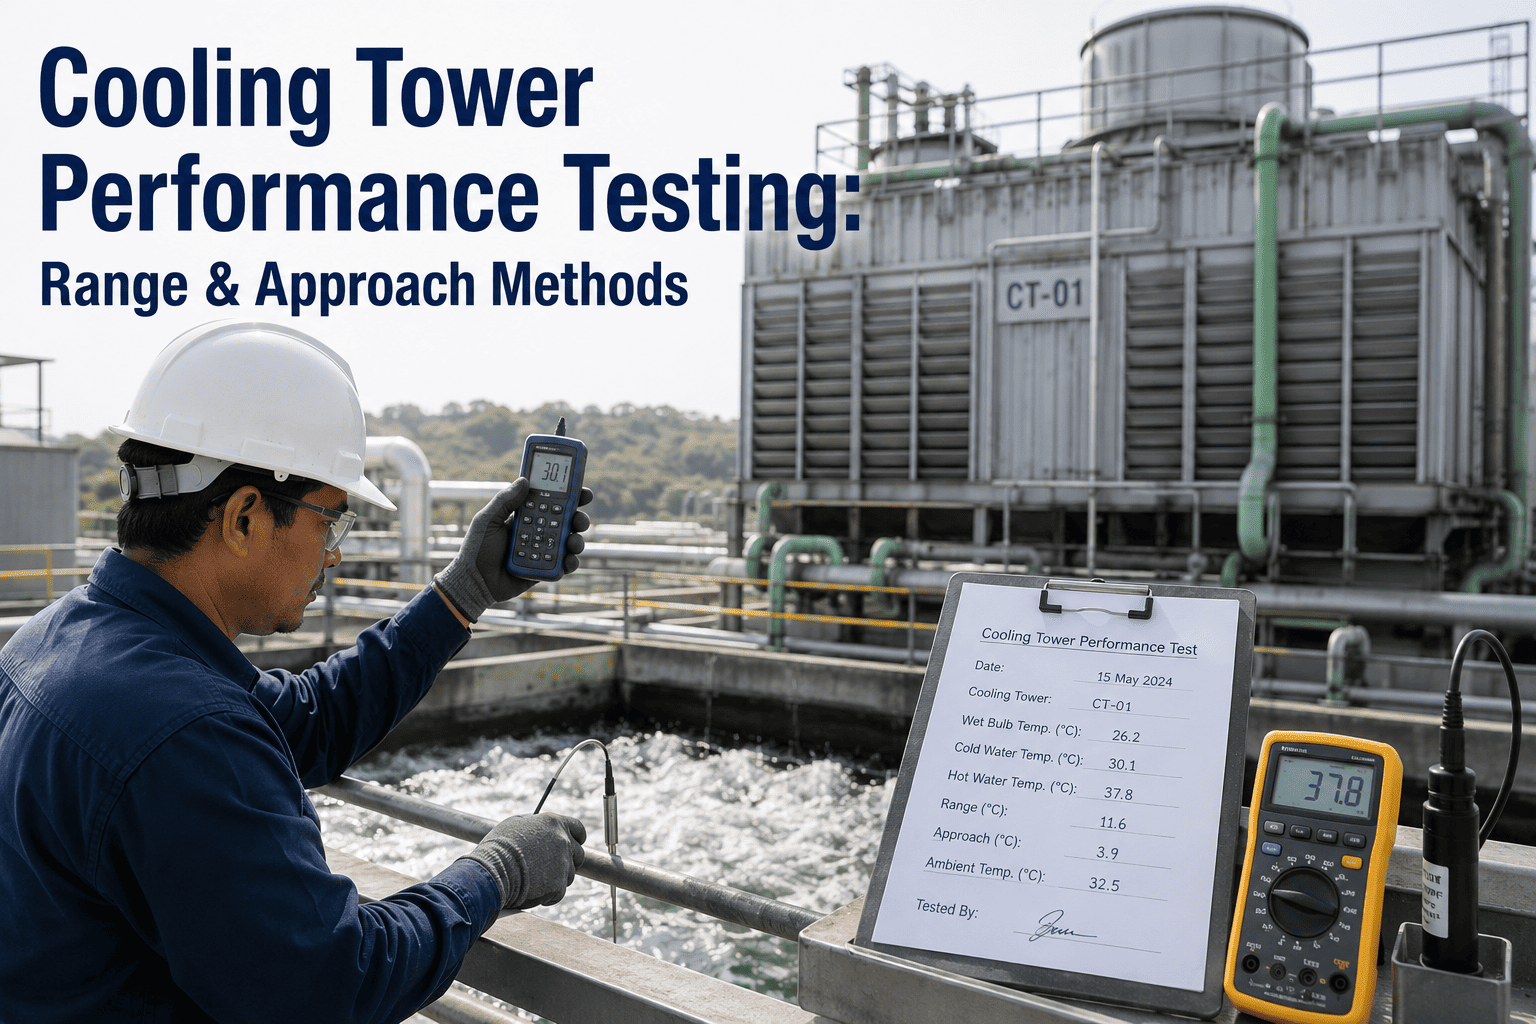
Cooling tower performance testing is the process of measuring how effectively a cooling tower rejects heat from the circulating water system under actual operating conditions, expressed through the fundamental metrics of range, approach, and effectiveness. The range is the temperature difference between the hot water entering the tower and the cold water leaving it, which represents the actual heat rejection achieved. The approach is the difference between the cold water temperature leaving the tower and the ambient wet-bulb temperature, which represents how close the tower gets to the theoretical thermodynamic limit of cooling. When the measured approach is significantly higher than the design approach at equivalent heat load and flow conditions, the tower is degraded and is forcing the chiller plant or process to work harder than necessary. Facilities that track range and approach as simple spreadsheet entries without correlating them to wet-bulb conditions, water flow rates, and heat load are unable to distinguish between normal weather-driven variation and genuine mechanical degradation. Teams that want to build a systematic cooling tower performance program can Book a Demo to see how iFactory structures thermal performance data and flags degradation before it impacts plant efficiency.
Your Cooling Tower Has Been Losing Capacity for Years. You Just Cannot See It.
iFactory tracks range, approach, and effectiveness against design conditions in real time, so your team knows exactly when thermal performance drops below the threshold that costs money.
Range, Approach, and Effectiveness: The Three Numbers That Define Tower Performance
Every cooling tower performance assessment, whether it is a formal CTI test or a routine operational check, reduces to three calculated values that describe how well the tower is converting hot water into cold water given the atmospheric conditions it is operating in. These three metrics are not independent. They are linked by the heat balance equation and the psychrometric properties of the air, but each one reveals a different aspect of tower performance. The visual below maps each metric to its physical meaning in the cooling process, showing exactly where each temperature is measured and what the calculated difference represents.
Effectiveness = Range / (Range + Approach) x 100. This single number expresses tower performance as a percentage of the maximum possible cooling for the current wet-bulb condition. An 86% effectiveness means the tower achieves 86% of the theoretical maximum temperature drop.
How a Formal CTI Performance Test Is Conducted Step by Step
The Cooling Technology Institute has published the most widely accepted standard for cooling tower thermal performance testing, known as CTI ATC-105. This standard defines the measurement requirements, data quality criteria, and calculation methods that must be followed to produce a test result that can be compared directly to the tower's design guarantee. A CTI test is not a casual measurement. It requires specific instrumentation, a minimum stabilization period, and adherence to strict limits on how much the test conditions can deviate from the design conditions. The seven steps below represent the complete CTI test sequence from preparation through to the final performance rating.
Instrument Calibration and Installation
Install calibrated temperature sensors with accuracy of plus or minus 0.2 degrees Fahrenheit at the hot water inlet, cold water outlet, and ambient air stations. Install flow measurement devices, typically ultrasonic flow meters on the cold water piping, with accuracy of plus or minus 2% of reading. Install psychrometric instruments at the air inlet to measure dry-bulb and wet-bulb temperatures. All instruments must have current calibration certificates traceable to NIST standards, and the calibration data must be documented in the test report.
Stabilize Operating Conditions
Bring the tower to steady-state operation at or near the design heat load and water flow rate. CTI ATC-105 requires that the heat load during the test be within plus or minus 10% of the design heat load, the water flow rate within plus or minus 10% of design flow, and the wet-bulb temperature within plus or minus 5 degrees Fahrenheit of the design wet-bulb. Steady state is confirmed when the hot water temperature, cold water temperature, and wet-bulb temperature all remain within 0.5 degrees Fahrenheit for a minimum of 30 consecutive minutes before data collection begins.
Collect Minimum 30 Minutes of Steady-State Data
Record all measured parameters at intervals not exceeding 5 minutes for a minimum data collection period of 30 minutes. Each data point must include hot water temperature, cold water temperature, water flow rate, dry-bulb temperature, wet-bulb temperature, barometric pressure, and fan power if the tower is mechanical draft. The data set is then screened for any readings that fall outside the steady-state criteria, and those readings are discarded before the average values are calculated for the test report.
Calculate Heat Rejection from Water Side
Compute the heat rejection from the water-side measurements using the formula Q = 500 x GPM x Range, where Q is the heat rejection in BTU per hour, GPM is the measured water flow rate, and Range is the difference between hot and cold water temperatures. This water-side heat rejection is the primary measure of tower performance. It must be cross-checked against the air-side heat balance, which is calculated from the air flow rate, enthalpy difference between inlet and outlet air, and the mass flow of air through the tower.
Validate Heat Balance Closure
Compare the water-side heat rejection to the air-side heat rejection. CTI ATC-105 requires that the difference between the water-side and air-side heat balances be within 5% for the test to be considered valid. If the heat balance does not close within 5%, the test data is investigated for measurement errors, instrument drift, or unaccounted heat losses. Common causes of poor heat balance closure include inaccurate flow measurement, temperature sensor placement errors, and unmeasured water losses from drift or blowdown during the test period.
Correct to Design Conditions
If the test conditions deviate from the design conditions within the allowed tolerances, the measured performance is corrected to the exact design conditions using the tower's performance curves. This correction accounts for the fact that a tower tested at a wet-bulb temperature 3 degrees below design will show a lower approach than it would at the design wet-bulb, even if the tower is in identical mechanical condition. The correction process uses the manufacturer's performance curves or the CTI correction methodology to produce a capability ratio that represents the tower's performance at design conditions.
Determine Capability Ratio and Pass/Fail
The capability ratio is the ratio of the measured and corrected heat rejection to the design heat rejection at design conditions. A capability ratio of 1.00 means the tower meets its design guarantee exactly. A ratio of 0.95 means the tower delivers 95% of its guaranteed capacity. Most tower purchase specifications require a capability ratio of 1.00 or higher for acceptance, with penalties or required corrective actions specified for ratios below 0.97. The final test report documents all measurements, calculations, corrections, and the resulting capability ratio with an uncertainty analysis.
Comparing Design Point Performance to What Your Tower Actually Delivers Today
The most actionable performance assessment is not a single test result but a direct comparison between what the tower was designed to deliver and what it is currently producing at equivalent conditions. The table below presents a typical design-versus-actual comparison for a counterflow induced-draft cooling tower that has been in service for eight years. Each parameter is shown at the design point and at the current measured condition, with the deviation and its operational impact. This type of comparison is the foundation for deciding whether a tower needs maintenance, refurbishment, or replacement, and it cannot be produced from a single temperature reading. It requires structured data collection that captures all of the operating parameters simultaneously.
| Parameter | Design Value | Current Measured | Deviation | Impact |
|---|---|---|---|---|
| Water Flow Rate | 4,000 GPM | 3,920 GPM | -2.0% | Minor: within CTI tolerance |
| Hot Water Inlet | 95.0 F | 97.8 F | +2.8 F | Higher return temp from process |
| Cold Water Outlet | 80.0 F | 84.2 F | +4.2 F | Forces chiller to work harder |
| Wet-Bulb Temperature | 78.0 F | 78.0 F | 0.0 F | Same conditions for fair comparison |
| Range | 15.0 F | 13.6 F | -1.4 F | 9.3% less heat rejection per gallon |
| Approach | 7.0 F | 11.2 F | +4.2 F | 60% worse than design approach |
| Effectiveness | 68.2% | 54.8% | -13.4% | Significant capacity loss |
| Heat Rejection | 30.0 MM BTU/hr | 26.7 MM BTU/hr | -11.0% | 3.3 MM BTU/hr shortfall |
| Fan Power | 75 HP each (x2) | 78 HP each (x2) | +4.0% | More energy for less cooling |
The comparison reveals that this tower is delivering only 89% of its design heat rejection while consuming 4% more fan power than specified. The approach has degraded from 7.0 degrees to 11.2 degrees, a 60% increase that directly increases the cold water supply temperature to the chiller plant. For every degree the cold water temperature rises above design, a centrifugal chiller loses approximately 1.5% to 2% of its capacity and experiences a similar increase in energy consumption per ton of cooling. This means the 4.2 degree approach degradation is not just a tower problem; it is cascading into the chiller plant as additional electrical demand and reduced cooling capacity that may be limiting production during peak load periods. Book a Demo to see how iFactory automates design-versus-actual comparisons and quantifies the cascading cost of tower degradation.
What Actually Causes a Cooling Tower to Lose Performance Over Time
Cooling towers do not lose performance at a uniform rate. Different degradation mechanisms cause different types of performance loss, and each mechanism produces a distinct signature in the range and approach data. A tower with fouled fill will show a gradual increase in approach with relatively stable range, while a tower with air distribution problems will show reduced range because the air-to-water contact is degraded. Understanding which mechanism is active is essential for selecting the correct remediation action, because cleaning fill will not fix a fan performance problem, and repairing a fan will not fix a water distribution problem. The six degradation pathways below represent the most common causes of cooling tower performance loss in industrial and commercial applications.
Fill Media Fouling
Signature: Approach increases, Range stableMineral scale, biological growth, and suspended solids accumulate on the fill media surface, reducing the air-to-water contact area and degrading the heat and mass transfer that drives the cooling process. Scale from calcium carbonate and silica is the most common fouling mechanism in towers using hard makeup water. Biological fouling from algae and bacteria is common in towers with inadequate water treatment. Fouled fill increases the air-side pressure drop, which reduces air flow and further degrades performance. The fill must be cleaned or replaced to restore the original heat transfer surface area. In severe cases, the fill structure itself degrades from chemical attack or UV exposure, requiring complete fill media replacement rather than cleaning.
Water Distribution Degradation
Signature: Uneven approach across tower cellsThe hot water basin and distribution nozzles are designed to spread the water uniformly across the entire cross-section of the fill media. When nozzles plug with debris or scale, when the basin level becomes uneven due to leveling issues, or when the distribution piping develops internal corrosion that redirects flow, the water distribution becomes non-uniform. Areas that receive less water are underutilized, while areas that receive excess water are overloaded beyond their design air-to-water ratio. The net effect is that the tower behaves as if it is smaller than its physical dimensions, because the poorly distributed areas contribute little to the overall heat rejection. Nozzle inspection and replacement is a relatively low-cost maintenance action that can restore significant lost capacity.
Air Flow Reduction
Signature: Both Range and Approach degradeThe air flow through the tower is driven by either fans in mechanical draft towers or natural convection in natural draft towers. In mechanical draft towers, fan blade erosion, motor degradation, gearbox wear, and VFD programming changes can all reduce the air flow below the design rate. In both tower types, air-side obstructions such as debris on the air inlet louvers, missing or damaged drift eliminators that create unintended flow resistance, and structural modifications that block air paths all reduce the air flow. Since cooling tower performance is directly proportional to the air-to-water ratio, any reduction in air flow degrades both range and approach simultaneously. Fan performance testing using vibration analysis, current measurement, and static pressure differential across the tower can identify whether the fan system is delivering design air flow.
Drift Eliminator Damage
Signature: Water loss increases, no thermal change initiallyDrift eliminators capture water droplets entrained in the exhaust air stream and return them to the tower basin. When drift eliminators break, shift out of position, or are removed and not replaced, water loss from drift increases dramatically. While drift loss does not directly affect thermal performance in the short term, it represents a significant economic loss in makeup water and water treatment chemicals. A tower losing 0.5% of its circulating water flow as drift instead of the design 0.002% is losing 250 times more water than intended. Over time, the missing or damaged drift eliminators can also alter the air flow pattern through the tower, creating channeling that does degrade thermal performance indirectly by reducing the effective contact between air and water in the fill media.
Heat Exchanger Fouling Upstream
Signature: Hot water temp rises, Range appears to increaseNot all performance changes originate in the tower. When heat exchangers in the process or chiller plant foul, the process cannot reject heat effectively into the cooling water, causing the hot water return temperature to the tower to rise. This makes the range appear larger, which can be misinterpreted as improved tower performance when in fact the tower is simply receiving hotter water. The approach may remain unchanged or even improve slightly because the higher inlet temperature increases the driving force for heat transfer in the tower. Distinguishing between tower degradation and upstream heat exchanger fouling requires looking at both the tower metrics and the process heat exchanger performance simultaneously, which is only possible when the data is captured in an integrated system rather than isolated tower-only monitoring.
Ambient Condition Mismatch
Signature: Approach varies seasonally, no mechanical faultA tower designed for a 78 degree wet-bulb will perform differently at 65 degree wet-bulb in winter than at 80 degree wet-bulb in summer. The approach will be lower in winter and higher in summer, which is normal thermodynamic behavior, not degradation. However, if the original design wet-bulb was 75 degrees and the plant now frequently operates at 82 degrees due to climate trends or microclimate changes from new construction nearby, the tower will consistently show a higher approach than design even though it is mechanically sound. This is not a degradation problem but a design basis mismatch that may require capacity addition or operational changes to the cooling water temperature setpoint strategy.
A 4-Degree Approach Increase Is Costing You More Than You Think.
iFactory correlates range and approach data with wet-bulb conditions and heat load to separate real degradation from weather variation, and calculates the actual dollar impact on your chiller plant.
The Math Behind Every Cooling Tower Performance Number
Cooling tower performance is entirely defined by measurable temperatures and flow rates combined through straightforward thermodynamic relationships. There are no subjective assessments or visual inspections involved in the core performance calculation. Every metric, from range through effectiveness to the final capability ratio, is derived from the same set of raw measurements combined with psychrometric data for the ambient air. The formula blocks below present the complete calculation chain from raw field measurements to the final performance metrics, using the same notation and methodology as CTI ATC-105. Understanding these formulas is essential for anyone responsible for evaluating tower performance, because it reveals which measurements have the most influence on the result and therefore where measurement accuracy matters most.
Range
The difference between the hot water inlet temperature and the cold water outlet temperature, measured in degrees Fahrenheit. This is the simplest and most directly measurable performance metric. It requires only two temperature readings and no knowledge of atmospheric conditions. However, range alone is insufficient to assess tower performance because a high range can result from either excellent tower performance or simply a very high inlet temperature. Range must always be interpreted in conjunction with approach and wet-bulb temperature to determine whether the tower is performing well or poorly.
Approach
The difference between the cold water outlet temperature and the ambient wet-bulb temperature. Wet-bulb temperature is the lowest temperature achievable by evaporative cooling and represents the theoretical lower bound for the cold water temperature. Approach is the definitive measure of tower thermal performance because it directly expresses how effectively the tower is using the available cooling potential in the ambient air. A lower approach at constant wet-bulb means better tower performance, regardless of the absolute temperatures involved. Approach is the metric most commonly used for performance trending and degradation detection because it normalizes for weather variation.
Heat Rejection
The total heat rejection rate in BTU per hour, calculated from the water flow rate in gallons per minute and the range in degrees Fahrenheit. The constant 500 incorporates the specific heat of water and the unit conversions from gallons to pounds and from minutes to hours. This formula assumes the specific heat of water is 1.0 BTU per pound per degree Fahrenheit and the water density is 8.33 pounds per gallon. For highly accurate work, the actual specific heat and density at the measured water temperature should be used instead of the nominal values, but for industrial cooling tower applications the 500 constant produces results within 0.5% of the exact calculation.
Effectiveness
Expresses the tower's actual heat rejection as a percentage of the theoretical maximum possible heat rejection at the current wet-bulb temperature. The denominator, Range plus Approach, equals the total available temperature difference from the hot water inlet down to the wet-bulb temperature, which is the maximum possible range if the tower could cool the water all the way to the wet-bulb limit. Effectiveness is a dimensionless percentage that allows direct comparison of tower performance across different operating conditions, seasons, and even different towers, because it normalizes for both the inlet temperature and the atmospheric conditions.
Capability Ratio
The ratio of the measured and corrected heat rejection to the design heat rejection, both expressed at the design wet-bulb, design water flow, and design heat load conditions. A capability ratio of 1.00 means the tower meets its design guarantee exactly. Values above 1.00 indicate the tower exceeds design, while values below 1.00 indicate degradation. The correction from test conditions to design conditions uses the tower's performance curves to account for differences in wet-bulb temperature, water flow rate, and heat load between the test and design points. The capability ratio is the final output of a CTI performance test and the metric used for acceptance or rejection of a new tower installation.
How Often Should You Test and What Level of Rigor Is Needed
Not every performance assessment requires a full CTI ATC-105 test with calibrated instruments and formal reporting. Different situations call for different levels of testing rigor, from continuous automated monitoring to periodic formal tests. The framework below defines four testing levels, each appropriate for a different purpose, and specifies when each level should be applied. The key insight is that continuous low-rigor monitoring is more valuable for detecting degradation than infrequent high-rigor testing, because degradation is a gradual process that can be detected early through trend analysis but may be missed entirely if the only test is performed annually and happens to fall on a day when weather conditions mask the degradation.
Continuous Automated Monitoring
Always active, every operating hourUses permanently installed temperature sensors on the hot and cold water lines and a weather station measuring wet-bulb temperature. Calculates range, approach, and effectiveness at intervals of 5 to 15 minutes and stores the results for trending. Does not meet CTI accuracy requirements for formal testing because the instruments are not calibrated to CTI standards, but provides excellent degradation detection through long-term trend analysis. The primary value is detecting gradual performance changes that occur too slowly to notice from day-to-day observation but compound into significant capacity loss over months and years. This is the foundational monitoring layer that every facility with a cooling tower should have in place.
Monthly Performance Benchmark
Once per month, at consistent conditionsA structured data collection effort performed monthly using the plant's installed instrumentation, but with a more rigorous procedure than continuous monitoring. Includes verification that all sensors are reading within expected ranges, confirmation that the tower is operating at or near design water flow, and documentation of the current operating point including fan speed, cell configuration, and heat load. The monthly benchmark is compared against the previous month and against the design point to create a performance trend that can be reviewed in monthly operations meetings. This level fills the gap between continuous monitoring, which may have data quality issues that go unnoticed, and formal CTI testing, which is too expensive to perform monthly.
Semi-Annual Informal Test
Twice per year, spring and fallA more rigorous data collection effort using temporarily installed calibrated instruments, typically ultrasonic flow meters and precision temperature sensors, to achieve accuracy close to CTI requirements. The spring test establishes the baseline performance before summer peak loading, and the fall test measures the cumulative degradation after the summer operating season. The semi-annual test does not follow the full CTI ATC-105 protocol, which would require 30 minutes of validated steady-state data, but uses a shortened 15-minute data collection period with the same instrument accuracy requirements. The results are corrected to design conditions using the manufacturer's curves and compared to the previous semi-annual test to quantify the rate of performance degradation.
Annual Formal CTI Test
Once per year, or after major maintenanceA full CTI ATC-105 compliant test with NIST-traceable calibrated instruments, 30 minutes of validated steady-state data, heat balance closure within 5%, and correction to design conditions using the manufacturer's certified performance curves. This is the only test level that produces a legally defensible capability ratio suitable for contract disputes, warranty claims, or regulatory compliance documentation. The annual CTI test also serves as the calibration reference point for the continuous monitoring system, establishing the offset between the permanently installed sensors and the calibrated reference instruments so that the continuous data can be adjusted to reflect true performance.
Cooling Tower Performance Testing — Common Questions
What is the difference between range and approach and which one matters more for detecting tower problems?
Range is the temperature drop across the tower, while approach is the gap between the cold water outlet and the wet-bulb temperature. For detecting tower degradation, approach is significantly more useful because it normalizes for weather conditions. Range varies with the heat load from the process, so a change in range might indicate that the process load changed, not that the tower changed. Approach, by contrast, is primarily a function of tower condition at a given wet-bulb temperature. If the approach at 78 degree wet-bulb was 7 degrees last year and is 11 degrees this year at the same flow rate and wet-bulb, the tower has degraded regardless of what the process heat load is doing. The most effective monitoring strategy tracks approach normalized to wet-bulb as the primary degradation indicator and uses range to confirm that the heat load is within the expected operating envelope. Book a Demo to see how iFactory uses wet-bulb-normalized approach as the primary degradation metric.
Can a cooling tower be tested while the plant is operating or does it require a shutdown?
A cooling tower performance test is conducted while the tower is in normal operation at or near its design conditions. The entire purpose of the test is to measure how the tower performs under the actual heat load, water flow, and atmospheric conditions it experiences in service. Shutting down the process to test the tower would produce a test at zero or near-zero heat load, which provides no useful information about the tower's ability to reject heat. The only preparation required is to stabilize the operating conditions at the desired test point, which may involve adjusting water flow rates or fan speeds to match the design conditions as closely as possible. The CTI ATC-105 standard specifically addresses how to handle situations where the plant cannot be adjusted to exact design conditions, providing correction methodologies that allow valid testing even when the operating point differs from the design point.
How much does a formal CTI performance test cost and is it worth the investment?
A formal CTI ATC-105 performance test typically costs between eight thousand and twenty thousand dollars depending on the tower size, number of cells, geographic location, and whether the test is being performed for acceptance of a new tower or for evaluation of an existing installation. The test requires specialized instrumentation, a certified testing engineer, and typically one to two days of field work plus the analysis and reporting effort. Whether this investment is justified depends on the consequences of tower underperformance. For a tower serving a 500-ton chiller plant, a 4-degree increase in approach above design can increase chiller energy consumption by 8% to 10%, which at typical commercial electricity rates translates to fifteen thousand to forty thousand dollars per year in excess energy cost. In that context, an eight-thousand-dollar test that identifies a correctable problem is paid back in months, not years. The iFactory Support team can help you estimate the cost of tower degradation at your facility to build the business case for formal testing.
What is the minimum accuracy required for temperature measurements in a CTI test?
CTI ATC-105 requires that temperature sensors used for the hot water inlet, cold water outlet, and ambient wet-bulb measurements have an accuracy of plus or minus 0.2 degrees Fahrenheit or better, with calibration certificates traceable to NIST standards. This accuracy requirement exists because the approach value, which is the primary performance metric, is the difference between two measured temperatures. If each temperature measurement has an uncertainty of 0.2 degrees, the approach calculation has a combined uncertainty of approximately 0.28 degrees. For a tower with a design approach of 7 degrees, this represents a 4% measurement uncertainty, which is acceptable for performance assessment. Using standard plant instrumentation with 1 degree accuracy would produce an approach uncertainty of 1.4 degrees, or 20% of the design approach, which makes the test result too uncertain to support any meaningful performance conclusion.
How do I know if my tower's poor performance is caused by the tower itself or by problems in the connected systems?
Distinguishing between tower-caused and system-caused performance changes requires measuring and analyzing the complete cooling water circuit, not just the tower in isolation. If the hot water inlet temperature is higher than expected, the excess heat is coming from the process or chiller plant, which means the heat exchangers may be fouled, the chiller condenser may be dirty, or the process load may have increased above design. If the hot water temperature is normal but the cold water temperature is higher than expected, the tower itself is underperforming. If both temperatures are higher than expected by roughly the same amount, the range may be normal but the absolute cold water temperature is too high, which could indicate that the tower is performing adequately for the heat load it is receiving but the heat load itself has increased. iFactory captures data from the tower, the pumps, the heat exchangers, and the chillers in a single platform, enabling your team to trace performance changes to their root cause regardless of where in the circuit the problem originates. Book a Demo to see how iFactory provides circuit-level performance diagnostics.
Stop Accepting Higher Approach Values as Normal Seasonal Variation.
Talk to iFactory about building a cooling tower performance program where every range and approach measurement is normalized to wet-bulb conditions, trended over time, and compared to design with automatic degradation alerts.