A gas turbine that ran at 38.2% efficiency at commissioning does not stay at 38.2% forever — compressor fouling, blade erosion, seal wear, and heat exchanger scaling erode output year over year, often invisibly, until the plant is burning noticeably more fuel per megawatt without anyone flagging why. Reliability engineers who rely on annual performance tests alone are working from stale snapshots, missing the slow-motion degradation that happens between test dates. AI-driven performance testing and baseline degradation tracking closes that gap by continuously comparing live unit performance against a validated baseline, flagging the exact point where a turbine, boiler, or condenser crosses from normal wear into a correctable loss. Book a Demo to see how continuous baseline tracking replaces once-a-year test reports with a live degradation record.
Track Every Percentage Point of Efficiency Loss, Automatically
iFactory establishes ASME PTC-aligned performance baselines for turbines, boilers, and auxiliaries, then tracks live degradation against them — no manual test scheduling, no spreadsheet trending.
Why Annual Performance Testing Misses Real-World Degradation
Traditional performance testing programs run one or two formal ASME PTC tests per year per major asset — a turbine heat rate test, a boiler efficiency test, a condenser performance test. Between those dates, degradation accumulates silently. A compressor losing 0.4% efficiency per month from fouling will have lost nearly 5% by the time the next scheduled test catches it, and by then the fuel cost impact has already been absorbed for months without triggering any corrective action.
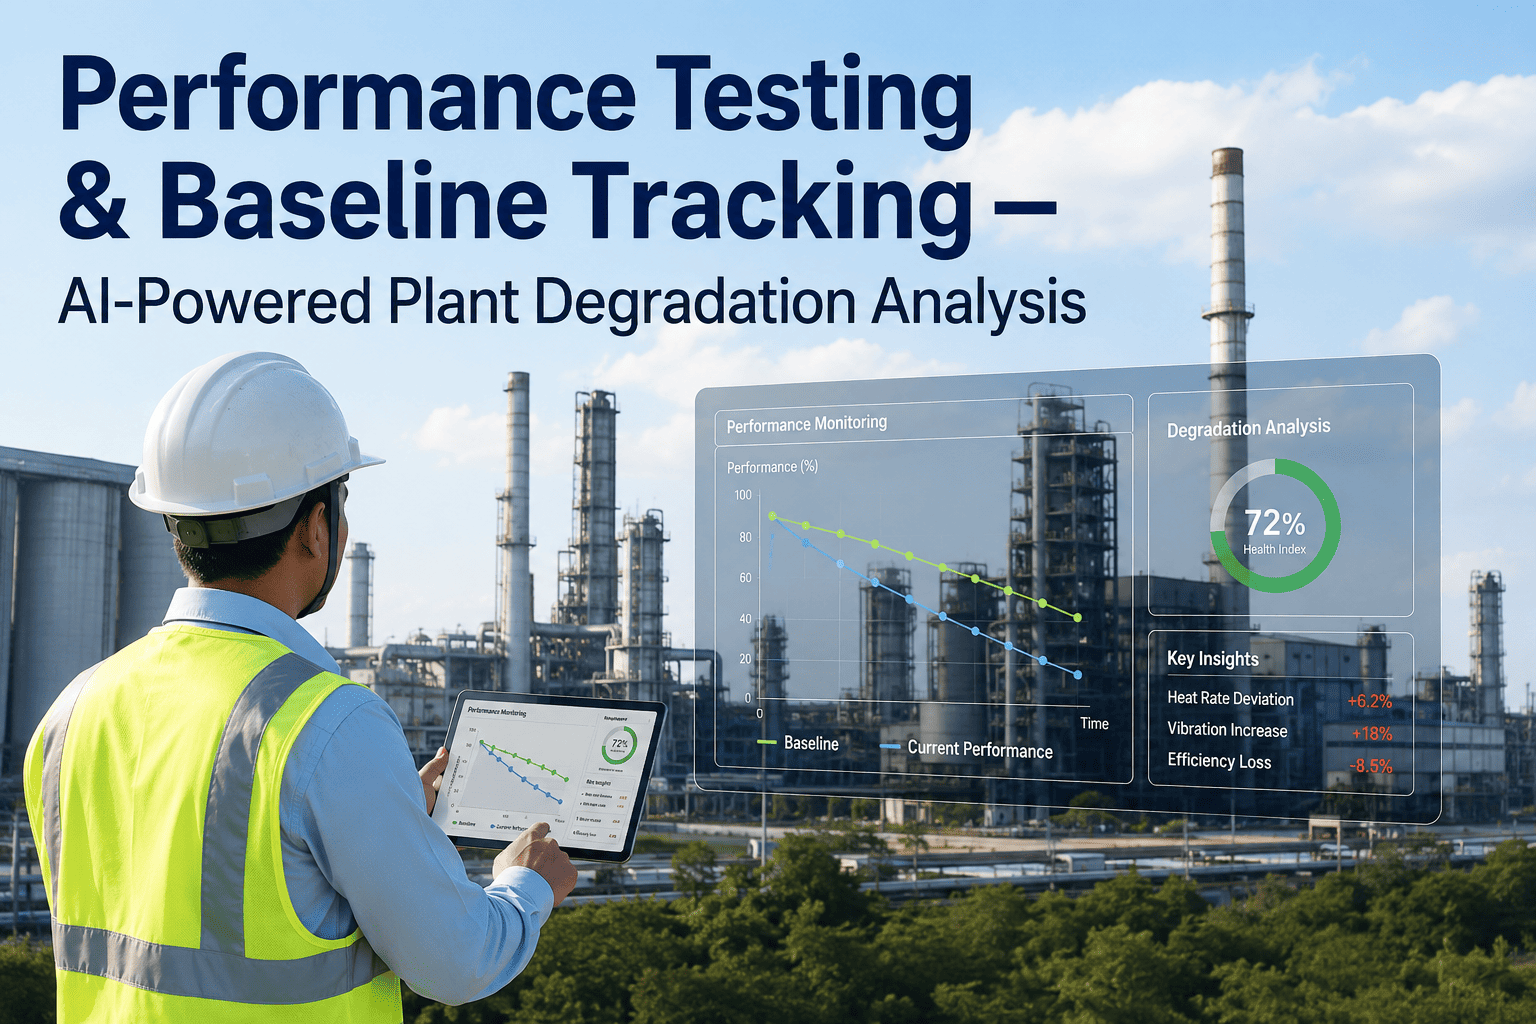
Continuous baseline tracking solves this by treating the commissioning test — or the most recent validated overhaul test — as a living reference curve rather than a static report. Every operating hour of live data is corrected to standard reference conditions and compared against that curve, so degradation is visible as a trend line within days of onset rather than months after the fact. Reliability teams using continuous degradation tracking report catching correctable losses an average of 4-6 months earlier than annual test cycles allow.
A 1% unrecovered heat rate degradation on a 300 MW combined cycle unit typically costs $400,000-$600,000 per year in additional fuel burn — and most of that loss accumulates gradually enough to go unnoticed without continuous baseline comparison.
Efficiency Degradation Over Time: What the Curve Actually Looks Like
Degradation is rarely linear and rarely uniform across components. Compressor fouling accelerates seasonally, blade erosion tracks with fuel quality and start-cycle count, and condenser fouling follows cooling water chemistry. The illustration below shows a typical combined-cycle unit's cumulative efficiency loss curve relative to its commissioning baseline across a maintenance interval.
The steepening slope after year three is where continuous tracking pays for itself: it is the point at which correctable losses (compressor washing, seal replacement, condenser cleaning) begin outweighing normal irrecoverable wear, and where a live baseline comparison tells reliability engineers precisely which component is driving the increase.
Six Components of AI-Driven Baseline Degradation Tracking
ASME PTC-Aligned Baseline Establishment
Commissioning or post-overhaul test data is corrected to standard reference conditions per PTC 6 (turbines), PTC 4 (boilers), and PTC 12 (condensers), forming the reference curve every future comparison is measured against.
Standards-BasedContinuous Correction to Reference Conditions
Live ambient temperature, humidity, barometric pressure, and load are used to correct real-time readings back to baseline test conditions, so seasonal weather swings never get mistaken for real degradation.
Weather-CorrectedComponent-Level Degradation Isolation
Rather than a single plant-wide heat rate number, degradation is decomposed by component — compressor, turbine section, condenser, feedwater heaters — so the specific cause of a loss is identifiable, not just its total magnitude.
Root-Cause ReadyAutomated Test Window Detection
The system identifies stable, steady-state operating windows automatically and runs a virtual performance test against them, removing the need to schedule and staff a formal test for every trend update.
Continuous TestingDegradation Threshold Alerting
Each component carries a configurable correctable-loss threshold. When cumulative degradation crosses it, an alert is routed to the reliability team with the estimated fuel cost impact attached.
Threshold-BasedMaintenance-Linked Recovery Verification
After a compressor wash, seal replacement, or condenser clean, the system re-baselines against the same conditions to quantify exactly how much efficiency was recovered — turning maintenance into a measured investment.
ROI VerificationBaseline vs. Current Performance: Sample Tracking Record
The table below illustrates the kind of parameter-level comparison a continuous baseline system maintains for a single combined-cycle unit, flagging which readings have crossed the correctable-loss action threshold and warrant a maintenance work order.
| Parameter | Baseline Value | Current Value | Degradation | Action Threshold | Status |
|---|---|---|---|---|---|
| Compressor Efficiency | 86.4% | 83.1% | 3.3 pts | 3.0 pts | Exceeded — Wash Recommended |
| Turbine Section Efficiency | 91.2% | 90.4% | 0.8 pts | 2.0 pts | Within Range |
| Heat Rate (Corrected) | 6,850 Btu/kWh | 7,040 Btu/kWh | 2.8% | 2.5% | Exceeded — Investigate |
| Condenser Backpressure | 2.1 in HgA | 2.4 in HgA | 0.3 in HgA | 0.35 in HgA | Approaching Threshold |
| HRSG Effectiveness | 94.8% | 93.9% | 0.9 pts | 1.5 pts | Within Range |
How AI Isolates the Cause of a Degradation Trend
A rising heat rate could originate in the compressor, the turbine hot section, the HRSG, or the condenser — and guessing wrong sends a maintenance crew to the wrong asset. iFactory's degradation engine uses a component-decomposition model that attributes each fraction of total plant-level loss back to its physical source, so the work order that gets generated targets the actual cause, not just the symptom.
Multi-Variable Correction Modeling
Ambient conditions, fuel composition, and load level are regressed out of every reading before comparison, isolating the portion of change that is genuine mechanical degradation.
- ISO/PTC correction factors applied live
- Fuel heating value auto-adjusted
- Part-load curve normalization
Component Attribution Engine
Thermodynamic component models split total plant degradation into compressor, turbine, HRSG, and condenser contributions, ranked by dollar impact.
- Component-level fuel cost weighting
- Cross-checked against vibration and temperature spreads
- Ranked corrective action list generated
Recovery Confirmation Testing
Following a cleaning or repair, the system automatically schedules a validation window and confirms the exact recovered percentage against the pre-maintenance baseline.
- Before/after comparison auto-generated
- Fuel savings dollar figure attached
- Feeds directly into maintenance ROI reporting
See Your Own Unit's Degradation Curve
Bring your last commissioning or overhaul test report and iFactory will show you what continuous baseline tracking would have detected since — and what it would have saved.
Baseline Tracking ROI: Where the Savings Actually Come From
Earlier Compressor Wash Decisions
Continuous fouling tracking triggers offline or online washes at the optimal point — before the fuel cost of running fouled exceeds the cost of the wash outage itself.
Reduced Formal Test Frequency
Continuous virtual testing reduces dependence on contracted ASME PTC test crews for routine trending, reserving formal tests for warranty and guarantee verification only.
Overhaul Scope Justification
Component-level degradation records give asset managers defensible, quantified evidence for overhaul scope and timing decisions, rather than relying on running hours alone.
Recovered Heat Rate Bidding Advantage
A unit maintained closer to its baseline heat rate holds a competitive dispatch position in merit-order markets, capturing more running hours at better margins.
Building a Reliable Baseline When Historical Test Data Is Incomplete
Not every unit enters a continuous tracking program with a clean commissioning test on file. Older assets often have incomplete instrumentation calibration records, multiple uprates since original commissioning, or performance tests that were never corrected to a consistent reference condition. Rather than treating this as a blocker, a properly designed baseline program constructs a statistically validated reference curve from several months of historical operating data, cross-checked against whatever formal test records do exist and against OEM design curves where available.
This statistical baseline approach is particularly valuable for fleets acquired through mergers or asset transfers, where original commissioning documentation is frequently fragmented across multiple prior owners. Reliability engineers gain a defensible starting point within weeks rather than waiting for the next scheduled formal test cycle, and the baseline is automatically refined as more corrected operating data accumulates. Once established, this reference curve is treated identically to a formal test-derived baseline for all future degradation comparisons, threshold alerting, and recovery verification purposes — ensuring that units with imperfect historical records are not left out of a fleet-wide continuous monitoring program.
Frequently Asked Questions: Performance Testing & Baseline Tracking
Put Every Unit's Degradation Curve on One Dashboard
iFactory's AI-driven performance testing and baseline tracking platform gives reliability engineers a continuously updated, component-level view of degradation across every turbine, boiler, and auxiliary system in the fleet — replacing scattered spreadsheets and once-a-year test reports with a live, defensible performance record. Book a Demo to see your fleet's degradation baseline modeled in a live walkthrough.
Know Exactly Where Every Percentage Point Went.
Continuous baseline comparison, component-level degradation isolation, and recovery verification — built for reliability teams who need answers, not annual reports.