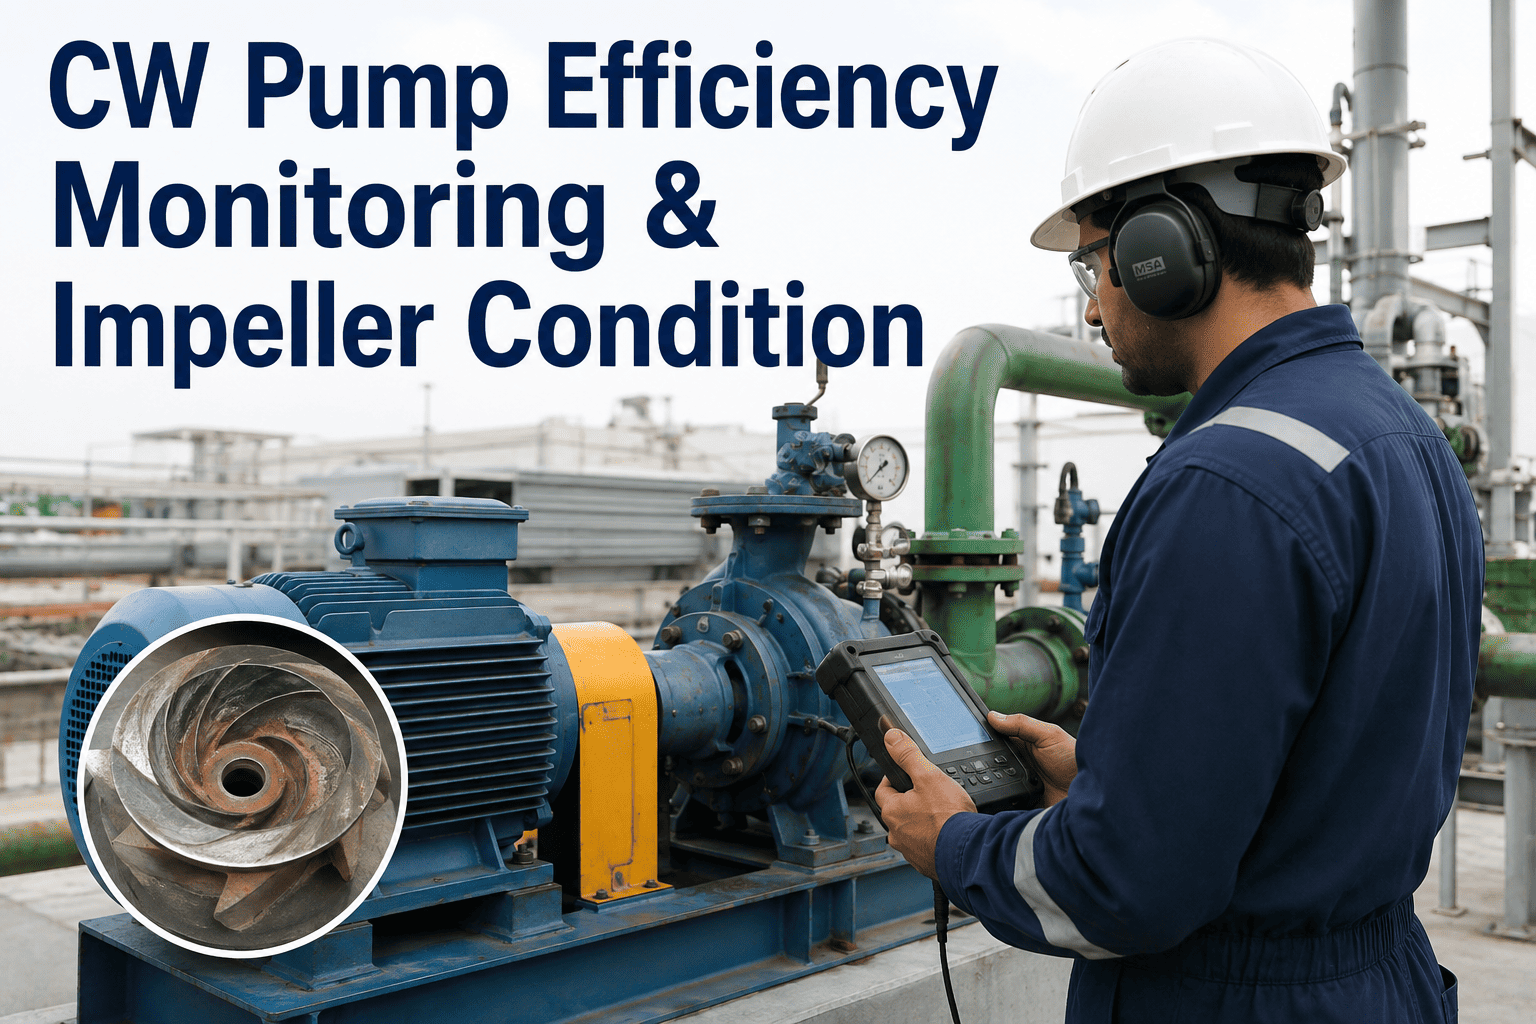
A circulating water pump rarely fails without warning, it just gets quietly worse at its job for months first. Impeller wear from cavitation or abrasive particulate erodes vane surfaces gradually, clearance between the impeller and wear ring opens up, and the pump starts moving less water for the same power draw without tripping any alarm or crossing any obvious threshold. Most plants only catch the decline when a scheduled pump curve test finally puts a number on what operators have suspected for a while, by which point the condenser has likely been running with degraded vacuum for longer than anyone intended. iFactory trends flow, power draw, and head against the original pump curve continuously, so efficiency loss shows up as a flag long before it shows up as a heat rate penalty. You can book a demo to see it running against your own CW system.
Catch a Degrading CW Pump Before It Costs You Vacuum
iFactory compares live flow, power consumption, and head against the pump's original performance curve, turning a slow, invisible efficiency decline into a trend line your team can actually act on before the next outage.
A Few Percent of Pump Efficiency Rarely Trips an Alarm
A circulating water pump losing three or four percent of its original efficiency doesn't look broken to anyone watching a control room screen. Flow is still adequate, the motor isn't overloaded, and condenser vacuum is still within an acceptable band, just not the band it used to be in. That gap between adequate and optimal is exactly where heat rate penalties accumulate quietly, month after month, without ever producing a single alarm that would prompt someone to investigate.
The economics compound faster than most operators expect. A pump moving less water than design at the same power input means the condenser is rejecting heat less effectively, which raises backpressure on the turbine and reduces net output for the same fuel input. On a large unit, even a small vacuum degradation translates into a real and continuous heat rate penalty that dwarfs the eventual cost of catching the impeller wear early and correcting it.
Signals That Show Up Long Before a Curve Test Confirms It
Impeller wear and clearance opening don't happen overnight, and the intermediate signs are usually available in the data long before a formal pump curve test gets scheduled. The challenge is that these signs tend to live in different systems, a vibration reading here, a power trend there, making them easy to miss when nobody is looking at them side by side.
Operators walking the pump deck often pick up on subtle changes before any instrument does, a slightly different sound at the bearing housing or a motor that feels warmer to the hand than it used to at the same load. Logged consistently alongside the flow and power trend, these observations add useful context to a data pattern rather than getting lost as a one-off note in a shift log nobody reviews again.
Continuous Monitoring vs Waiting for the Scheduled Test
The difference between a plant running periodic pump curve tests and one trending flow and power continuously isn't the accuracy of any single measurement, it's how early a real problem gets noticed relative to how far the wear has already progressed.
That timing gap is where most of the avoidable cost sits. A pump caught early with a mild clearance opening often just needs a wear ring replacement during a routine outage window, while the same pump left unmonitored for another year can progress to the point where the impeller itself needs machining or replacement, turning a short job into a longer one that competes for space in the next major outage schedule.
Stop Waiting for the Next Scheduled Curve Test
iFactory tracks flow, power, and head against the original pump curve continuously, flagging degradation while a repair is still simple. Book a demo and see it against your own CW pumps.
Pump Efficiency Isn't Just Measured, It's Defined by Standard
Pump performance testing follows established methods for a reason, comparing results against a common reference is what makes a trend meaningful across years of data rather than a snapshot that only means something in isolation.
Using a consistent reference matters as much when comparing a pump against its own history as when comparing it against a fleet. A test run under one method one year and a different method the next introduces enough variation that a real trend can get masked by measurement inconsistency, which is part of why sticking to a standard test method matters as much for trending purposes as it does for compliance purposes.
What Changes When Pump Data Lives in One Place
A spot test and a continuous trend can technically use the same underlying measurements, but only one of them shows the direction and rate of change that actually predicts when a pump needs attention.
That distinction becomes most valuable during budget and outage planning season, when maintenance leadership has to justify why a particular pump gets a work order this year and another one waits. A documented trend showing a clear, accelerating decline makes that case immediately, while a single recent test result forces the same argument to rest on a comparison against numbers from a year or more ago.
| Factor | Periodic Spot Test | iFactory Continuous Trending |
|---|---|---|
| Data Frequency | One reading every scheduled test interval, typically annually | Continuous comparison against the design curve as conditions change |
| Detection Timing | Degradation confirmed only when the next test happens to catch it | Drift flagged as soon as it appears in the trend, independent of test schedule |
| Root Cause Clarity | A single point in time gives limited insight into what changed and when | Flow and power trends together narrow down likely cause before inspection |
| Outage Planning | Repair scope estimated from the most recent test result alone | Full degradation history available to size the repair scope accurately |
| Fleet Comparison | Comparing pumps across units requires manually compiling separate test sheets | All units visible side by side against their own design curves at once |
Three Root Causes Behind Most Efficiency Loss
Impeller wear isn't the only reason a CW pump loses efficiency, and telling the causes apart matters because the fix, and the urgency, is different for each one.
Distinguishing between these causes from trend data alone isn't always exact, but the pattern of change over time narrows the likely cause enough to point an inspection in the right direction before the pump is even opened up. A sharp efficiency drop coinciding with a known debris event points toward abrasive wear, while a slow, steady decline with no obvious trigger points more toward cavitation or gradual bearing wear.
Teams Who Feel a CW Pump Efficiency Loss First
Cooling water performance touches heat rate, environmental permit compliance, and maintenance planning all at once, which is why pump condition tracking tends to matter to more teams than just the mechanical maintenance group.
Each of these teams tends to discover a CW pump problem from a different angle, a performance engineer sees it first in the heat rate trend, a maintenance planner sees it in a growing repair backlog, and an outage coordinator sees it as a scope decision under time pressure. A shared trend that all three can look at reduces the amount of time spent reconciling different versions of the same underlying story.
Questions Performance and Maintenance Teams Ask First
Give Every CW Pump a Performance Trend That Actually Predicts Wear
iFactory compares flow, power, and head against the original design curve for every pump in your fleet, so efficiency loss gets caught while the fix is still simple. Book a demo and see it running on your own units.