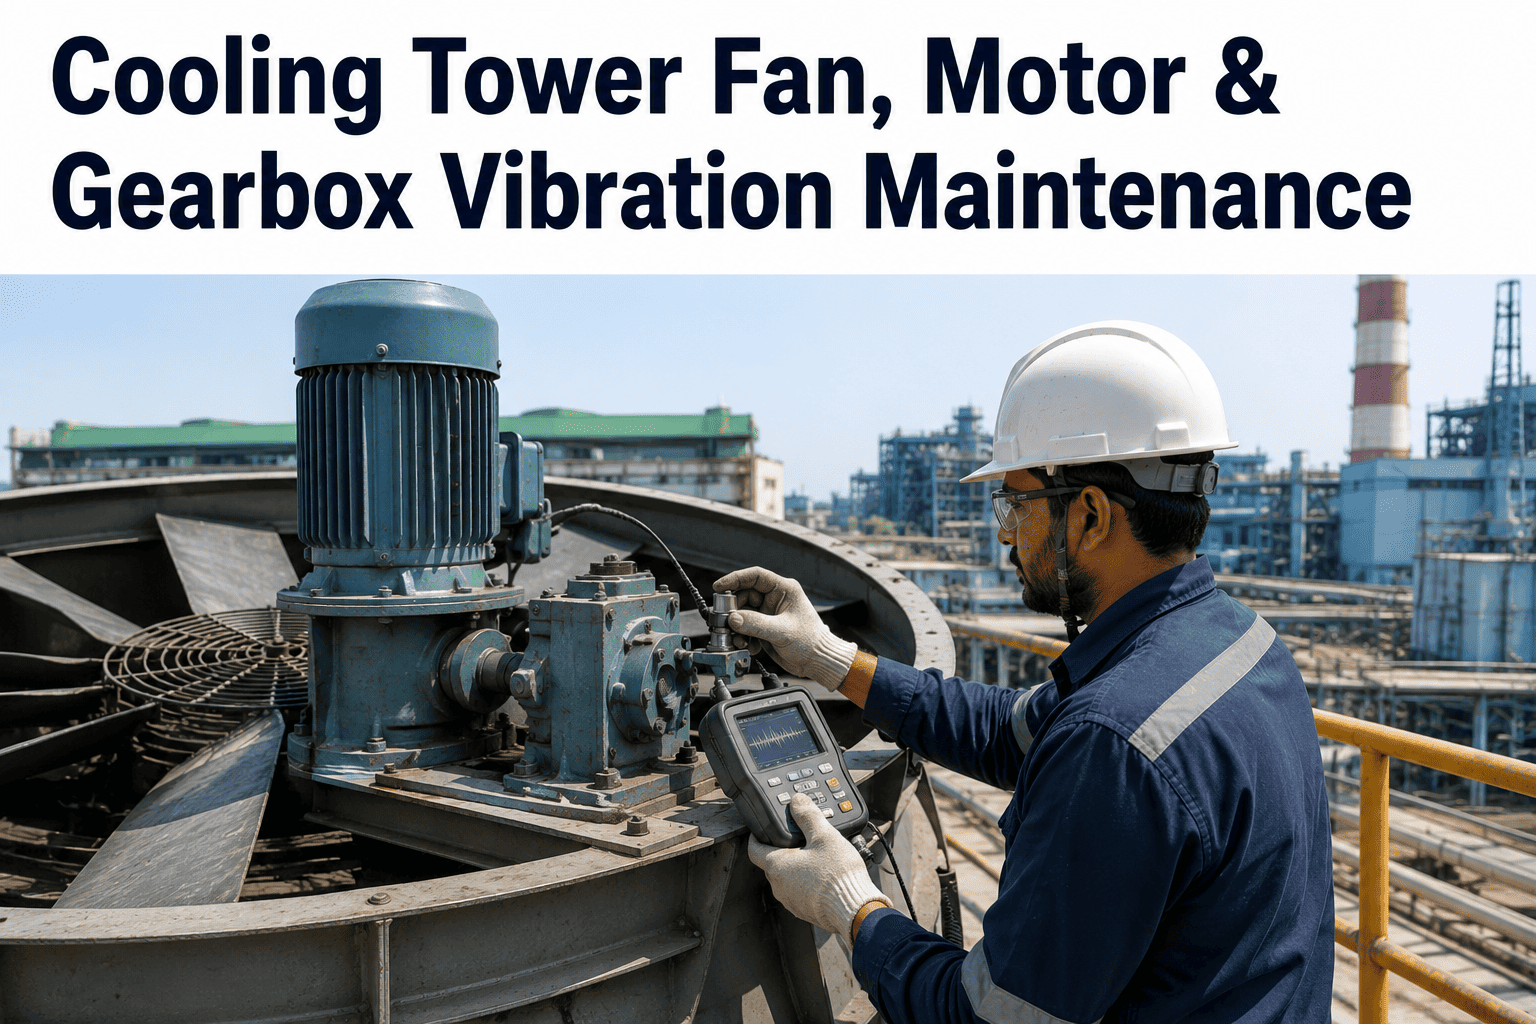
A cooling tower fan is one of the most exposed pieces of rotating equipment in an industrial plant. It sits on top of a wet, warm, corrosive environment; it spins at somewhere between 90 and 300 RPM while a motor spinning at 1,500 to 1,800 RPM pushes it through a gearbox and drive shaft; and it does all of this outdoors, through summer thunderstorms and winter freeze-thaw cycles, often for decades. When a cooling tower fan drivetrain fails, it fails spectacularly — a fan blade coming loose at operating speed can destroy the entire cell, and a seized gearbox can shut down cooling to a critical process for days. Every one of those failures announces itself in advance through vibration, and every experienced reliability engineer knows this. The question is whether the plant is listening. Teams strengthening their cooling-tower reliability program can Book a Demo to see how iFactory turns fan, motor, and gearbox vibration data into scheduled maintenance.
COOLING TOWER RELIABILITY · FAN · MOTOR · GEARBOX · DRIVE SHAFT
Cooling Tower Fan, Motor & Gearbox Vibration Maintenance for Maximum Reliability
A practical maintenance guide to the four rotating components in a cooling tower drivetrain — fan blades, drive shaft, gearbox, and motor — with the vibration signatures, oil analysis limits, and alignment tolerances that separate towers that run for decades from towers that fail before their design life.
$10k – $25k
Per-hour downtime cost for mid-to-large industrial facilities
90 – 300 RPM
Typical cooling tower fan operating speed range
1,500 – 1,800 RPM
Typical cooling tower motor speed feeding the gearbox reduction
The Cooling Tower Drivetrain: Four Rotating Components That Fail Differently
A cooling tower fan does not spin by itself. It sits at the end of a mechanical drivetrain — motor, drive shaft, gearbox reduction, and fan hub with blades — that transforms high-speed electrical rotation into the slow, high-torque air movement the cooling process needs. Each of these four components has its own failure modes, its own maintenance discipline, and its own vibration signature. A reliability program that treats "the cooling tower fan" as one thing misses the specificity that makes early failure detection possible. A program that treats the drivetrain as four instrumented components, each with its own baseline and its own alarm thresholds, catches problems weeks or months before they become outages.
Electric Motor — The Power Source
A TEFC or explosion-proof induction motor typically sized between 30 and 250 HP for commercial and industrial towers, spinning at 1,500 to 1,800 RPM. Exposed to airborne moisture from tower drift, temperature swings, and variable loading as fans cycle with cooling demand.
Common failuresBearing wear, rotor bar defects, winding insulation breakdown from moisture ingress, foundation loosening
Drive Shaft & Couplings — The Torque Path
A composite or metal shaft with flexible couplings on each end, connecting the motor to the gearbox. Often spans several meters horizontally across the fan cell, meaning misalignment builds up as tower structures settle and thermal cycling loosens fasteners.
Common failuresCoupling wear, shaft imbalance, bent shaft from impact, misalignment between motor and gearbox
Reduction Gearbox — The Speed Reducer
A right-angle spiral bevel or spiral bevel-helical gear reducer that takes 1,500 to 1,800 RPM motor input and delivers 90 to 300 RPM to the fan hub. The most maintenance-intensive component in the drivetrain — oil-lubricated, thermally loaded, and continuously exposed to fan-induced dynamic forces.
Common failuresGear tooth wear or spalling, bearing failure, oil contamination, seal leaks, thermal degradation of oil
Fan Assembly — The Air Mover
A multi-blade FRP or aluminum fan of 6 to 40 feet diameter mounted on the gearbox output shaft, with individual blade pitch adjusted at commissioning to deliver design airflow. The largest rotating mass in the tower and the primary source of imbalance-driven vibration.
Common failuresBlade cracking or breakage, blade pitch drift, hub loosening, mud or debris accumulation causing imbalance, corrosion of metal blades
The Vibration Frequency Signatures: What Each Fault Sounds Like
Vibration monitoring on cooling tower drivetrains works because every mechanical fault produces energy at a specific frequency — a frequency that a well-placed accelerometer picks up and a spectrum analyzer separates from the background. Reading a vibration spectrum is not magic; it is knowing which frequency to look at, and knowing what a rising peak at that frequency means for a specific component. The reference table below is the working knowledge that separates a reliability engineer who "checks vibration" from one who diagnoses failures before they happen.
| Fault Type |
Frequency Signature |
Component |
What It Tells You |
| Mass Imbalance |
1× running speed |
Fan, motor, shaft |
Uneven mass distribution — blade damage, debris, or drift in pitch |
| Shaft Misalignment |
1× and 2× running speed, high axial vibration |
Coupling between motor and gearbox |
Motor-to-gearbox alignment has drifted from installed tolerance |
| Mechanical Looseness |
Harmonics of running speed, 1× through 10× |
Foundation, mounting bolts, bearing housings |
Fasteners loosening from vibration itself — a self-accelerating problem |
| Bearing Wear (Outer Race) |
BPFO — bearing outer race fault frequency |
Motor and gearbox bearings |
Specific inner or outer race defect, not just generic bearing noise |
| Bearing Wear (Inner Race) |
BPFI — bearing inner race fault frequency |
Motor and gearbox bearings |
Progressing bearing damage on rotating race, faster deterioration curve |
| Gear Mesh Fault |
Gear mesh frequency (teeth × running speed) plus sidebands |
Gearbox internal gearing |
Gear tooth wear, spalling, or misalignment between mating gears |
| Rotor Bar Defect (Motor) |
Sidebands around 1× at pole pass frequency |
Motor rotor |
Broken or cracked rotor bar, precursor to major motor failure |
| Blade Pass Frequency |
Number of blades × fan running speed |
Fan aerodynamic interaction |
Elevated levels indicate blade damage, uneven pitch, or structural resonance |
The value of this table is not in memorizing it — it is in understanding that vibration is a diagnostic tool, not just an alarm. A rising overall vibration level tells you something is wrong. A rising peak at gear mesh frequency tells you the gearbox needs attention. A rising sideband around 1× at pole-pass frequency tells you the motor rotor needs attention. The specificity is what turns a warning into a work order. When continuous vibration monitoring feeds a platform that automatically extracts these frequencies from the spectrum and correlates them to the specific component at fault, the diagnostic work moves from expert-driven manual analysis to systematic, automated fault identification across every tower in the fleet.
Gearbox Oil Analysis: The Second Diagnostic Channel
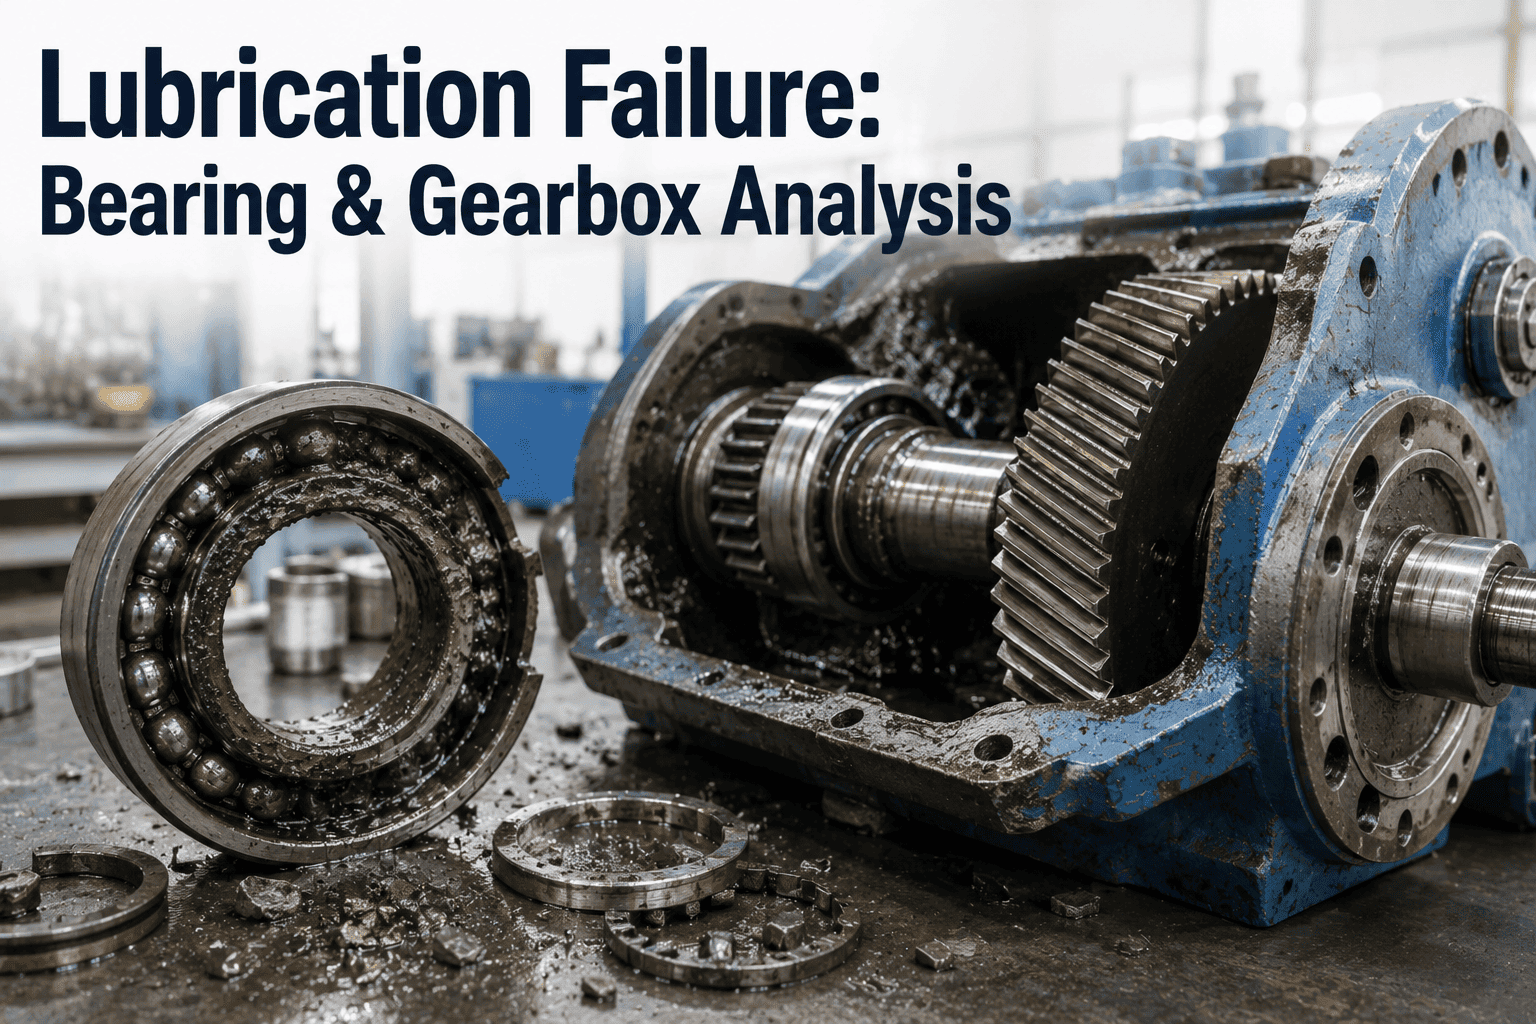
Vibration monitoring catches most cooling tower gearbox faults, but not all of them, and not always early enough. Oil analysis is the complementary diagnostic channel that catches what vibration misses — internal wear that is progressing slowly enough to stay below vibration thresholds, oil chemistry degradation, and contamination that will cause future failures if not addressed. A mature cooling tower reliability program runs both channels in parallel because they detect different things and their combined coverage is far better than either alone.
What Oil Analysis Actually Measures
Wear Metals
Iron, copper, tin, lead, and other metals in parts per million indicate which internal components are wearing — iron from gears and shafts, copper from bronze bushings, tin from bearing overlays
Contamination
Water content (Karl Fischer titration), silica from airborne dust, and coolant leakage all indicate ingress paths that need sealing before they cause secondary failures
Oil Chemistry
Viscosity, total acid number, additive depletion, and oxidation indicate whether the oil itself is still fit for service or approaching a change-out point
Particle Count
ISO cleanliness code showing the concentration of particles at multiple size thresholds — a rising particle count precedes many gearbox failures
Ferrography
Microscopic examination of wear particle morphology — cutting wear, sliding wear, fatigue wear each look different and indicate different failure mechanisms
Cooling Tower Gearbox Oil Sampling Best Practices
Frequency
Quarterly sampling on continuously operating towers, monthly during commissioning or when trending problems, always before and after oil changes for verification
Sampling Method
Sample from a mid-oil-level port with the gearbox at operating temperature, using dedicated clean sample bottles and a purge protocol to avoid cross-contamination
Trending
Compare each sample against baseline for the specific gearbox and against fleet averages for the same gearbox model — the trend matters more than any single reading
Response Thresholds
Establish caution and action thresholds for each parameter tied to the specific OEM guidance and the gearbox history rather than generic industry values
Correlation
Cross-reference oil analysis results with vibration data — rising wear metals plus rising bearing frequencies is a stronger indicator than either alone
Motor Bearing Monitoring: What Kills Cooling Tower Motors First
Cooling tower motors fail in a specific pattern that reliability engineers have documented across decades of teardown data. Bearing failures dominate — accounting for the majority of motor replacements — followed by rotor issues, winding insulation degradation from moisture, and foundation looseness. Each of these has a monitoring approach that catches it before it becomes an outage, and the practical work of a cooling tower motor reliability program is executing those monitoring approaches consistently across every motor in the fleet.
1
Bearing Wear (Dominant Failure Mode)
Cooling tower motor bearings degrade from moisture ingress, contamination, inadequate lubrication, and the vibration coming back through the drivetrain from the fan side. Continuous vibration monitoring with envelope demodulation or bearing-specific enveloping detects early-stage bearing damage months before the bearing fails audibly or thermally.
2
Rotor Bar Defects
Broken or cracked rotor bars produce sideband vibrations around 1× running speed at the pole-pass frequency. Motor current signature analysis complements vibration monitoring by detecting the electrical signature of rotor faults, often with earlier warning than the mechanical signature alone provides.
3
Winding Insulation Degradation
The cooling tower environment — humid, sometimes with chemical treatment drift carrying into the motor cooling air — is particularly hard on winding insulation. Periodic insulation resistance testing, polarization index measurement, and infrared thermography of the motor exterior catch degradation before winding failure.
4
Foundation & Mounting Looseness
Vibration itself loosens the fasteners that hold the motor to its base and the base to the tower structure. Once looseness starts, it accelerates — the loose motor vibrates more, which loosens more fasteners. Vibration harmonics from 1× through 10× running speed indicate looseness, and physical inspection of anchor bolts should be routine.
MATURITY LEVEL L4 & L5 · CONTINUOUS · AI-DRIVEN
Move Your Cooling Tower Reliability Program From Route-Based to Continuous
iFactory delivers the platform layer that turns wireless vibration transmitters, oil analysis results, and motor current signature data into automated fault diagnosis, prioritized work orders, and fleet-wide reliability benchmarking.
The Alignment Discipline: Where Most Drivetrain Life Is Won or Lost
Drive shaft alignment between the motor and gearbox is the single mechanical discipline that most reliably determines whether a cooling tower drivetrain reaches its design life or fails halfway there. Misalignment does not just create vibration — it destroys couplings, wears bearings unevenly, generates gearbox seal failures, and accelerates every other wear mechanism in the drivetrain. Precision laser alignment at commissioning and after any component change, followed by periodic alignment checks as the tower structure settles and thermally cycles, is the discipline that pays back over the entire operating life.
STANDARD
Laser Alignment at Commissioning
Precision laser alignment between motor and gearbox during initial installation establishes the baseline. Cold alignment must account for thermal growth to reach acceptable running alignment — this is where OEM manuals and alignment specialists earn their fees, and where cutting the corner produces problems that surface months later.
REALITY
Structural Settling & Thermal Drift
Cooling tower structures settle over the first several months of operation. Wooden or FRP support structures move with humidity and thermal cycling. Steel frames flex under wind and load. All of this moves the motor and gearbox mounting points relative to each other, meaning the alignment established at commissioning is not the alignment operating twelve months later.
CHECK
Periodic Alignment Verification
Vibration monitoring catches most alignment drift via the characteristic 1× and 2× signature with high axial component. When that signature appears, a laser alignment check on the next available shutdown is the response. Some programs schedule preventive alignment checks annually or biennially regardless of vibration data.
FIX
Balancing the Fan Assembly
Dynamic balancing of the fan assembly complements alignment on the other side of the gearbox. Blade damage, debris accumulation, or pitch drift creates imbalance that shows as 1× vibration and stresses the entire drivetrain. In-place dynamic balancing during a short outage window restores the fan to its original balance without full disassembly.
The Predictive Maintenance Maturity Ladder for Cooling Towers
Cooling tower reliability programs sit on a maturity spectrum. At one end are plants running to failure — reacting to fan shutdowns and unplanned outages. At the other end are plants running fully instrumented, condition-based programs where every fan drivetrain is continuously monitored and maintenance is triggered by condition data rather than calendar. Understanding where a specific plant sits on this ladder is the first step in mapping the path to the next level. Each rung delivers real value; the goal is not to jump to the top rung but to identify the next rung and take it.
L5
Predictive & Prescriptive — AI Fault Diagnosis
Vibration streams processed with automated fault-frequency extraction. AI models classify defects by component and severity. Work orders auto-generated with the specific bearing or gear identified. Oil analysis, motor current signature, and thermal data fused into one asset health picture. Fleet-wide benchmarking across similar towers surfaces best-practice targets.
L4
Condition-Based — Continuous Trending
Wireless vibration transmitters on every motor, gearbox, and fan bearing streaming to a monitoring platform. Continuous overall-vibration and temperature trending with alarm thresholds. Quarterly oil analysis with fleet trending. Maintenance triggered by condition data rather than calendar.
L3
Route-Based Vibration Program
Portable vibration data collector taken on scheduled routes across the tower fleet. Baseline established for each measurement point. Reliability engineer reviews the collected data monthly or quarterly. Oil samples pulled on schedule and sent to lab. Findings drive maintenance planning.
L2
Preventive — Scheduled Maintenance
Calendar-based PM tasks — lubrication, visual inspection, alignment checks, oil changes on OEM interval. Vibration switches installed as protection to trip the fan on gross vibration. No continuous condition data feeding the maintenance schedule.
L1
Reactive — Run to Failure
Maintenance triggered by fan shutdown, unusual noise reports from operators, or visible mechanical damage. Emergency repair mode dominates. High parts inventory carried for common failures. Every failure is a surprise, and downtime cost dwarfs the maintenance budget saved.
The economics of climbing this ladder are well documented in industrial reliability literature. The move from L1 to L2 alone typically pays back in avoided catastrophic failures within the first year. The move from L2 to L3 pays back in reduced unnecessary maintenance and extended component life. The moves from L3 to L4 and L4 to L5 shift the value from labor efficiency to full asset optimization — same reliability team covering more towers, faster diagnosis when problems occur, and the ability to run components closer to their true condition-based limit rather than to conservative calendar intervals.
A Scenario: The Gearbox That Announced Itself Six Weeks Early
Consider a process plant running eight cooling tower cells feeding a critical heat rejection load. Each cell has a 150 HP motor driving a right-angle gearbox that turns a 24-foot fan at 145 RPM. The plant has recently moved from route-based vibration monitoring to continuous wireless transmitters on every motor and gearbox — a step from L3 to L4 on the maturity ladder. Six weeks after commissioning the new monitoring, the platform flags a rising trend on cell 4's gearbox bearing, specifically at the outer-race defect frequency for that bearing model. Overall vibration is still well below the traditional alarm threshold; only the frequency-specific trending has surfaced the developing fault.
The reliability engineer pulls an oil sample the same week. The oil analysis lab reports iron content at 32 ppm, up from a baseline of 8 ppm three months earlier, with wear particle morphology showing cutting-wear signatures characteristic of bearing spalling. The vibration signal and the oil signal agree — the gearbox output-shaft bearing is degrading. Planning has now three to four weeks of runway, in the plant's operating window, to source the replacement bearing, arrange the crane and rigging, and schedule the outage during a low-cooling-demand period. The bearing is replaced during a planned four-hour outage. Post-replacement vibration and oil analysis return to baseline.
Compare that to what would have happened at L2 maturity. The bearing would have continued degrading undetected until either the vibration switch tripped the fan or the gearbox seized. Either failure would have been an emergency outage — cell 4 offline for days waiting for parts and rigging, the other seven cells running above design duty to compensate, downstream process risk mounting. The cost of the emergency response, plus the downstream production impact, would dwarf several years of the continuous-monitoring investment. This is not a hypothetical — it is the pattern that every mature reliability program documents repeatedly, and it is the pattern that justifies climbing the maturity ladder one rung at a time.
Frequently Asked Questions
Where should vibration sensors be installed on a cooling tower drivetrain?
The standard practice for gearbox-driven cooling tower fans is to install vibration sensors on both the motor bearings and the gearbox bearing housings — at minimum one sensor per component, often with additional sensors in horizontal, vertical, and axial directions on critical bearings. For belt-driven fans on smaller towers, sensors go on the motor inboard bearing, the fan inboard pillow block bearing, and any intermediary bearings on the fan shaft. OEM manuals specify the exact recommended mounting locations for the specific gearbox and motor models, and following those specifications ensures the sensors pick up the frequencies of interest rather than structural noise from the tower itself. Teams sizing a new instrumentation program can
Book a Demo to review typical mounting patterns.
How often should cooling tower gearbox oil be changed?
Traditional OEM guidance sets oil change intervals at annual or semi-annual for cooling tower gearboxes, but condition-based programs often extend those intervals when oil analysis shows the oil still meets specification. Conversely, oil analysis sometimes indicates a change is needed earlier than the calendar interval — particularly if water contamination or particle count has spiked. The right answer for a specific gearbox depends on the oil grade, the operating conditions, the seal condition, and the analysis trend. Establishing a quarterly oil analysis program and letting the data drive the change interval typically saves oil-change cost and catches problems earlier than either running to a fixed calendar or waiting for visible oil degradation.
Can vibration monitoring be added to an existing cooling tower, or does it require new installation?
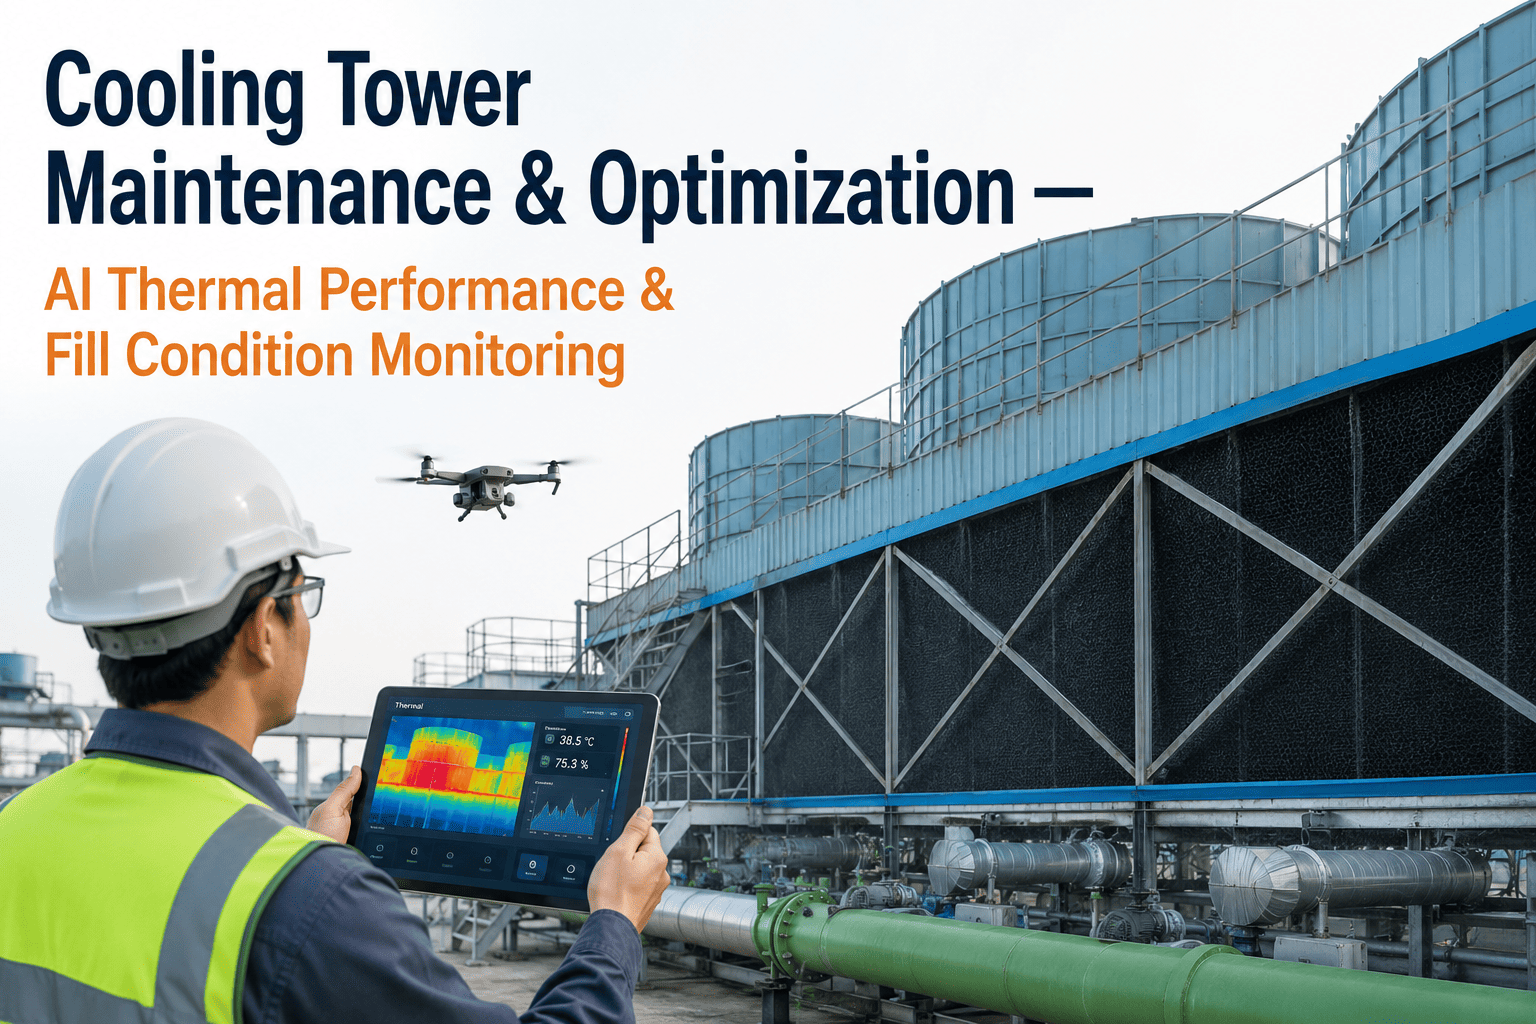
Vibration monitoring can be retrofitted to almost any existing cooling tower fan drivetrain. Wireless vibration transmitters are the dominant retrofit approach — they mount to the motor and gearbox housings with mechanical fasteners or high-strength adhesives, run on internal batteries for years, and communicate to a wireless gateway that feeds the monitoring platform. Wiring back to a control system is not required. For plants moving from L2 to L3 or L4 on the maturity ladder, this typically means instrumentation of an existing fleet without any tower shutdown or major mechanical work. Support engineers at
iFactory Support can advise on retrofit patterns for common cooling tower configurations.
What vibration level is considered "high" on a cooling tower fan drivetrain?
There is no universal threshold — the right alarm levels depend on the specific machinery class, mounting condition, and OEM guidance for the gearbox and motor. ISO 10816 and related standards provide general vibration severity zones for different machine classes that serve as starting points. Cooling tower fan drivetrains typically fall into ISO Class III or IV depending on size, and useful practical thresholds are established relative to the specific unit's baseline rather than to absolute values. A 50% rise above the established baseline is often a caution flag; a doubling of baseline is typically an action trigger. Frequency-specific thresholds on bearing and gear-mesh frequencies matter more than overall vibration levels for early fault detection, which is why spectrum analysis or automated frequency extraction is more valuable than simple overall-vibration trending alone.
Is continuous monitoring worth it for cooling towers, or is periodic route-based sufficient?
The answer depends on the criticality of the towers and the failure history of the specific fleet. For towers supporting critical process loads where downtime carries real production or safety cost — refineries, chemical plants, power stations, data centers — continuous monitoring pays back rapidly and is the industry direction. For less critical towers where a several-day outage is tolerable, route-based programs remain viable. The gap between route-based and continuous is not that route-based is bad; it is that route-based catches problems that developed since the last route, whereas continuous catches problems as they develop. On components like gearbox bearings that can go from "trending" to "failed" in a matter of days once the failure mode accelerates, continuous is materially better than any practical route frequency, and that difference is what typically justifies the investment on critical assets.
COOLING TOWER RELIABILITY · CONTINUOUS · FAULT-SPECIFIC · FLEET-WIDE
Give Every Fan, Motor, and Gearbox in Your Fleet Its Own Health Record
iFactory delivers the reliability platform that unifies vibration streams, oil analysis, motor current signatures, and maintenance history for every cooling tower drivetrain in the plant — with fault-specific alerting, work-order integration, and fleet benchmarking. Book a walkthrough tailored to your fleet size and existing instrumentation.