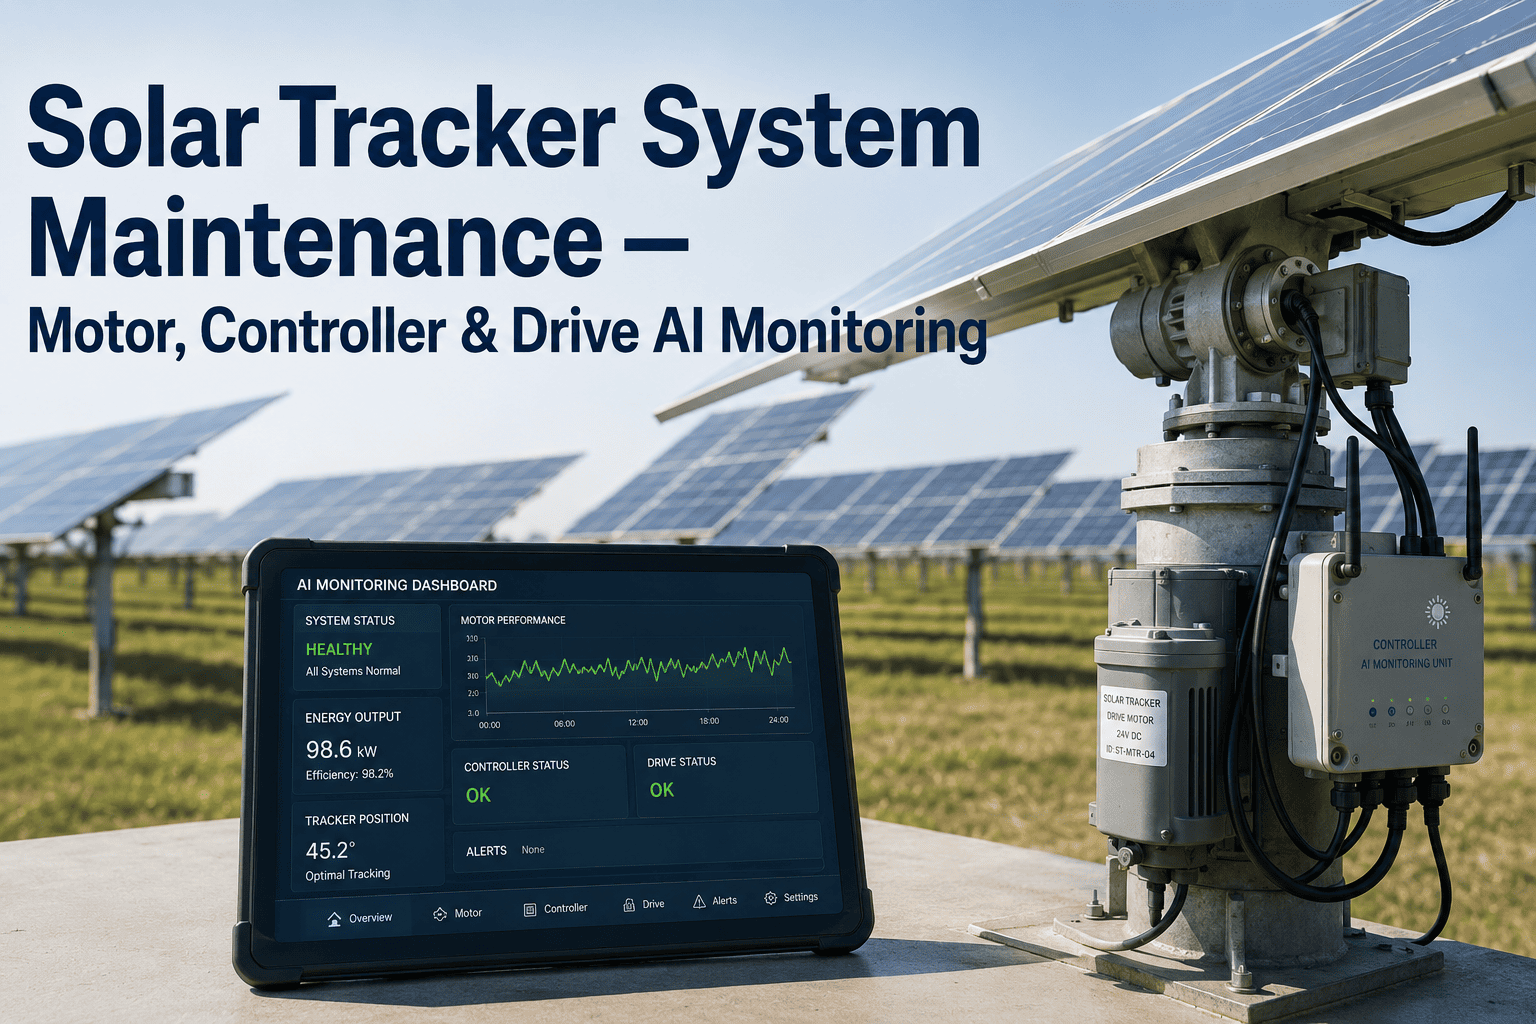
A utility-scale solar farm with 10,000 single-axis trackers has 10,000 motors, 10,000 controllers, and 10,000 slew drive assemblies spread across thousands of acres of remote terrain — and a single tracker row stuck at the wrong angle loses 15 to 35 percent of its daily generation until someone physically drives out, diagnoses the fault, and completes the repair. With the global solar tracker market exceeding $12 billion in 2026 and 96% of new US utility-scale projects deploying trackers, the mechanical reliability of motors, controllers, and drive mechanisms has become the single largest variable in solar plant availability. iFactory's AI platform monitors motor current signatures, controller response patterns, and drive torque trends across your entire tracker fleet from a centralized dashboard — predicting the failures that cause misalignment and generation losses weeks before they strand a tracker row at the wrong angle. Book a demo to see AI-powered tracker fleet monitoring on your plant data.
SOLAR TRACKER AI · MOTOR HEALTH · CONTROLLER DIAGNOSTICS · DRIVE MONITORING
Every Stuck Tracker Row Is a Revenue Leak That Was Detectable Weeks Before It Happened
iFactory's AI monitors motor health, controller logic, and slew drive condition on every tracker in your fleet — detecting the torque increases, current anomalies, and response delays that precede mechanical failure and misalignment losses.
THE SCALE PROBLEM
Why Tracker Maintenance at Utility Scale Breaks Traditional Approaches
A 200 MW solar farm can contain 4,000 to 8,000 individual tracker rows, each with its own motor, controller, gearbox, and bearing assembly. Traditional maintenance approaches — periodic visual inspection and reactive repair — cannot scale to this equipment density across remote sites measured in square miles.
4,000-8,000
Tracker Rows per 200 MW
Each row contains a DC or AC motor, slew drive with worm gear assembly, sealed bearings, a dedicated controller board, inclinometer sensor, and communication link — six potential failure points per tracker that multiply into tens of thousands of components across the plant.
15-35%
Generation Loss per Stuck Row
A tracker row stuck at a flat or incorrect angle loses the energy gain that tracking provides. In high-irradiance sites, this translates to hundreds of dollars per row per day of lost revenue that compounds for every day the fault goes undetected across remote terrain.
$5-10
Per kW/Year O&M Cost
Tracker O&M costs exceed fixed-tilt systems because moving parts require inspection, lubrication, and replacement. AI monitoring converts this cost from reactive truck rolls and diagnostic visits into planned, batched maintenance that reduces per-unit service cost.
COMPONENT ANATOMY
Three Critical Systems in Every Tracker — and How Each One Fails
Every solar tracker is a three-system machine: a motor that provides rotational force, a drive mechanism that converts motor rotation into panel movement, and a controller that tells the motor when and how far to move. AI monitors all three systems simultaneously because a fault in any one of them produces the same outcome — a panel array stuck at the wrong angle, silently losing revenue.
Function
Provides rotational torque to move the tracker row through its daily east-to-west arc and return it to stow position during high-wind events
Failure Modes
Winding insulation breakdown from heat cycling, bearing wear from dust ingress, brush degradation in DC motors, capacitor failure in AC motors, corrosion of connections in humid or coastal environments
AI Detection
Current draw analysis detects increasing motor load from bearing wear or gear resistance. AI compares each motor's current signature against fleet baseline to identify units degrading faster than normal operating wear
Function
Converts high-speed motor rotation into low-speed, high-torque panel movement through a worm gear assembly with sealed slewing ring bearing
Failure Modes
Gear tooth wear increasing backlash and tracking inaccuracy, seal degradation allowing moisture and dust ingress, lubrication breakdown from thermal cycling, bearing fatigue from cyclic loading over thousands of daily rotations
AI Detection
Torque trend analysis detects increasing drive resistance from gear wear or lubrication breakdown. Backlash measurement through position sensor overshoot identifies gearbox wear before it causes tracking inaccuracy
Function
Calculates target angle from solar position algorithm, reads inclinometer feedback, commands motor movement, executes wind-stow commands, and reports status to plant SCADA
Failure Modes
Inclinometer drift causing persistent tracking offset, communication link failure isolating the tracker from central control, firmware faults from corrupted updates, power supply degradation affecting logic reliability, moisture ingress into the enclosure
AI Detection
Response time analysis detects controllers that are slower to execute movement commands. Angle error tracking compares actual vs commanded position across the fleet to identify systematic sensor drift
You Have Thousands of Motors, Gearboxes, and Controllers Spread Across Square Miles — AI Watches Every One of Them From a Single Screen
iFactory's AI platform monitors motor current, drive torque, and controller response on every tracker in your fleet, scoring each unit's health in real time and routing maintenance crews to the rows that need attention before they lose generation.
GENERATION IMPACT
How Tracker Failures Compound Into Plant-Level Revenue Losses
A single stuck tracker row is a minor nuisance. Ten stuck rows are a noticeable production dip. Fifty stuck rows — which can easily accumulate over a few months at a large site without continuous monitoring — represent a material revenue impact that directly reduces the plant's capacity factor and investor returns.
1 Row Stuck
$50-150 per day lost depending on row size and irradiance conditions
10 Rows Stuck
$500-1,500 per day — detectable in daily production reports but often attributed to weather variation
50 Rows Stuck
$2,500-7,500 per day — material production shortfall visible in monthly performance ratio analysis
200+ Rows Stuck
$10,000-30,000+ per day — capacity factor degradation that triggers investor concern and PPA shortfall risk
At a 5,000-tracker site losing an average of 2 trackers per week to undetected failures, the plant accumulates over 100 stuck rows per year — each one leaking revenue from the moment it fails until someone physically finds and fixes it.
AI MONITORING PIPELINE
From Raw Tracker Data to Predictive Maintenance Work Orders in Four Steps
iFactory's AI platform collects operational data from every tracker in the fleet, processes it through machine learning models trained on tracker failure patterns, and outputs prioritized maintenance actions that tell your field crews exactly which rows need attention and what is failing.
1
Fleet Data Ingestion
Motor current, controller commands, angle position, stow response time, and communication status collected from every tracker through existing SCADA and communication infrastructure — no additional sensors required for initial deployment
2
Baseline and Anomaly Detection
AI establishes a per-tracker baseline from commissioning data and fleet-wide norms, then flags deviations in motor current draw, torque demand, position accuracy, response latency, and stow completion time that indicate developing faults
3
Failure Mode Classification
Detected anomalies are classified by failure type — motor degradation, gearbox wear, controller fault, sensor drift, or communication failure — so maintenance crews arrive with the correct diagnosis and replacement parts
4
Prioritized Work Order Generation
Affected trackers are ranked by severity and geographic cluster, generating optimized maintenance routes that batch nearby repairs into single truck rolls — reducing drive time across the site and maximizing the number of repairs per crew visit
FLEET COMPARISON
Reactive Maintenance vs AI-Monitored Fleet — Full Capability Comparison
The table below maps how AI fleet monitoring changes tracker maintenance outcomes across every dimension that determines plant availability, O&M cost, and generation performance.
| O&M Dimension |
Reactive / Calendar Maintenance |
iFactory AI Fleet Monitoring |
| Fault Detection Method |
Visual inspection during periodic site walks or production data review showing generation shortfall |
Continuous motor current, torque, and position analysis detecting faults at first deviation from baseline |
| Time to Detection |
Days to weeks depending on inspection frequency and how visible the stuck tracker is from access roads |
Hours from fault onset; degradation trends detected weeks before total failure occurs |
| Diagnosis Accuracy |
Field technician must diagnose on-site; often requires multiple visits with different parts |
Failure mode classified before dispatch — motor, gearbox, controller, or sensor — with correct parts identified |
| Maintenance Routing |
Technicians drive to individual reported failures one at a time across large sites |
Geographically clustered work orders batch nearby repairs into optimized single-trip routes |
| Stow Reliability Assurance |
Stow capability assumed unless a failure is observed during a wind event |
Stow response time tracked on every tracker; units with degraded stow speed flagged before severe weather |
| Fleet Health Visibility |
Aggregate production data with no per-tracker granularity on component health |
Real-time health score per tracker with motor, drive, and controller sub-scores visible on centralized dashboard |
Stop Driving Across Your Site Looking for Stuck Trackers — Let AI Tell You Exactly Which Rows Need Attention and Why
iFactory's AI platform replaces reactive site walks and production data guesswork with continuous per-tracker health monitoring that detects motor degradation, gearbox wear, controller faults, and sensor drift across your entire fleet from a single dashboard.
WIND STOW PROTECTION
Why Stow Reliability Is the Most Critical Tracker Function AI Must Protect
When wind speeds exceed the tracker's operational threshold, every row must rotate to a flat stow position within seconds to reduce wind loading and prevent structural damage. A tracker that cannot stow — because its motor is failing, its controller has lost communication, or its gearbox is seized — becomes a wind-loaded sail that risks structural failure of the tracker frame and the modules it carries.
Motor Stow Response
AI tracks the time each tracker takes to reach stow position from any angle during routine stow commands. Motors with increasing stow times are flagged for inspection before they become too slow to complete emergency stow during rapid wind onset.
AI Metric
Stow completion time trend per tracker with fleet percentile ranking
Controller Communication
A tracker that has lost communication with the central controller cannot receive the stow command at all. AI monitors communication link health and latency, flagging trackers with intermittent connectivity that may not receive wind-stow signals reliably.
AI Metric
Communication uptime percentage and packet loss rate per controller
Gearbox Torque Reserve
A gearbox with increasing wear requires more torque to move the tracker. If the motor's available torque minus the gearbox resistance drops below the torque required to overcome wind loading during stow, the tracker cannot complete the stow movement.
AI Metric
Available torque margin computed from motor current vs gearbox resistance trend
Structural Load Risk
AI combines weather forecast data with per-tracker stow reliability scores to generate pre-storm alerts identifying specific tracker rows that may not stow successfully, enabling pre-positioning of maintenance crews or manual stow intervention before the wind event arrives.
AI Metric
Pre-storm vulnerability score combining weather and per-tracker stow readiness
MEASURED OUTCOMES
Results From AI-Monitored Solar Tracker Fleets
These figures reflect measured outcomes from utility-scale solar plants where iFactory's AI platform was deployed to monitor tracker motor health, controller performance, and drive mechanism condition across the full tracker fleet.
3.2%
Increase
Annual Energy Yield From Reduced Tracker Downtime
Faster fault detection and predictive repair scheduling reduced the average time each failed tracker spent stuck at the wrong angle, recovering generation that was previously lost during the days or weeks between failure and discovery during periodic inspections.
71%
Reduction
Mean Time From Tracker Failure to Repair Completion
AI-detected faults with pre-classified failure modes enabled maintenance crews to arrive with correct diagnosis and parts, eliminating the diagnostic visit, parts ordering delay, and return visit cycle that reactive maintenance requires.
44%
Fewer
Truck Rolls per Month Through Geographically Batched Repairs
Clustering nearby tracker repairs into optimized maintenance routes reduced the number of individual truck rolls across the site, cutting vehicle costs, fuel consumption, and technician drive time while increasing the number of repairs completed per shift.
100%
Stow Success
During Monitored Wind Events Across AI-Tracked Fleet
Pre-storm vulnerability scoring identified and flagged every tracker with degraded stow capability before severe weather events, enabling preventive intervention that achieved complete stow success across the monitored fleet during all wind events in the tracking period.
FREQUENTLY ASKED QUESTIONS
Questions From Maintenance Managers About AI Tracker Fleet Monitoring
Does AI tracker monitoring require new sensors or hardware on each tracker row, or can it use existing data?
The initial deployment works with data already available from your tracker control system and plant SCADA — motor current, controller commands, angle position feedback, stow response timing, and communication status. Most modern tracker systems from manufacturers like Nextracker, Array Technologies, Soltec, and others already collect this data through their native monitoring platforms. iFactory's AI connects to this existing data stream and applies machine learning analysis on top of it without requiring any physical modification to the tracker hardware. For enhanced monitoring on critical units or older tracker models with limited native instrumentation, optional current transducers or vibration sensors can be added to individual rows.
Book a demo to discuss data availability for your specific tracker make and model.
How does AI differentiate between a tracker fault and a normal tracking deviation caused by cloud cover or terrain shading?
The AI model accounts for expected tracking variations by comparing each tracker's behavior against its geographic neighbors and against the solar position algorithm's target angle for that time of day. Cloud cover affects all trackers in a region simultaneously and does not change the tracker's commanded angle — it only reduces irradiance. A mechanical or electrical fault shows up as a deviation between the controller's commanded angle and the tracker's actual measured angle, or as an anomaly in motor current draw or response time that persists regardless of weather conditions. By comparing fleet-wide patterns with individual tracker signatures, the AI isolates genuine equipment faults from environmental variation with high confidence.
Contact our support team to learn how the model handles your specific site terrain and environmental conditions.
Can the AI platform monitor trackers from multiple manufacturers within the same plant or across a portfolio of sites?
Yes. Many utility-scale solar portfolios contain plants built in different years with different tracker manufacturers, and the AI platform is designed to normalize data across heterogeneous fleets. Each tracker make and model has its own baseline characteristics — motor type, gearbox ratio, controller protocol, and communication method — and the AI learns the normal operating signatures for each variant independently. Fleet-wide analytics then compare health metrics across the entire portfolio regardless of manufacturer, enabling portfolio-level maintenance planning and resource allocation. This multi-manufacturer capability is particularly valuable for asset managers who oversee plants from multiple developers using different tracker technologies.
Book a demo to see cross-manufacturer fleet monitoring on your portfolio data.
How does AI monitoring help reduce the O&M cost per tracker compared to traditional scheduled maintenance?
Traditional tracker maintenance follows a calendar schedule — biannual inspections, annual lubrication, periodic torque checks — regardless of whether individual trackers actually need service. AI monitoring shifts to condition-based maintenance where each tracker receives attention only when its data indicates developing wear or degradation. This eliminates unnecessary preventive maintenance visits to healthy trackers while ensuring that degrading units receive attention before they fail. The geographically clustered work order system further reduces cost by batching nearby repairs into single maintenance trips rather than dispatching individual visits. Combined, these efficiencies typically reduce per-tracker O&M cost by 30-45% compared to calendar-based programs while simultaneously reducing mean time to repair.
Contact our support team to request an O&M cost reduction analysis for your fleet size and current maintenance spend.
What is the typical deployment timeline for AI tracker monitoring at a utility-scale solar plant?
A standard deployment takes four to eight weeks from initial data connection to operational monitoring. The first phase connects the AI platform to your existing tracker SCADA and control system data, which typically takes one to two weeks depending on communication protocol compatibility. The second phase runs the AI in learning mode for two to four weeks, during which it establishes per-tracker baselines and validates the anomaly detection models against known historical faults. The third phase activates live monitoring and alert generation, initially in advisory mode alongside your existing maintenance program so the team can validate alert accuracy before relying on AI-generated work orders as the primary maintenance driver. Most plants transition to full AI-driven maintenance scheduling within 90 days of deployment.
Book a demo to see the deployment roadmap for your plant's tracker system and SCADA architecture.
Your Trackers Are Already Telling You They Are Failing — Through Motor Current, Torque Demand, and Response Time Data That Nobody Is Analyzing
iFactory's AI platform turns the operational data your tracker fleet already generates into predictive maintenance intelligence that finds failing motors, worn gearboxes, and drifting controllers before they strand rows at the wrong angle and leak revenue across your site. Book a demo to see fleet-wide tracker health monitoring on your plant data.