A solar plant's availability report showing 97% uptime may be hiding $800K in annual generation loss from string-level faults your inverter monitoring never surfaces, panel soiling degradation that compounds week-on-week, and tracker misalignment that cuts energy yield by 3–6% across entire rows. iFactory's solar analytics platform connects to every inverter, string combiner, weather station, and tracker controller in your facility — running continuous AI analysis to detect underperforming strings, degraded panels, inverter faults, and soiling losses before they compound into significant revenue loss. Book a free solar analytics assessment.
Quick Answer
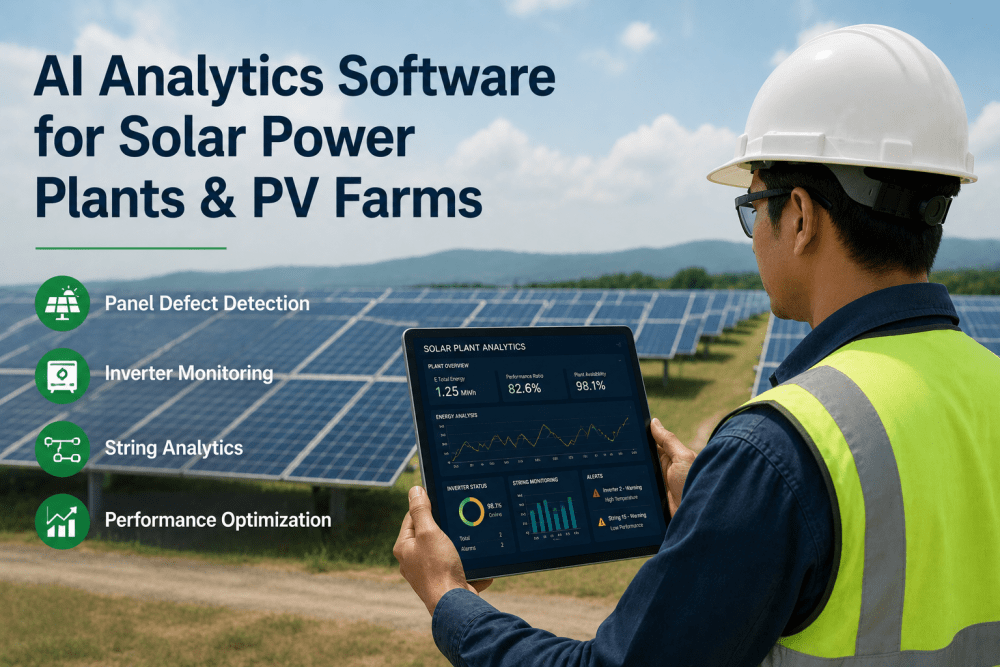
iFactory's solar analytics platform monitors every string, inverter, and tracker in real time — detecting underperformance, soiling degradation, fault conditions, and equipment failures with AI that benchmarks each string against irradiance-corrected expected output. Average revenue recovery: $200K–$600K annually per 50MW solar facility from performance losses previously undetected.
How iFactory Solves the Core Revenue Losses in Solar Plant Operations
Solar revenue losses are not always visible as faults. Most appear as quiet underperformance — a string producing 91% of expected output, an inverter running 2°C hotter than its neighbours, a tracker row that stopped following the sun 11 days ago. iFactory finds all of them, continuously. Book a demo to see AI solar analytics applied to your plant configuration.
String-Level Performance Monitoring
EveryString, Every Interval
iFactory benchmarks every string's output against irradiance-corrected expected generation — normalising for real-time POA irradiance, temperature coefficient, and module age. A string producing 8% below its irradiance-adjusted peer benchmark is flagged immediately. Faults that inverter-level monitoring misses entirely are detected at string resolution.
String faults found weeks before inverter alarms fire
Inverter Fault Detection & Health Monitoring
72+ hrsFault Warning
Inverter efficiency, MPPT tracking accuracy, thermal performance, and conversion losses monitored continuously — detecting developing faults 72+ hours before inverter shutdown. iFactory benchmarks each inverter against its peers under identical irradiance conditions to isolate genuine degradation from normal operating variation. Work orders auto-generate in CMMS with fault classification and severity.
Inverter downtime reduced — planned swap vs emergency replacement
Soiling Loss Quantification & Cleaning Optimisation
Per RowSoiling Rate Tracked
AI tracks soiling-induced performance degradation per row and per combiner zone — calculating actual soiling loss in kWh and revenue terms, and projecting the economic crossover point where cleaning cost is exceeded by generation loss. Cleaning schedules driven by AI-calculated soiling loss rather than fixed calendar intervals, recovering 15–30% in cleaning cost efficiency.
Cleaning triggered by revenue loss threshold — not by calendar
Tracker Performance & Misalignment Detection
3–6%Yield Loss Recovered
Single-axis tracker angle accuracy monitored per row — comparing actual tracker position against the calculated optimal angle for real-time sun position and detecting rows that have stopped tracking, drifted from target, or are backlash-limited. A tracker row stalled at morning angle for 2 days is detected immediately; at 50MW scale, a single stalled row costs $800–$1,400 per day in lost generation.
Stalled tracker detected — $800–$1,400/day loss recovered
AI Thermal Imaging — Panel Hotspot Detection
99%+Hotspot Detection Accuracy
Drone-mounted and fixed thermal cameras connected to iFactory's AI vision platform detect cell hotspots, bypass diode failures, delamination, and PID degradation patterns that string monitoring cannot identify. Every finding is photographed, georeferenced to panel location, classified by severity, and linked to a work order — replacing manual drone data processing that typically takes 3–4 days per inspection cycle.
Drone data processed in hours — not 3–4 days manually
Energy Yield Loss Dashboard & O&M Optimisation
$200K+Avg Annual Recovery
Every loss category — string faults, soiling, tracker failures, inverter degradation, clipping, and curtailment — quantified in kWh and dollar terms on a single dashboard. O&M activities prioritised by revenue recovery value, not by alarm time. Automated work orders routed directly to field crews with GPS coordinates, fault type, and recommended action pre-populated.
O&M priorities ranked by revenue recovery — not alarm time
Find Your Plant's Hidden Generation Loss — Most Solar Sites Discover $200K–$600K in the First 30 Days.
iFactory's pre-deployment assessment connects to your existing SCADA and inverter monitoring to calculate your current loss breakdown by category — before you commit to full deployment.
Deployment Roadmap — Solar Analytics Live in 4 Weeks
iFactory connects to your existing inverter SCADA, weather stations, and tracker controllers. No new field hardware required in most deployments. First string-level anomalies detected within 14 days. Book a demo for your plant-specific deployment plan.
Plant Data Integration & Asset Registry
Inverter SCADA, string combiner data, weather stations, tracker controllers, and irradiance sensors connected via Modbus, OPC-UA, or vendor API. Plant single-line layout imported. Historical generation and fault data ingested for baseline calibration.
Deliverable — All data sources live, plant layout mapped, historical data imported
AI Baseline Calibration & Performance Modelling
Irradiance-corrected performance baselines established per string and per inverter. Soiling rate baselines set from historical performance data. Tracker angle benchmarks configured. Loss categorisation model calibrated to your specific module technology and site conditions.
Deliverable — Performance baselines live, loss model calibrated, first anomaly detections active
CMMS Integration, Dashboard & Thermal Imaging Activation
Work order templates configured per fault type. O&M CMMS connected for automatic work order routing. Thermal imaging AI activated for drone data ingestion. Plant yield loss dashboard deployed with revenue impact quantification per loss category.
Deliverable — Full dashboard live, CMMS integrated, thermal AI active, first work orders generating
Operational
Full Solar Analytics Active — Every String, Every Inverter, Every Day
Continuous string monitoring, inverter health scoring, soiling loss tracking, tracker performance, and thermal anomaly detection all live. O&M work orders generating automatically. First loss recovery report delivered. 90-day support included.
Deliverable — Full platform live, first loss recovery report, O&M work orders active
Solar Analytics ROI — What iFactory Recovers at Your Plant
Solar generation loss is almost entirely recoverable — it is not equipment failure, it is undetected underperformance. Every percentage point of PR improvement at a 50MW plant at $40/MWh is worth approximately $175K annually. Book a demo to see the ROI projection for your plant size and irradiance zone.
$200K+
Avg Annual Recovery per 50MW Plant
2–4%
Performance Ratio Improvement
72+ hrs
Inverter Fault Warning
30 days
To First Loss Recovery Identified
15–30%
Cleaning Cost Efficiency Improvement
$800+
Daily Loss Recovered per Stalled Tracker Row
99%+
Thermal Hotspot Detection Accuracy
4 wks
To Full Platform Go-Live
Get Your Plant's Loss Breakdown — String Faults, Soiling, Tracker, and Inverter — in Dollar Terms.
iFactory's solar pre-deployment assessment connects to your existing SCADA and calculates your current loss by category, with revenue impact per loss type and projected annual recovery from AI monitoring.
iFactory vs Competitor Solar Analytics Platforms
SolarEdge monitoring, Sungrow iSolarCloud, Huawei FusionSolar, and AlsoEnergy all offer inverter and plant-level monitoring. None combines string-level AI anomaly detection, soiling revenue modelling, tracker performance AI, drone thermal integration, and automated CMMS work orders in a single platform. Book a demo to see iFactory mapped against your current monitoring setup.
| Capability |
iFactory |
SolarEdge |
Sungrow iSolarCloud |
Huawei FusionSolar |
AlsoEnergy |
| Detection & Analytics |
| Irradiance-corrected string AI benchmarking | All inverter brands | SolarEdge only | Sungrow only | Huawei only | Multi-brand, basic |
| Soiling loss quantification in revenue terms | Per row — $ impact | Not available | Not available | Not available | Basic PR only |
| Tracker row angle AI monitoring | All tracker brands | Not available | Not available | Not available | Limited |
| Drone thermal image AI processing | Georeferenced, auto work order | Not available | Not available | Not available | Not available |
| Integration & Action |
| Auto CMMS work order generation | SAP / Maximo / native | Not available | Not available | Not available | Limited |
| Multi-brand inverter support | All major brands | SolarEdge only | Sungrow only | Huawei only | Multi-brand |
| On-premise / data sovereignty | Full on-premise option | Cloud only | Cloud only | Cloud only | Cloud only |
Based on publicly available product documentation as of Q1 2025. Verify current capabilities with each vendor before procurement decisions.
What Our Clients Say
"We had inverter-level SCADA from our OEM and a quarterly drone inspection programme. Between drone cycles, string faults would go undetected for weeks — we estimated we were losing 1.8–2.4% of annual generation to faults that fell below inverter alarm thresholds. iFactory's string-level AI caught 23 underperforming strings in the first 30 days, seven of which had been degrading for 6–11 weeks undetected. The revenue recovery in the first quarter was $214,000. The soiling analysis also showed our fixed cleaning schedule was over-cleaning the northern rows and under-cleaning the southern rows — we adjusted the schedule and saved $38,000 in cleaning contract cost annually."
O&M Director
80MW Single-Axis Tracker Solar PV Plant — Middle East
Frequently Asked Questions
QDoes iFactory work with mixed inverter fleets — SolarEdge, Sungrow, and Huawei on the same site?
Yes. iFactory integrates with all major inverter brands via Modbus, SunSpec, or vendor API — presenting all data in a single unified dashboard regardless of inverter manufacturer. Mixed-brand sites benefit most, since OEM platforms only monitor their own equipment.
Book an integration compatibility review.
QHow does iFactory calculate soiling loss without a dedicated soiling sensor?
iFactory uses irradiance-normalised peer comparison across strings within the same combiner zone — groups of strings with identical orientation and age that should produce identical irradiance-adjusted output. When a zone underperforms its peers uniformly, the degradation is attributed to soiling and quantified in kWh and revenue terms. For sites with soiling sensors, those feed directly into the model.
QCan iFactory process drone thermal imagery from our existing inspection contractor?
Yes. iFactory ingests thermal image datasets in standard formats (FLIR, DJI, radiometric JPEG) from any drone inspection contractor and processes them through AI classification automatically — delivering a georeferenced fault map with severity classification and work orders within hours of dataset upload, rather than the 3–4 days of manual processing the contractor typically requires.
QHow does iFactory handle performance comparison across strings with different module ages or technologies?
Each string's expected output model is calibrated from its actual historical performance — accounting for module age-related degradation rate, technology-specific temperature coefficients, and known shading patterns. Peer comparison is always within cohorts of identical configuration. Newly installed strings are given a 14-day calibration period before anomaly detection is activated.
Continue Reading
Find Your Solar Plant's Hidden Generation Loss — String by String, Row by Row.
iFactory solar analytics connects to your existing SCADA and inverter monitoring. First string anomalies detected within 14 days. Full platform live in 4 weeks. Multi-brand inverter support. On-premise option available.
String-Level AI Monitoring
Soiling Loss Quantification
Tracker Performance AI
Drone Thermal Processing
All Inverter Brands