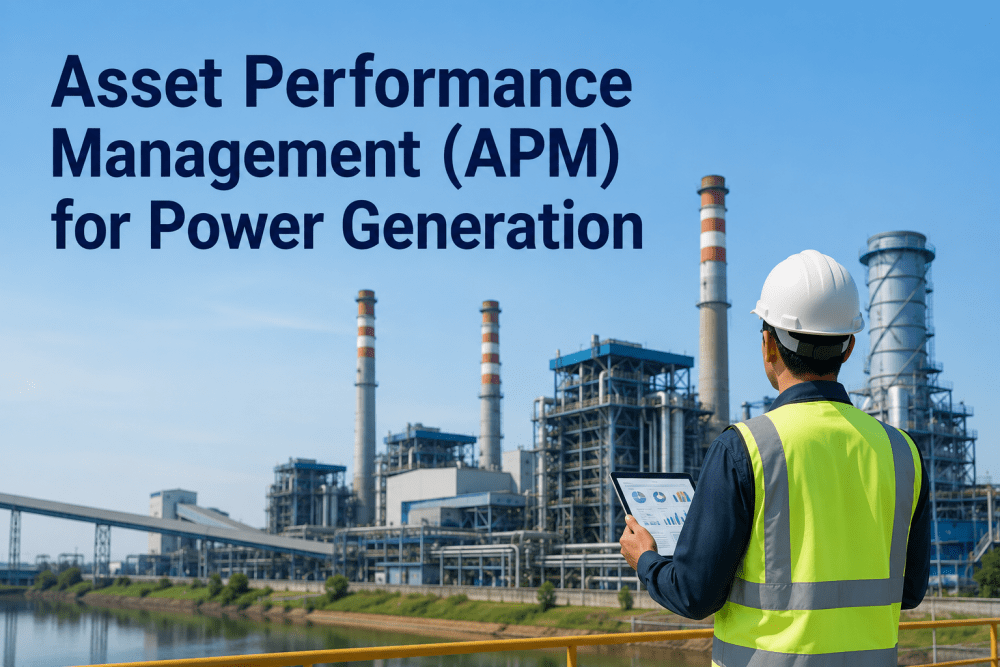
Asset Performance Management for power generation has undergone a fundamental transformation in the past five years — shifting from periodic manual condition assessments to continuous AI-driven health monitoring that predicts failure modes across turbines, generators, transformers, and balance-of-plant equipment before they interrupt production. Book a Demo to see how iFactory's APM platform transforms your asset reliability program.
Stop Managing Power Plant Assets by Calendar. Start Managing Them by Condition.
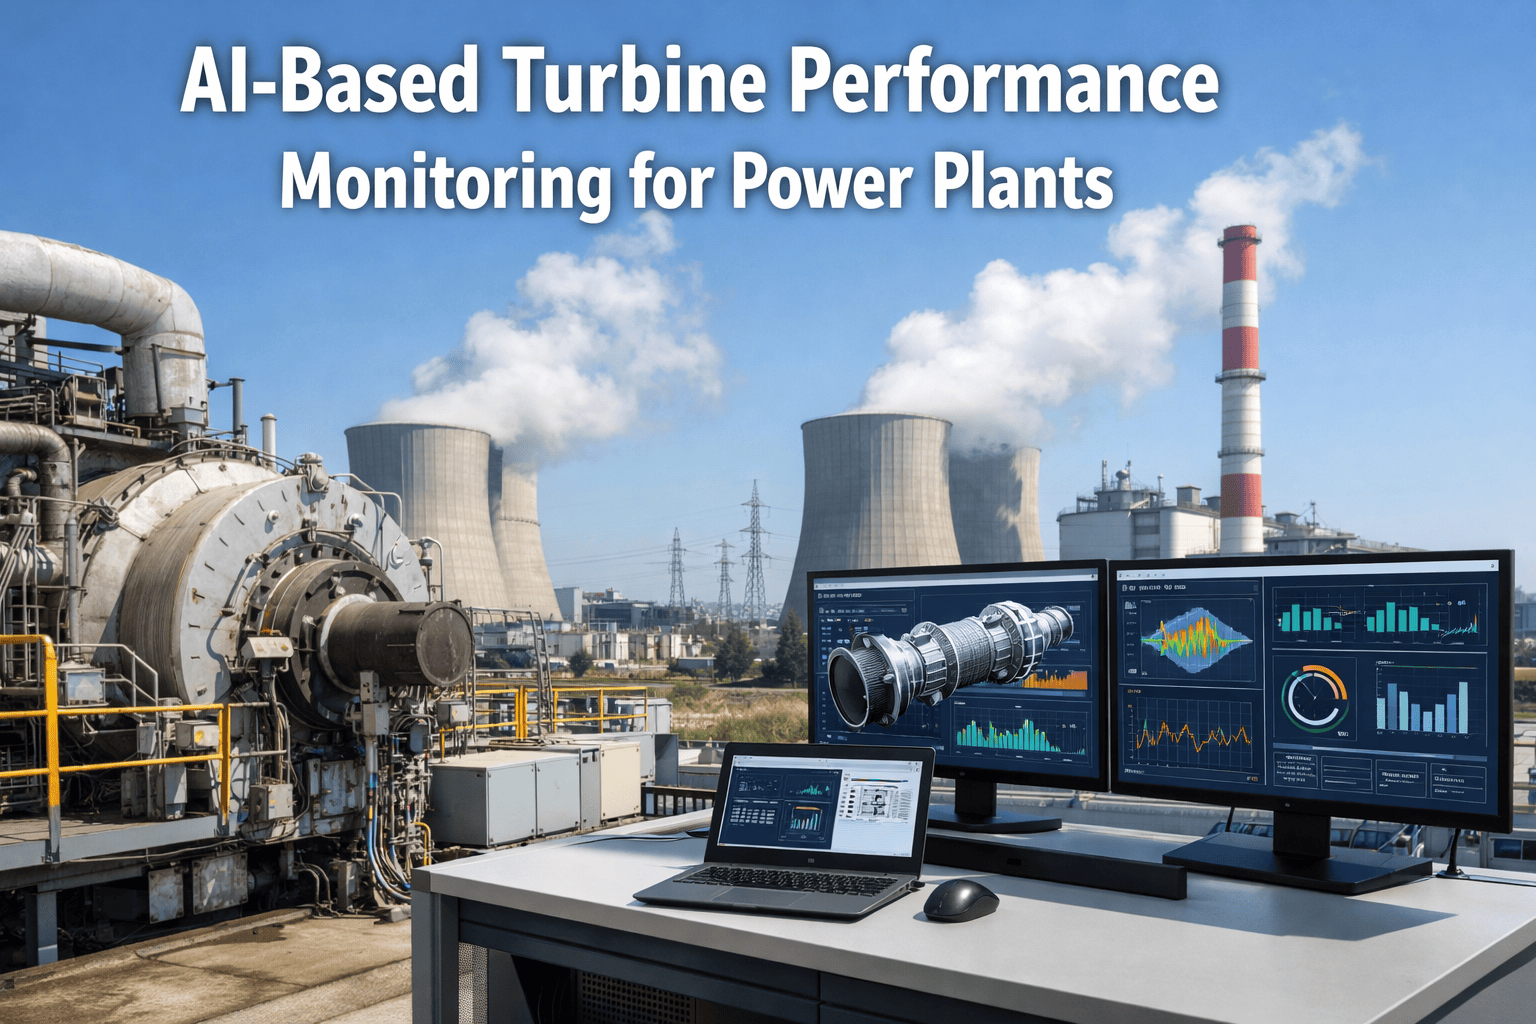
iFactory's APM platform monitors gas turbines, steam turbines, generators, transformers, and HRSGs in real time — with AI-driven health scoring, remaining useful life prediction, and automated work order generation that converts condition data into prevented outages.
The Four Pillars of AI-Driven Asset Performance Management for Power Generation
Traditional power plant condition monitoring programs are organized around individual asset technologies — a vibration monitoring system for turbines, a dissolved gas analysis program for transformers, a thermographic inspection program for electrical distribution — each operating independently with separate alarm thresholds, separate data storage, and separate staffing.
| APM Pillar | Primary Function | Key Technology | Target Assets | Business Impact |
|---|---|---|---|---|
| Condition Monitoring | Real-time parameter tracking against asset-specific baselines | Vibration, temperature, pressure, oil analysis, DGA | Turbines, generators, transformers, pumps | Early degradation detection before failure |
| Predictive Analytics | AI-driven failure mode prediction with lead-time estimation | Machine learning, anomaly detection, trend analysis | Gas turbines, steam turbines, compressors | 24–72 hour advance warning of critical failures |
| Lifecycle Optimization | Remaining useful life modeling and inspection interval management | RUL algorithms, fatigue modeling, creep analysis | HRSGs, boiler tubes, steam headers, rotors | 35% extension in major inspection intervals |
| Risk-Based Workflow | Consequence-weighted maintenance prioritization and work order automation | Risk matrix, CMMS integration, mobile inspection | All generation assets | 47% reduction in unplanned downtime |
How AI Predictive Analytics Converts Sensor Data into Prevented Outages
The difference between a conventional condition monitoring system and an AI-powered APM platform is the difference between reading a gauge and understanding the physics of failure that the gauge is reporting. A traditional system fires an alarm when bearing temperature exceeds 95 degrees Celsius. Maintenance planners who Book a Demo during the evaluation phase consistently report that the transition from threshold-based alerts to AI-predicted failure modes fundamentally changes how they allocate maintenance resources across the generation fleet.
Critical Asset Groups in Power Generation APM: Monitoring Parameters and Failure Modes
Each generation asset class presents distinct failure physics, monitoring requirements, and economic consequence profiles. Gas turbine hot section degradation follows a fundamentally different pattern than generator winding insulation breakdown or power transformer paper insulation aging. iFactory's APM library defines monitoring templates for each major generation asset class — calibrated to the specific failure modes, sensor requirements, and lead-time expectations of that equipment type — while maintaining a unified health scoring framework that enables cross-asset prioritization. Book a Demo to see iFactory's asset-specific APM templates in a live power generation environment.
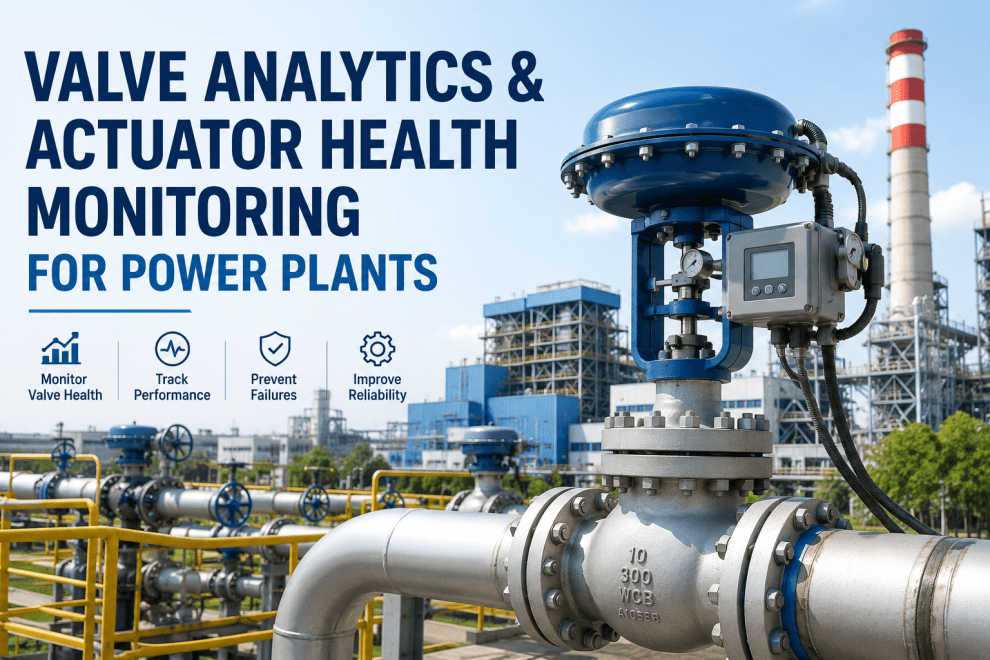
Turbines represent the highest single-asset value and the most severe failure consequence in any power generation facility. A gas turbine hot section failure can exceed $15 million in repair cost plus 6–12 months of lost generation capacity. iFactory's turbine monitoring module tracks over 200 parameters per unit at 1-second intervals — bearing vibration spectra, exhaust gas temperature spread, combustion dynamics, rotor position, lube oil condition, and blade path temperature distribution — applying AI models trained on more than 50,000 turbine operating hours to detect failure signatures before they reach the damage threshold.
- Bearing vibration envelope trending with load and fuel mode correlation
- Exhaust gas temperature spread monitoring for combustion liner degradation detection
- Rotor position and thrust bearing wear trending from axial displacement measurements
- Lube and hydraulic oil condition monitoring with particle count and moisture trending
- Startup and shutdown transient analysis for thermal fatigue accumulation tracking
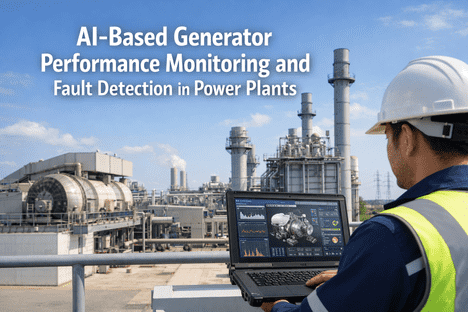
Generator failures are among the longest-duration outage events in power generation, with stator winding repairs typically requiring 8–16 weeks and rotor rewind projects extending beyond six months. The failure modes are predominantly insulation related — partial discharge activity, stator bar vibration, rotor turn-to-turn shorts, and hydrogen seal oil degradation — all of which generate detectable signatures weeks to months before failure. iFactory monitors generator electrical and mechanical parameters continuously, integrating partial discharge data, hydrogen purity, stator cooling water chemistry, and excitation system performance into a unified generator health score.
- Partial discharge trending by phase and load condition for stator insulation assessment
- Hydrogen seal oil system monitoring with purity, pressure, and moisture trending
- Rotor turn-to-turn short detection via flux probe and torsional vibration analysis
- Stator cooling water chemistry and blockage detection for water-cooled generators
- Excitation system performance trending including brush wear and voltage regulator stability
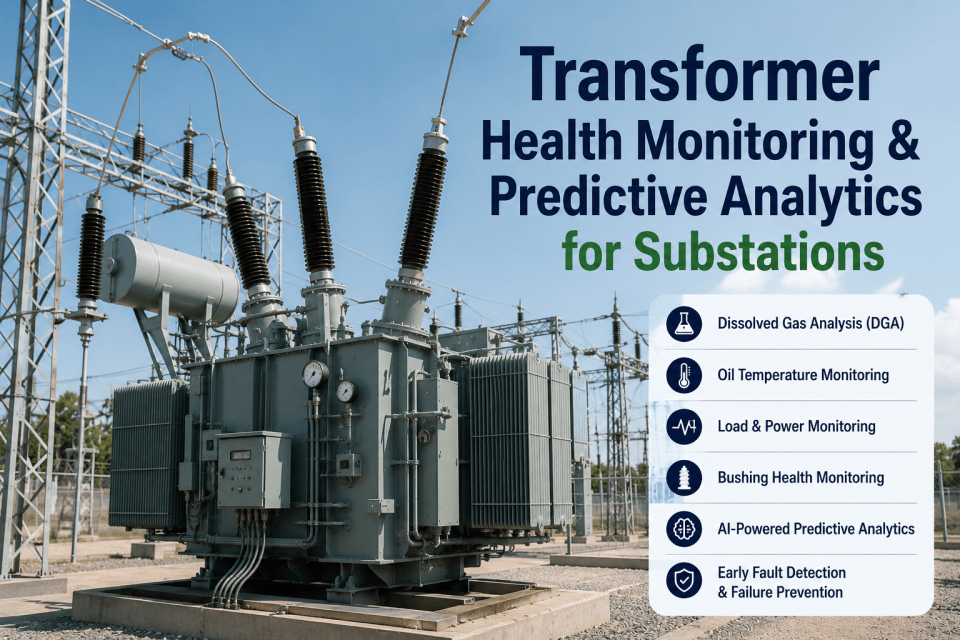
Power transformers are the longest-lead-time replacement asset in a generation facility — a large generator step-up transformer (GSU) may have a 12–18 month delivery lead time. Transformer failures are driven primarily by insulation degradation, which is detectable through dissolved gas analysis (DGA), partial discharge, and moisture in oil monitoring years before failure. iFactory's transformer health module integrates online DGA monitors, bushing condition assessment, cooling system performance, and load tap changer operation data into a single transformer health index that enables condition-based rather than time-based maintenance planning.
- Online DGA trending with key gas ratio analysis for fault type identification
- Bushing capacitance and power factor trending for insulation condition assessment
- Cooling system performance monitoring including oil pump, fan, and radiator condition
- Load tap changer operation tracking with motor current and contact wear estimation
- Moisture in oil and paper insulation equilibrium modeling for aging rate estimation
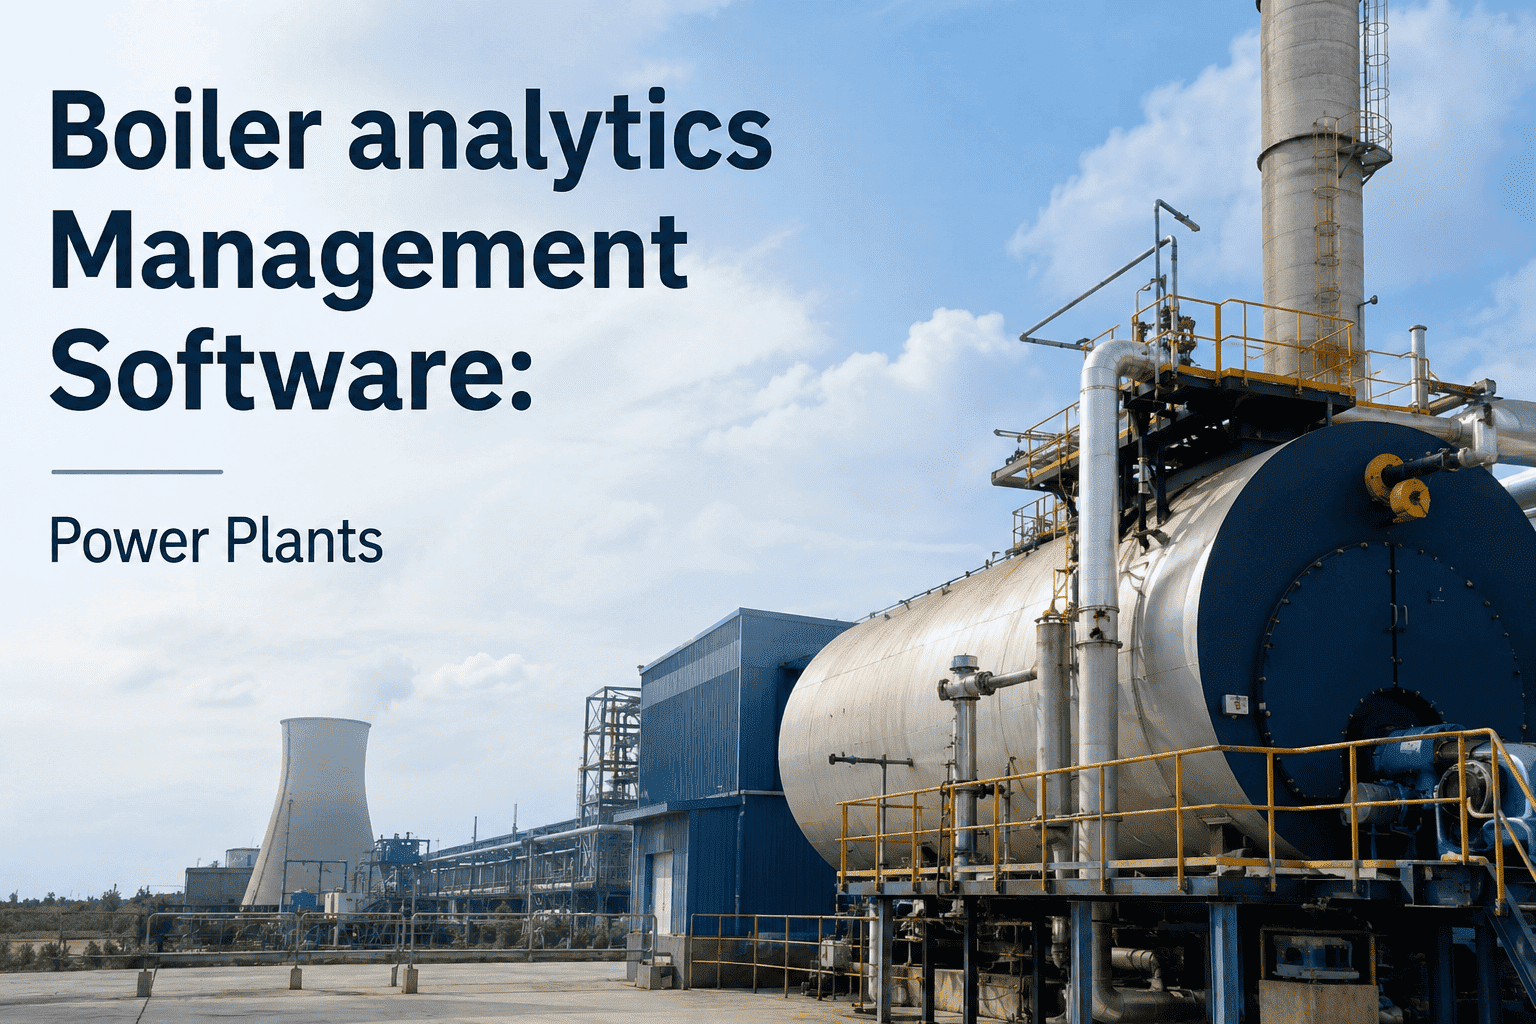
Heat recovery steam generators and conventional boilers are the most tube-intensive assets in any power plant — a single large combined-cycle HRSG contains 30,000 to 50,000 tube welds operating at the boundary between high-temperature gas and high-pressure steam. Tube failures from creep, thermal fatigue, corrosion fatigue, and flow-accelerated corrosion are the most common cause of forced outages in combined-cycle and steam plant operations. iFactory's HRSG monitoring module integrates tube metal temperature trending, feedwater chemistry, steam side pressure and temperature, and firing duty cycle data to identify tube degradation signatures before wall loss reaches the failure point.
- Tube metal temperature trending by section for creep life consumption monitoring
- Feedwater chemistry surveillance with automated correction dose recommendations
- Startup and shutdown thermal transient tracking for thermal fatigue accumulation
- Flow-accelerated corrosion risk assessment based on chemistry and geometry correlation
- Automated thickness inspection scheduling based on calculated corrosion rate and remaining life
Asset Lifecycle Optimization: From Condition Assessment to Capital Planning
The most significant cost driver in power generation asset management is not the cost of maintenance — it is the cost of replacing generation assets before their economic life is fully utilized. A 200 MW gas turbine that is retired at 80% of its design life represents a $20–40 million capital loss that must be recovered through accelerated depreciation or replacement cost. iFactory's lifecycle optimization module calculates remaining useful life for each generation asset based on actual operating conditions, maintenance history, and degradation rate — enabling operators to run assets to their true economic life limit while maintaining acceptable failure risk.
Asset Criticality Assessment and Baseline Condition Documentation
iFactory registers every generation asset with criticality classification, OEM design life, maintenance history, and current condition data. Baseline condition documentation establishes the starting point for all future degradation trending and remaining life calculation.
Remaining Useful Life Modeling with Operating Condition Calibration
RUL models are calibrated to each asset's actual operating profile — starts, load cycles, fuel quality, ambient conditions — rather than OEM generic curves. The model updates continuously as new condition data is ingested, providing a dynamically accurate life consumption estimate.
Inspection Interval Optimization and Maintenance Strategy Adjustment
RUL data drives condition-based inspection interval adjustment — extending intervals where degradation rates are below design assumptions and accelerating inspections where operating severity is driving faster-than-expected consumption of life.
Long-Range Capital Planning and Replacement Forecasting
Aggregated RUL data across the generation fleet generates 5-, 10-, and 20-year capital replacement forecasts with confidence intervals. Enables finance teams to plan depreciation schedules, reserve funds, and project timing with quantified uncertainty ranges.
Traditional Condition Monitoring vs. AI-Powered Asset Performance Management
The distinction between conventional condition monitoring and AI-powered APM is not a matter of degree — it is a structural difference in how data is interpreted and acted upon. A traditional vibration monitoring system measures what is happening now. An AI-powered APM platform predicts what will happen next, quantifies the economic consequence, and prescribes the optimal intervention. The comparison below documents how each function changes across the major APM workstreams.
Replace Five Disconnected Monitoring Systems with One Unified APM Platform
iFactory connects turbine vibration monitoring, generator partial discharge, transformer DGA, boiler tube temperature trending, and balance-of-plant condition data into a single asset health dashboard — with AI-driven failure prediction and automated work order generation.
Asset Performance Management Is the Competitive Advantage in Power Generation
The power generation industry is operating in an environment of compressed margins, aging assets, and increasing availability expectations from grid operators and offtakers. In this environment, the difference between a plant that runs a calendar-based maintenance program and one that runs a condition-based APM program is not incremental — it is the difference between a plant that operates at 92% availability and one that operates at 96%, between a plant that retires assets at 80% of design life and one that captures their full economic potential, between a plant that discovers failures during operation and one that detects them 48 hours before they occur and schedules the repair during a planned window.
iFactory's APM platform for power generation delivers the unified asset intelligence that makes the condition-based paradigm operational: continuous health monitoring across all critical asset classes, AI-driven failure prediction with quantified lead time and confidence, remaining useful life calculation that drives inspection interval optimization, and automated work order generation that converts condition data into prevented outages. The technology is proven. The ROI is documented. The question is whether your asset management program is running on data that is 12 months old or on intelligence that is 12 seconds old. Book a Demo to see iFactory's APM platform in a live power generation environment.
Asset Performance Management for Power Generation — Common Questions Answered
Build a Unified, Condition-Based Asset Performance Management Program with iFactory AI
iFactory connects turbine monitoring, generator analysis, transformer DGA, and boiler tube integrity data into a single APM platform — with AI-driven failure prediction, remaining useful life calculation, and automated work order generation that converts condition data into prevented outages.