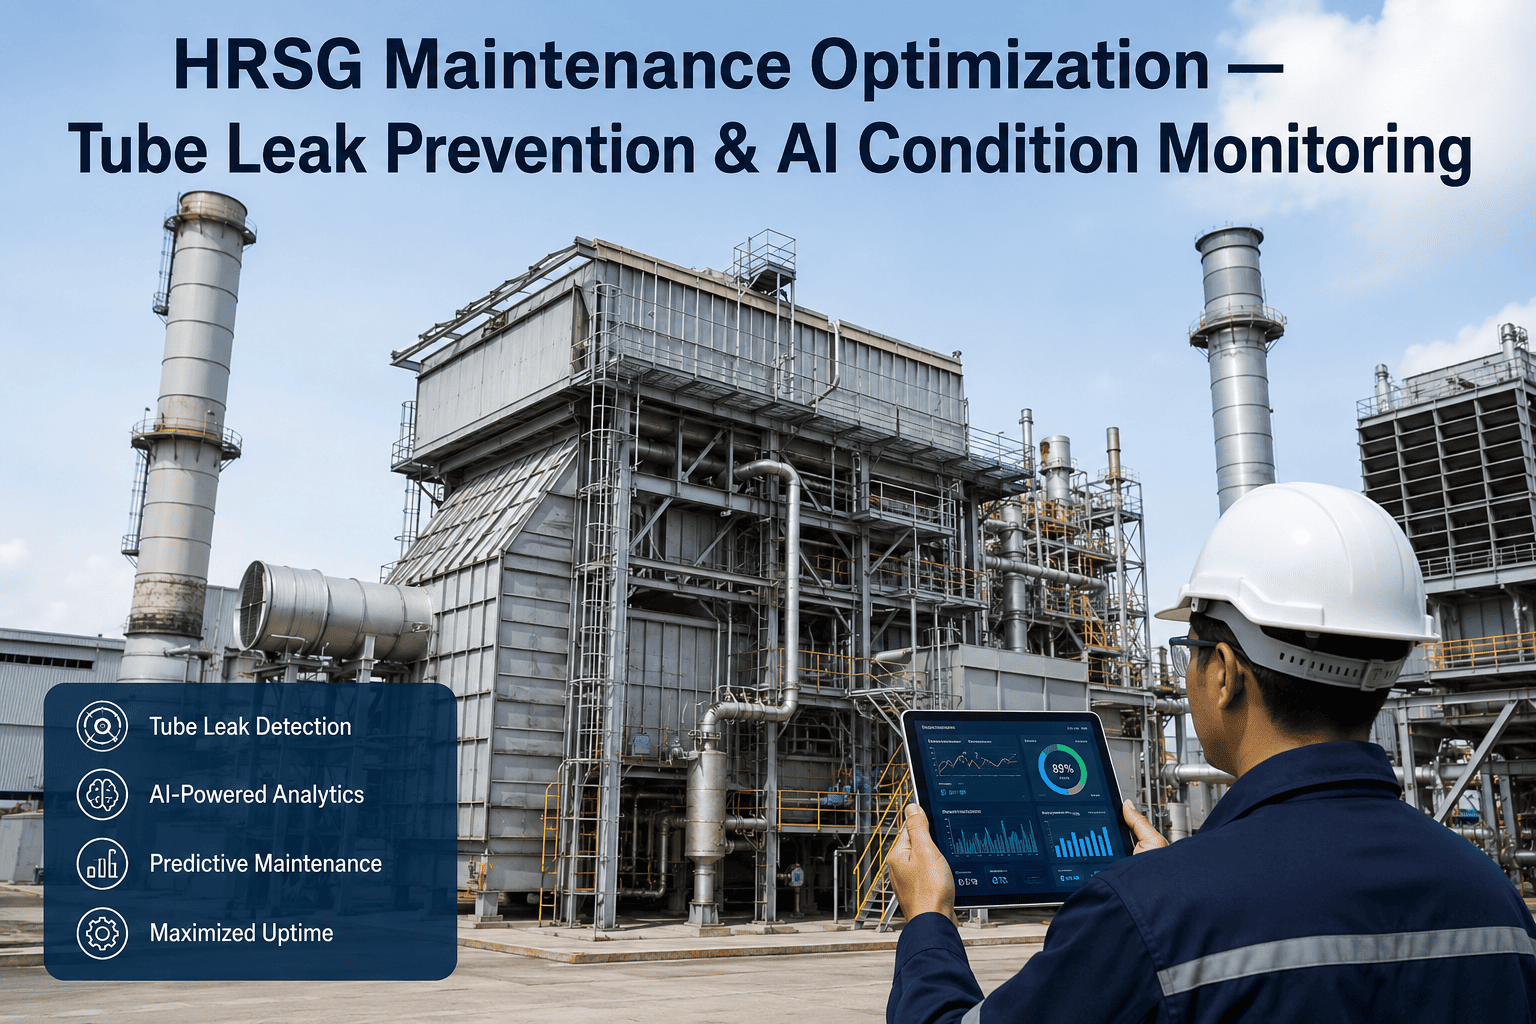
Heat Recovery Steam Generators (HRSGs) are the backbone of combined-cycle power plants and industrial cogeneration systems, converting exhaust heat from gas turbines into high-pressure steam for additional power generation or process use. However, these critical assets face relentless thermal cycling, corrosive environments, and mechanical stresses that accelerate tube degradation, drum level instability, and attemperator performance drift. The financial impact is severe: a single HRSG tube leak can trigger a forced outage lasting 7 to 14 days, costing between $500,000 and $2 million in lost revenue and repair expenses, not including penalties for unavailability. Traditional maintenance strategies—calendar-based inspections and reactive repairs—are no longer sufficient in an era where asset reliability directly influences profitability and regulatory compliance. The next frontier is AI-driven predictive maintenance, which leverages real-time sensor data, historical failure patterns, and machine learning algorithms to forecast incipient faults with weeks of lead time. This guide provides a comprehensive, technically rigorous framework for implementing AI condition monitoring across HRSG tube bundles, drum level controls, and attemperator systems, enabling process engineers and maintenance directors to eliminate unplanned downtime and optimize lifecycle costs. Book a Demo to see how iFactory's platform delivers actionable insights for your HRSG fleet.
Eliminate HRSG Tube Leaks with AI-Powered Monitoring
Prevent forced outages and reduce maintenance costs by 40% with real-time condition analytics. Schedule a personalized demo today.
Understanding HRSG Tube Failure Mechanisms
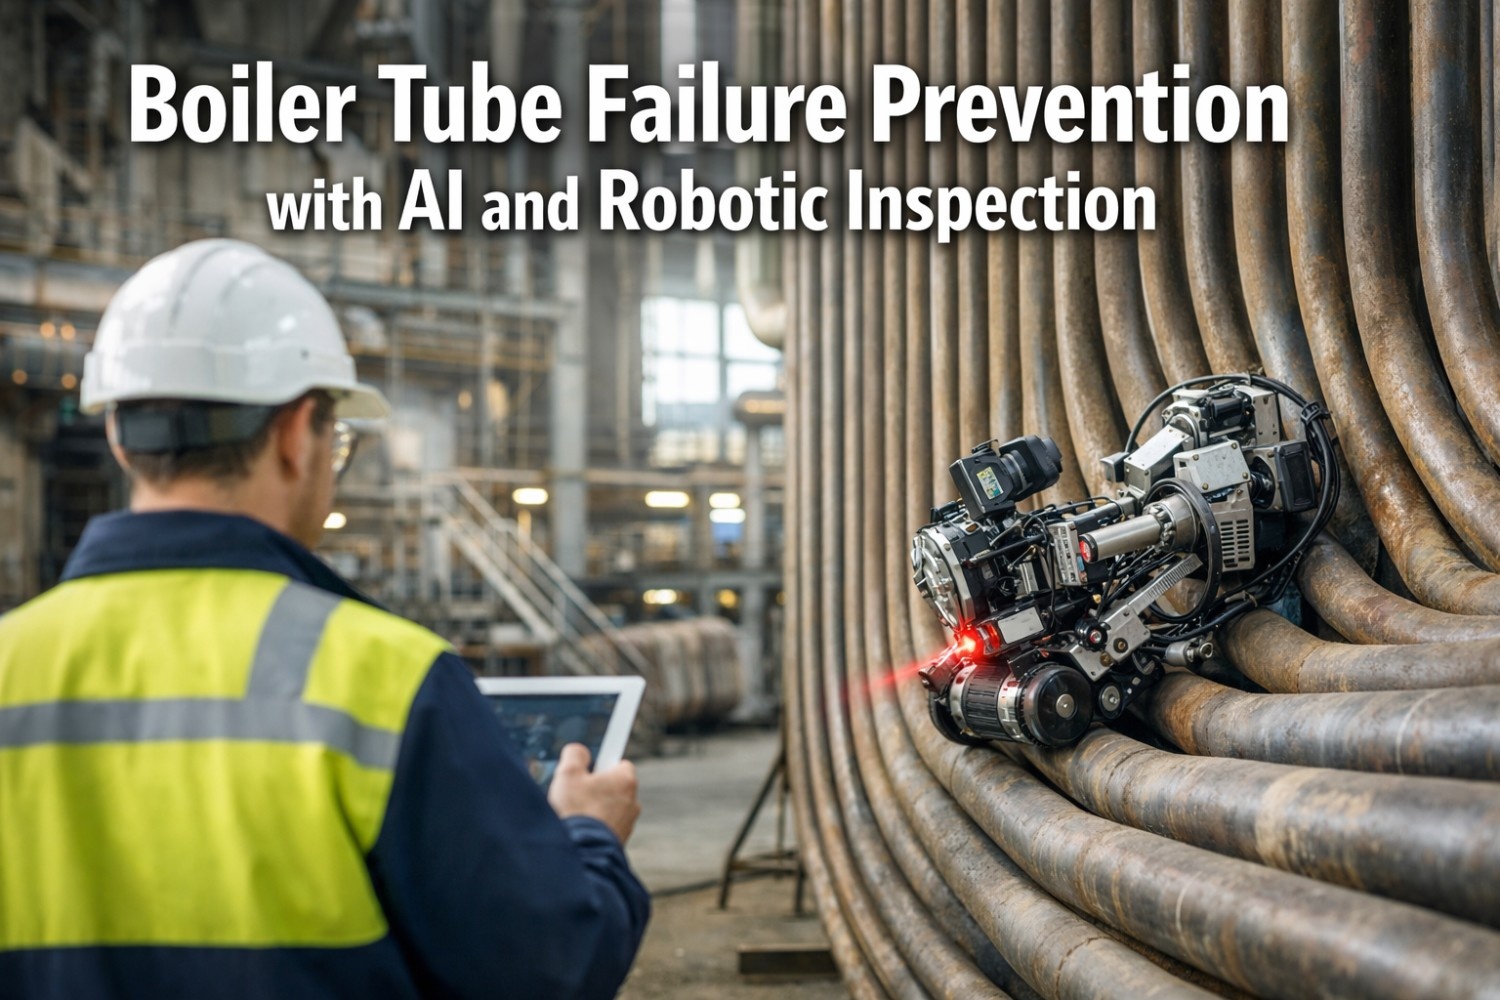
HRSG tubes operate under extreme conditions: temperatures up to 600°C, pressures exceeding 150 bar, and exposure to corrosive combustion gases. The primary failure mechanisms include creep, fatigue, corrosion fatigue, and stress corrosion cracking. Creep occurs when tubes are subjected to high temperatures and stresses over extended periods, causing gradual deformation and eventual rupture. Fatigue failures arise from thermal cycling during start-up and shut-down cycles, which induce cyclic stresses that initiate cracks at weld joints or tube support locations. Corrosion fatigue is exacerbated by the presence of chlorides and sulfates in the steam or condensate, which attack the protective oxide layer on the tube surface. Stress corrosion cracking typically manifests in austenitic stainless steel tubes exposed to caustic environments. Each mechanism exhibits distinct precursor signatures detectable through advanced sensor data: wall thickness reduction, localized temperature anomalies, vibration changes, and acoustic emission patterns. AI models trained on historical failure data can identify these signatures weeks before catastrophic failure, enabling planned interventions during scheduled outages rather than emergency shutdowns.
Critical Components for AI Condition Monitoring
Tube Bundles
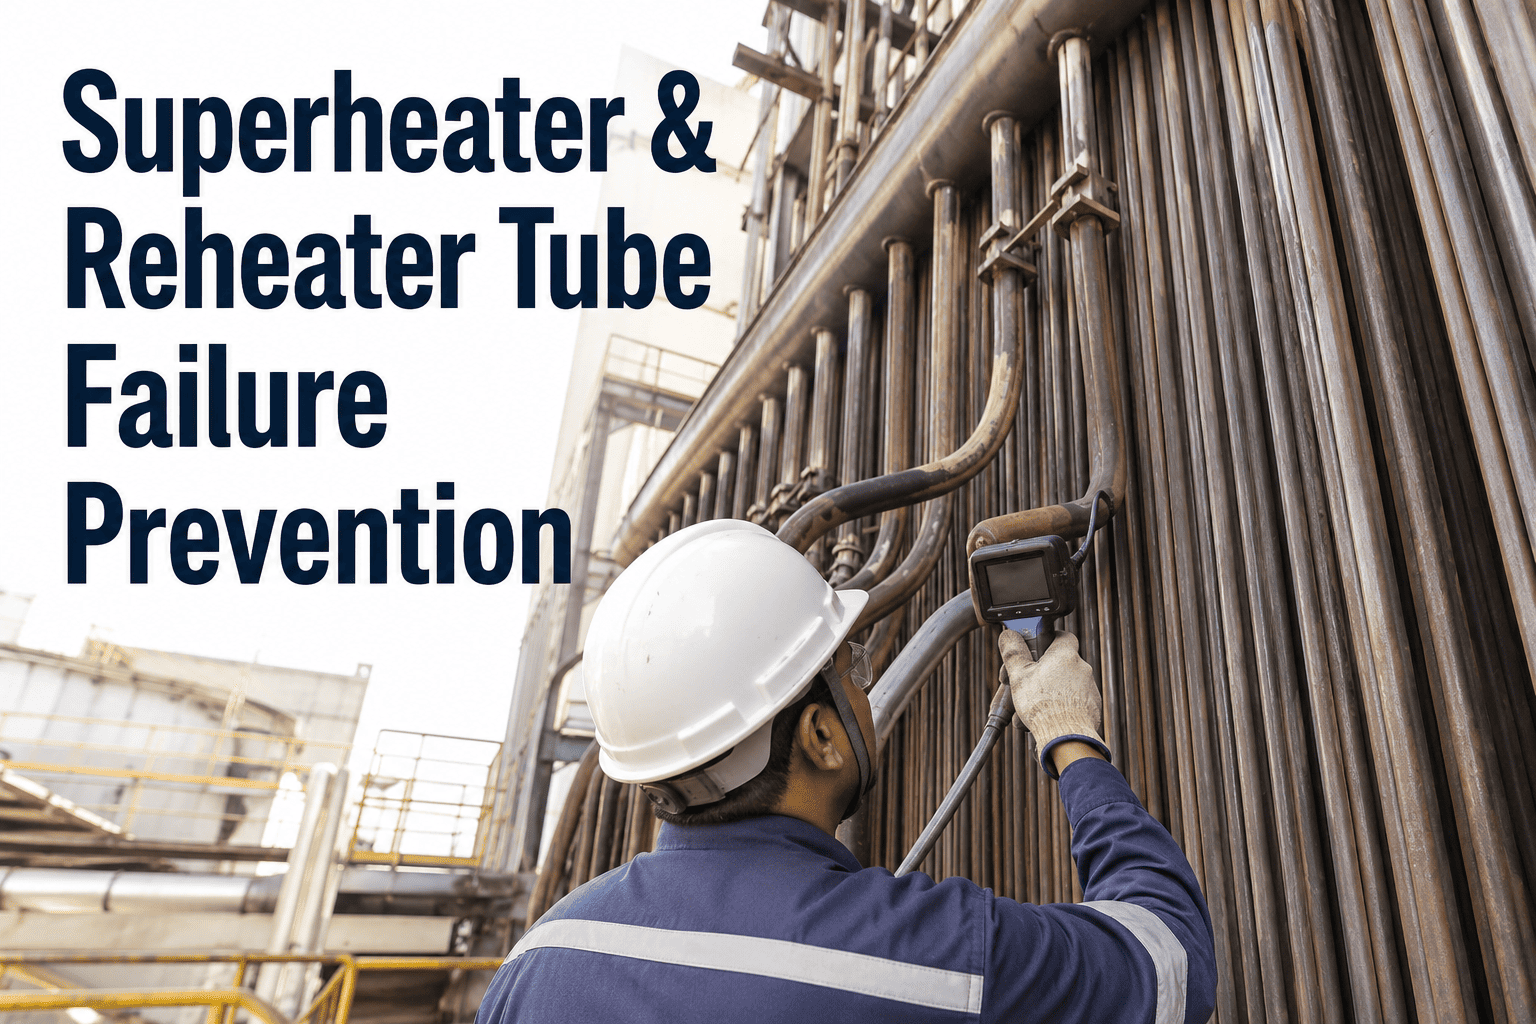
Monitor wall thickness, temperature profiles, and vibration patterns across evaporator, superheater, and economizer sections. AI detects thinning rates and predicts remaining useful life.
Drum Level Control
Analyze drum level transients during load changes to identify sticking valves, calibration drift, or control loop instability that can lead to water carryover or tube dryout.
Attemperator Performance
Track spray water flow, temperature differentials, and valve position feedback to detect erosion, blockage, or control degradation affecting steam temperature regulation.
Feedwater Heaters
Evaluate terminal temperature difference and drain cooler approach to identify fouling or tube leakage that reduces overall thermal efficiency.
Condensate System
Monitor conductivity, dissolved oxygen, and pH levels to detect contamination sources that accelerate corrosion in downstream components.
Stack Emissions
Correlate NOx, CO, and opacity readings with combustion conditions to identify burner imbalances or heat transfer surface degradation.
Implementation Roadmap for AI-Driven HRSG Monitoring
Sensor Infrastructure Assessment
Evaluate existing instrumentation coverage for tube wall temperature, drum level, attemperator flow, and vibration. Identify gaps where additional sensors (e.g., acoustic emission, ultrasonic thickness) are needed for comprehensive data collection.
Data Integration and Normalization
Aggregate historical and real-time data from DCS, PLC, and CMMS systems. Clean and normalize data to remove noise, handle missing values, and align timestamps across different sources for consistent analysis.
Model Training and Validation
Train machine learning models (e.g., random forest, gradient boosting, LSTM networks) on labeled failure events to recognize precursor patterns. Validate models using cross-validation and holdout datasets to ensure accuracy and robustness.
Dashboard and Alert Configuration
Develop intuitive dashboards displaying real-time health scores, trend lines, and risk indicators for each monitored component. Configure threshold-based and predictive alerts to notify operators and maintenance teams via email, SMS, or mobile app.
Continuous Improvement Loop
Establish a feedback mechanism where maintenance outcomes are recorded and used to retrain models, improving prediction accuracy over time. Conduct quarterly reviews to adjust thresholds and incorporate new failure modes.
Comparison of Traditional vs. AI-Based HRSG Monitoring
| Aspect | Traditional Monitoring | AI-Based Monitoring |
|---|---|---|
| Inspection Frequency | Annual or semi-annual | Continuous real-time |
| Failure Detection | After failure occurs | Weeks before failure |
| Data Sources | Manual logs, limited sensors | DCS, PLC, CMMS, acoustic, ultrasonic |
| Decision Support | Reactive, based on experience | Predictive, data-driven |
| Cost Impact | High emergency repair costs | Planned maintenance, lower costs |
| Accuracy | Subjective, variable | >90% prediction accuracy |
| Scalability | Labor-intensive | Automated, scalable across units |
Transform Your HRSG Maintenance Strategy with AI
Leverage real-time analytics to predict tube leaks, optimize drum level control, and enhance attemperator performance. Schedule a demo to see the platform in action.
Advanced Analytics for Drum Level Monitoring
Drum level control is critical for HRSG safety and efficiency. Improper drum level can lead to water carryover into the superheater, causing thermal shock and tube damage, or low drum level exposing tubes to dryout and overheating. Traditional control systems use three-element feedwater control (drum level, steam flow, feedwater flow) but are susceptible to sensor drift, valve stiction, and tuning issues. AI analytics enhance drum level monitoring by analyzing transient responses during load changes, start-ups, and shutdowns. Machine learning models can detect early signs of control loop degradation, such as increased settling time, overshoot, or oscillation frequency. For example, a gradual increase in drum level overshoot from 2% to 5% over several weeks may indicate a failing feedwater valve or calibration drift in the level transmitter. By correlating drum level data with attemperator flow and tube wall temperatures, AI can identify root causes of instability and recommend corrective actions before they escalate into forced outages.
Key Performance Indicators for HRSG Health
Tube Wall Thinning Rate
Measured in mm/year. A rate exceeding 0.1 mm/year indicates accelerated corrosion or erosion requiring immediate investigation.
Drum Level Variability
Standard deviation of drum level over a 24-hour period. Values above 3% suggest control instability or sensor issues.
Attemperator Spray Flow Deviation
Difference between actual and expected spray flow for given load. Deviations >10% indicate valve wear or blockage.
Feedwater Heater Terminal Temperature Difference
Increase of more than 5°C from baseline suggests fouling or tube leakage reducing heat transfer.
Condensate Conductivity
Rise above 0.3 µS/cm indicates contamination from cooling water in-leakage or corrosion products.
Stack Opacity
Increase above 10% may indicate incomplete combustion or heat transfer surface fouling.
Attemperator Performance Optimization
Attemperators (desuperheaters) control steam temperature by injecting spray water into the superheater outlet. Performance degradation manifests as inability to maintain setpoint temperature, excessive spray water consumption, or temperature oscillations. Root causes include erosion of spray nozzles, blockage of water lines, or control valve wear. AI analytics continuously monitor attemperator performance by comparing actual steam temperature response to expected behavior under varying load conditions. An LSTM-based model can predict steam temperature 30 minutes ahead, enabling proactive adjustments to spray water flow. Additionally, anomaly detection algorithms flag unusual patterns such as rapid temperature drops or sustained deviations that indicate nozzle erosion or valve stiction. By integrating attemperator data with tube wall temperature measurements, AI can identify localized hot spots that require immediate attention. This holistic approach reduces steam temperature variability, improves turbine efficiency, and extends the life of downstream components.
Data Fusion and Multi-Sensor Correlation
The power of AI condition monitoring lies in its ability to fuse data from multiple sensors and systems to create a comprehensive view of HRSG health. For example, a tube leak may be preceded by subtle changes in tube wall temperature, increased acoustic emission, and slight pressure drop across the affected section. Individually, these signals may be dismissed as noise, but together they form a strong predictive pattern. AI algorithms, particularly ensemble methods and deep learning, can automatically learn these multi-dimensional correlations from historical data. In practice, a gradient boosting model trained on 10 years of operational data from a combined-cycle plant achieved 95% accuracy in predicting tube leaks 14 days in advance, using inputs from 200+ sensors. This level of insight enables maintenance teams to plan interventions during scheduled outages, eliminating emergency shutdowns and reducing maintenance costs by 40%.
Cost-Benefit Analysis of AI Implementation
| Cost Category | Traditional Approach | AI Approach | Savings |
|---|---|---|---|
| Annual forced outage cost | $1,500,000 | $300,000 | $1,200,000 |
| Annual maintenance labor | $500,000 | $350,000 | $150,000 |
| Annual spare parts inventory | $200,000 | $150,000 | $50,000 |
| Annual lost production | $2,000,000 | $400,000 | $1,600,000 |
| Total annual cost | $4,200,000 | $1,200,000 | $3,000,000 |
Integration with Existing Plant Systems
Successful AI implementation requires seamless integration with existing plant infrastructure. The iFactory platform connects to OPC-UA, Modbus, and MQTT protocols to ingest data from DCS, PLC, and edge devices. Data is processed in real-time using stream processing engines (e.g., Apache Kafka, Flink) and stored in a time-series database for historical analysis. The platform also integrates with CMMS (e.g., SAP, Maximo) to automatically create work orders when predictive alerts are triggered. APIs allow custom dashboards to be embedded in existing HMI systems, providing a unified user experience. Security is paramount: all data is encrypted in transit and at rest, with role-based access control ensuring that only authorized personnel can view sensitive information. The platform is designed to be deployed on-premises or in the cloud, depending on plant requirements and data governance policies.
Case Study: AI-Driven HRSG Monitoring at a 500 MW Combined-Cycle Plant
Challenge
Frequent tube leaks in the low-pressure superheater caused 3 forced outages per year, each lasting 10 days and costing $1.2 million in lost revenue and repairs.
Solution
Deployed AI condition monitoring on 12 tube bundles, 2 drums, and 4 attemperators. Integrated 150 sensors and trained models on 5 years of historical data.
Results
Reduced forced outages to zero in the first year. Predicted 2 tube leaks 14 days in advance, allowing planned repairs during scheduled outages. Achieved 40% reduction in maintenance costs.
ROI
Total investment of $800,000 yielded $3.6 million in savings in the first year, representing a 4.5x return on investment.
Regulatory Compliance and Reporting
HRSG operators must comply with stringent environmental and safety regulations, including EPA emissions limits, OSHA safety standards, and industry-specific codes such as ASME Section I for boiler construction. AI condition monitoring supports compliance by providing auditable data on equipment condition, maintenance actions, and emissions performance. For example, continuous monitoring of stack emissions ensures that NOx and CO levels remain within permit limits, while predictive maintenance reduces the risk of tube leaks that could release hazardous steam or cause fires. The platform generates automated compliance reports that can be submitted to regulatory agencies, saving engineering teams hours of manual data collection and analysis. Additionally, the system logs all alerts and actions taken, creating a comprehensive maintenance history that supports ISO 55000 asset management certification.
Frequently Asked Questions
Ready to Eliminate HRSG Forced Outages?
Implement AI-driven condition monitoring to predict tube leaks, optimize drum level control, and enhance attemperator performance. Schedule your demo today.