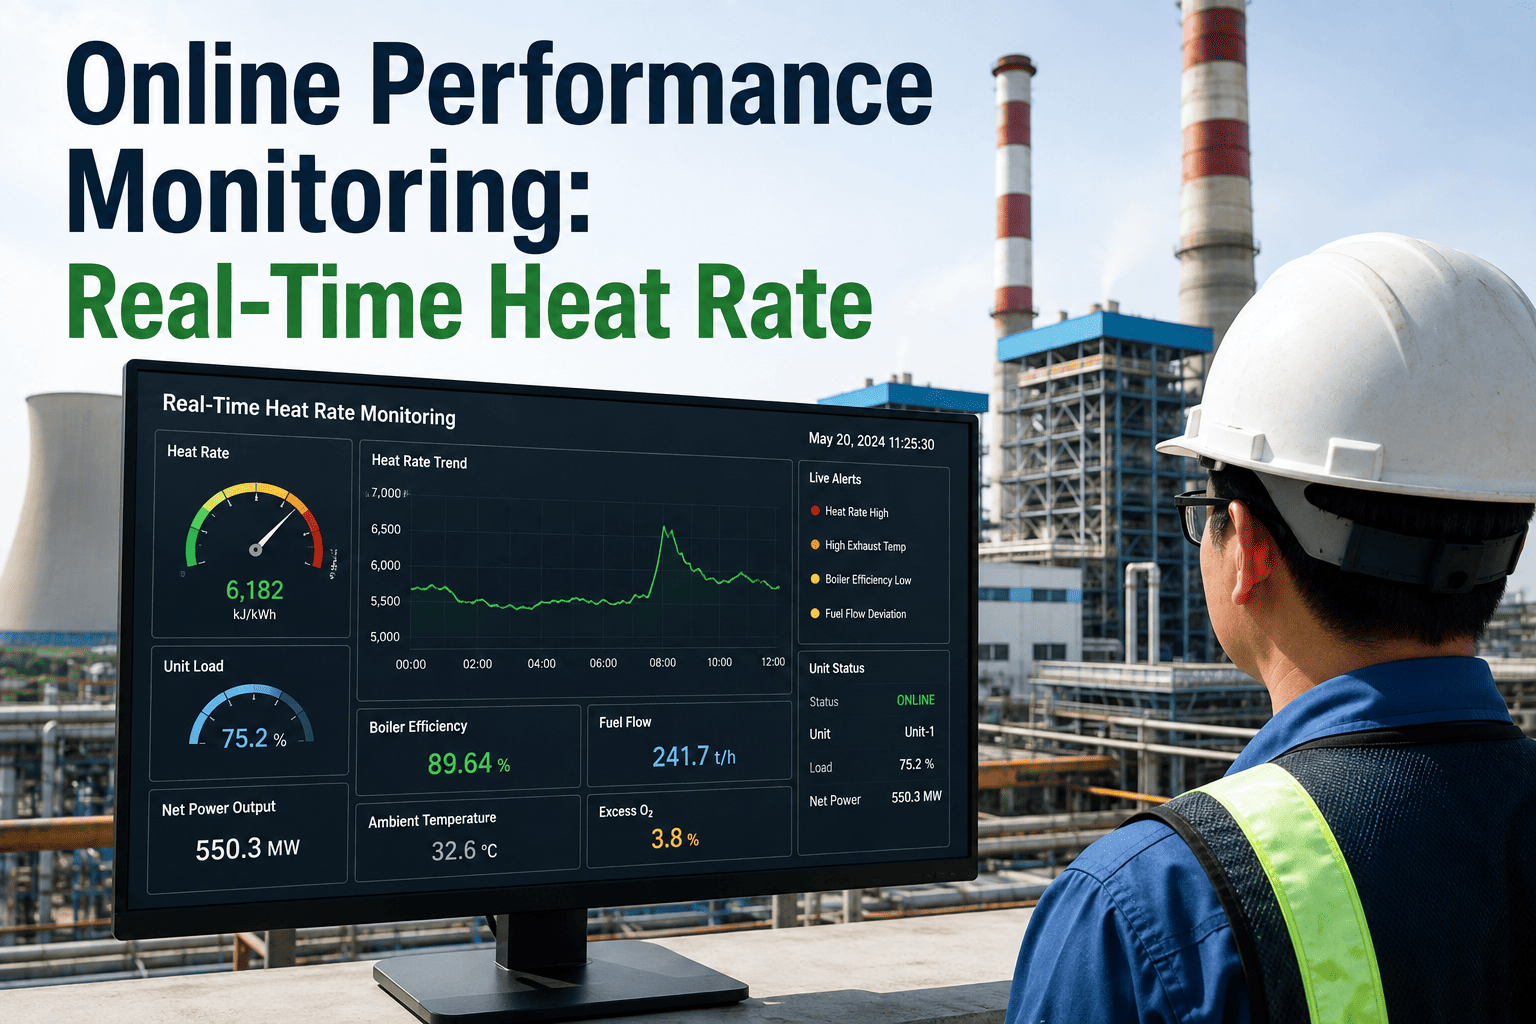
Online Performance Monitoring: Real-Time Heat Rate

By Johnson on August 17, 2026

performance-monitoring-system-online-heat-rate-tracking

Online performance monitoring systems give plant operators continuous visibility into heat rate — the fundamental measure of thermal efficiency — instead of waiting for a monthly performance report to reveal that the unit has been burning extra fuel for weeks. Most power plants have the sensor infrastructure to calculate heat rate in real time, but the data sits in the DCS as individual measurement points that nobody aggregates into a live efficiency metric. An online performance monitoring platform pulls those existing signals together, corrects them for ambient conditions and load level, and presents the operator with a heat rate number that updates continuously along with a breakdown of which controllable losses are contributing to any deviation from the expected baseline. You can book a demo to see how real-time heat rate tracking works on your unit's existing instrumentation.

ONLINE PERFORMANCE MONITORING · HEAT RATE TRACKING · REAL-TIME EFFICIENCY

Online Performance Monitoring — Stop Waiting for the Monthly Report to Find Out Your Heat Rate Dropped

Continuous heat rate calculation from existing plant sensors, corrected to reference conditions in real time, with controllable loss breakdowns that tell the operator exactly where efficiency is leaking and what to adjust right now.

THE VISIBILITY PROBLEM

The Heat Rate Visibility Gap — When Degradation Happens vs. When You Find Out

Heat rate does not degrade in a single step. It drifts incrementally as controllable parameters shift away from their optimal values — a condenser backpressure that creeps up over several days, a superheat temperature that settles a few degrees below target, an excess air level that drifts upward as fuel quality changes. Each individual drift is small enough that it does not trigger an alarm, but the cumulative effect on heat rate can be significant. The problem is that without continuous monitoring, the operator has no way to see the cumulative effect until a periodic performance test or monthly efficiency report reveals it — by which point the excess fuel has already been consumed. The timeline below illustrates the typical delay between when heat rate begins to degrade and when it is actually identified without an online monitoring system in place.


Hour 0
Heat Rate Begins Degrading
A controllable parameter — condenser cleanliness, excess air, spray water flow, reheat temperature — begins drifting from its optimal value. The individual parameter change is too small to trigger a DCS alarm, and the operator has no aggregate efficiency metric to consult.

Hours 2 to 8
Fuel Waste Accumulates Unseen
The unit continues operating with the degraded parameter. Depending on which parameter is drifting and by how much, excess fuel consumption can range from 0.5% to 3% of total heat input. On a 500 MW unit at 60% load, this translates to hundreds of dollars per hour in unnecessary fuel cost that is invisible to the control room.

Shift Change
No Efficiency Handover Occurs
The incoming shift receives a handover that covers equipment status, pending work orders, and any active alarms. Heat rate is not part of the handover because there is no live number to communicate. The degraded condition is inherited by the new crew without anyone knowing it exists.

Days 1 to 7
Daily Reports Show Individual Parameters, Not Heat Rate
Daily operating logs may record individual values like condenser backpressure, superheat temperature, and flue gas oxygen, but these are viewed as separate data points rather than as contributors to a single efficiency metric. The connection between a 0.3 kPa increase in backpressure and its specific heat rate impact is not calculated or displayed.

Day 30
Monthly Performance Report Finally Quantifies the Loss
A backward-looking performance calculation using averaged data reveals that the unit's heat rate was 200 to 500 kJ/kWh above the expected baseline for much of the month. The fuel cost of that degradation over 30 days is now a sunk cost that cannot be recovered, and the root cause may no longer be active, making diagnosis difficult.
SYSTEM ARCHITECTURE

Five Layers Between Raw Sensor Signals and Actionable Heat Rate Intelligence

An online performance monitoring system does not simply display heat rate as a single number. It constructs that number through a series of processing layers, each adding value to the raw plant data. Understanding these layers helps engineers evaluate whether a monitoring platform is genuinely calculating heat rate or merely displaying a derived value from the DCS without the corrections that make it meaningful for performance management.

1
Sensor Data Acquisition
The platform reads existing plant instrumentation — steam temperatures and pressures at turbine inlet and extraction points, feedwater flow, fuel flow, condenser backpressure, flue gas oxygen and temperature, ambient conditions — at a scan rate fast enough to capture transient behavior. No new sensors are required for a standard heat rate calculation; the platform uses what the plant already has installed for control and protection purposes.
2
Data Validation and Reconciliation
Raw sensor readings are checked against physical limits, rate-of-change limits, and cross-references with redundant measurements. A steam temperature reading that jumps 50 degrees in one scan is flagged and replaced with a validated estimate. Mass and energy balances around the boiler and turbine are closed to within a defined tolerance, and measurement biases are identified and corrected so that the heat rate calculation is not distorted by a single drifting sensor.
3
Correction to Reference Conditions
Raw heat rate changes with load level, ambient temperature, ambient humidity, cooling water temperature, and fuel heating value. An uncorrected heat rate number is nearly useless for performance comparison because it conflates changes the operator can control with changes driven by external conditions. The platform applies correction curves — typically based on OEM performance data or ASME PTC correction factors — to normalize the calculated heat rate to a set of reference conditions, producing a number that reflects only the controllable component of efficiency.
4
Controllable Loss Decomposition
The corrected heat rate deviation is broken down into individual loss components: excess air loss, superheat temperature deviation, reheat temperature deviation, condenser backpressure loss, feedwater temperature loss, spray water loss, and other controllable categories. Each loss is quantified in kJ/kWh and ranked by magnitude so the operator can see at a glance which parameter is contributing the most to the current heat rate deviation and where an adjustment will have the largest impact.
5
Operator Guidance and Trending
The processed data is presented through an interface that highlights actionable information rather than overwhelming the operator with raw numbers. Current heat rate, deviation from baseline, and the top three controllable losses are displayed prominently. Historical trending shows whether heat rate has been improving or degrading over hours, days, and weeks. Alert thresholds trigger notifications when a controllable loss exceeds a defined magnitude, directing the operator to the specific parameter that needs attention.
LOSS CLASSIFICATION

Controllable vs. Non-Controllable Losses — Why the Distinction Determines What the Operator Can Actually Fix

Not every heat rate deviation is within the operator's ability to correct. Ambient temperature changes, load dispatch commands, and fuel quality variations all affect heat rate, but the operator cannot change any of them. What the operator can change are the controllable parameters — the setpoints, valve positions, and equipment configurations that determine how efficiently the unit converts fuel input into electrical output at whatever load level and ambient condition the grid and weather have imposed. An online performance monitoring system that fails to separate controllable from non-controllable losses forces the operator to guess whether a heat rate deviation is something they should act on or something they should accept, and that guesswork defeats the purpose of real-time monitoring.

CONTROLLABLE
Operator Can Act On These

Excess air level in the furnace — adjusted through FD fan speed, damper position, or oxygen trim setpoint to maintain target O2 at the economizer outlet

Main steam and reheat temperature — adjusted through spray water flow, burner tilt, or gas recirculation to hold temperature at the target value for the current load

Condenser backpressure — influenced by cooling water flow, condenser cleanliness, and air removal system performance, all of which the operator can monitor and adjust

Feedwater temperature — affected by extraction steam valve positions and feedwater heater level control, which determine how much extraction heat is recovered

Spray water consumption — controlled through desuperheater and attemperator valve management to minimize unnecessary injection
NON-CONTROLLABLE
External Factors, Not Operator Actionable

Ambient dry-bulb temperature — affects condenser cooling, combustion air density, and boiler efficiency through correction curves that the monitoring system applies but the operator cannot change

Unit load level — dispatched by the grid or dictated by generation contract, the load point determines the baseline heat rate through the turbine's inherent part-load efficiency characteristic

Fuel heating value and moisture content — determined by fuel supply quality, these affect the boiler efficiency calculation and the amount of fuel required for a given steam output

Cooling water inlet temperature — determined by the cooling tower performance and ambient wet-bulb temperature, this sets a floor for achievable condenser vacuum

Equipment age-related degradation — fouling, erosion, and wear that accumulate between maintenance outages and can only be fully addressed during a scheduled shutdown
CONTROLLABLE LOSS DEEP DIVE

Six Loss Categories That Account for Most of the Heat Rate Deviation on a Running Unit

On a typical fossil-fired unit, six controllable loss categories account for 80% to 90% of the total controllable heat rate deviation. An online performance monitoring system that quantifies these six categories in real time gives the operator a prioritized action list that directly maps to fuel cost reduction. The impact ranges shown below are typical for a 500 MW subcritical coal unit at 60% to 80% load, but the relative ranking is consistent across most unit types and sizes.

Highest Impact

Excess Air Loss

Operating with oxygen above the optimal level for the current load and fuel condition increases flue gas mass flow, which increases sensible heat loss up the stack and reduces boiler efficiency. A 1% increase in O2 above the optimal target typically increases heat rate by 0.3% to 0.5%. The optimal O2 level itself changes with load — lower loads require more excess air for complete combustion, so the target must be load-dependent, not a fixed setpoint.

High Impact

Condenser Backpressure Loss

Every 0.1 kPa increase in condenser backpressure above the design value for current cooling water temperature increases heat rate by approximately 0.05% to 0.08%. Backpressure degradation is caused by condenser tube fouling, air in-leakage, or reduced cooling water flow — all of which develop gradually and are difficult to detect without continuous monitoring of the backpressure deviation from the expected value for current conditions.

High Impact

Reheat Temperature Deviation

Operating reheat temperature below its target reduces the enthalpy of steam entering the intermediate-pressure turbine, which directly reduces the work output per unit of heat input. A 10 degree C reheat temperature shortfall typically increases heat rate by 0.2% to 0.3%. Reheat temperature control is particularly challenging at part-load because the gas temperature profile through the reheater changes with load and burner configuration.

Moderate Impact

Main Steam Temperature Deviation

Similar to reheat temperature, operating main steam below its target reduces the enthalpy available for work extraction in the high-pressure turbine. A 10 degree C main steam temperature shortfall typically increases heat rate by 0.15% to 0.25%. Main steam temperature is generally better controlled than reheat temperature because it has a dedicated spray attemperator with faster response, but it can still drift at part-load when spray water system dynamics change.

Moderate Impact

Feedwater Temperature Loss

Feedwater temperature entering the economizer is determined by the performance of the feedwater heater train. If a heater is out of service, bypassed, or operating with a low extraction steam flow due to level control problems, the feedwater temperature drops and the boiler must add more fuel to achieve the same steam output. A 5 degree C reduction in final feedwater temperature typically increases heat rate by 0.1% to 0.15%.

Variable Impact

Spray Water and Auxiliary Steam Losses

Excessive spray water in the superheat or reheat attemperation systems, and auxiliary steam extraction for sootblowing, heating, or other services, represent heat that bypasses the turbine and reduces overall cycle efficiency. The impact varies widely depending on unit configuration and operating practices, but spray water waste alone can account for 0.1% to 0.5% of heat rate on units with poorly tuned desuperheater control loops.

Stop Calculating Heat Rate Once a Month When You Could Calculate It Every Minute

See how continuous heat rate tracking with controllable loss decomposition turns your existing sensor data into a real-time efficiency dashboard that drives operator action.

PART-LOAD EFFICIENCY

Why Part-Load Operation Makes Continuous Heat Rate Monitoring More Critical, Not Less

There is a persistent misconception in some plant organizations that heat rate tracking matters most at full load and becomes less important as load decreases. The reasoning is that at lower loads the total fuel consumption is lower, so the absolute dollar value of efficiency losses is smaller. This logic is flawed for three reasons that together make part-load operation the regime where online monitoring delivers the most value per megawatt generated.

A
Heat Rate Degrades Faster at Part-Load, So Losses Are Magnified as a Percentage

The turbine's internal efficiency decreases at lower steam flows because fixed losses — blade tip leakage, windage, moisture losses — represent a larger fraction of total stage work. The boiler's efficiency also changes because the fraction of heat lost through radiation and convection stays roughly constant while the useful heat transfer to steam decreases. This means a given controllable parameter deviation — say, 2% excess oxygen — produces a larger heat rate impact at 50% load than the same deviation would produce at 100% load, when expressed as a percentage of the already-degraded part-load baseline.

B
Control Loops Are Tuned for Full Load and Become Less Effective as Load Drops

As documented in the context of spray water optimization, PID control loops that are stable at full load begin to exhibit oscillation, sluggishness, or sustained offset at part-load because the process dynamics change. Excess air control, steam temperature control, and condenser level control all face the same challenge. The result is that controllable losses naturally increase at part-load even if the operator makes no errors, because the control system is not performing as well as it does at full load. Without monitoring, the operator has no way to see this degradation or to distinguish it from the non-controllable component of part-load heat rate change.

C
Units Spend More Hours at Part-Load, So the Cumulative Waste Is Larger

A 500 MW unit that operates at full load for 2,000 hours and at 50% to 70% load for 5,000 hours in a year will burn more total fuel during part-load operation than during full-load operation, because the lower efficiency is partially offset by the much longer operating duration. Any controllable loss that persists during those 5,000 part-load hours accumulates more total fuel waste than the same loss would cause during fewer full-load hours. This makes part-load the high-leverage regime for efficiency improvement, and it makes continuous monitoring during part-load operation the highest-return monitoring application.

PERFORMANCE COMPARISON

Unit Efficiency Visibility — Before and After Online Performance Monitoring

The following table compares typical efficiency management capabilities on a 400 MW coal-fired unit before and after deploying an online performance monitoring system. The before state represents a unit relying on monthly performance calculations, DCS trend reviews, and periodic ASME PTC-style testing. The after state represents the same unit after six months of continuous online monitoring with controllable loss decomposition.

Capability Before Online Monitoring After Online Monitoring
Heat rate calculation frequency Monthly, using averaged daily data Continuous, updated every 1 to 5 minutes
Time to detect a controllable loss onset Days to weeks, depending on magnitude Minutes to hours, with automated alerts
Controllable loss decomposition Not available; total deviation only Six to eight individual loss categories, ranked by magnitude
Correction for ambient and load conditions Applied retroactively in monthly report Applied in real time to every calculation
Operator visibility during shift No live heat rate number on DCS screens Heat rate, deviation, and top losses displayed continuously
Shift handover of efficiency status Not included in standard handover Current heat rate deviation and active losses communicated
Identification of gradual degradation trends Visible only in monthly report comparisons Trending visible in real time, with degradation rate calculated
Data validation and sensor bias detection Performed manually during performance tests Automated on every scan, with bias alerts

The most impactful change in this comparison is not the calculation frequency itself but the shift from retrospective reporting to real-time operator awareness. A monthly report can tell you what happened last month, but it cannot change what the operator does during the current shift. Online monitoring changes the operator's behavior by making efficiency visible and actionable in the moment, which is where the fuel savings are actually created or lost.

FREQUENTLY ASKED QUESTIONS

Questions Plant Engineers Ask About Online Heat Rate Monitoring Systems

Does online performance monitoring replace the ASME PTC performance test, or is it a different tool for a different purpose?
Online monitoring and ASME PTC testing serve complementary but different purposes. An ASME PTC test is a high-precision, instrument-intensive procedure designed to establish a contractual or regulatory efficiency baseline with a defined uncertainty bound, typically performed at a specific load point under controlled conditions. Online monitoring is a continuous, lower-precision but high-frequency tool designed to track deviations from that baseline during normal operation and to identify controllable losses in real time. The online system uses the PTC test result — or the OEM design guarantee — as its reference baseline, and it tracks how the unit's corrected heat rate deviates from that baseline as operating conditions and equipment conditions change. Book a demo to see how a baseline is established and used for continuous tracking.
How accurate is the online heat rate calculation compared to a formal performance test?
A well-implemented online system typically achieves a heat rate uncertainty of 1.5% to 2.5% on a continuous basis, compared to 0.5% to 1.0% for a formal ASME PTC test with dedicated instrumentation. This difference in absolute accuracy is acceptable because the purpose of online monitoring is not to establish a contractual heat rate number but to detect changes and trends over time. A 200 kJ/kWh shift in heat rate is detectable and meaningful even if the absolute uncertainty of the calculation is 300 kJ/kWh, because the systematic biases that contribute to absolute uncertainty tend to cancel out when tracking changes from a baseline. The platform also performs ongoing sensor validation to minimize bias drift and maintain the best achievable accuracy with the installed instrumentation. Contact support to discuss accuracy expectations for your unit's instrumentation.
Can the system handle units that frequently change load, or does it require steady-state operation to produce a valid heat rate number?
The platform is designed to handle transient and cycling operation by applying dynamic correction algorithms that account for thermal inertia in the boiler and turbine during load changes. During rapid ramps, the heat rate calculation uses a shorter averaging window and flags the result as transient-condition data so the operator knows the number has wider uncertainty. Once the unit stabilizes at a new load point, the calculation converges to its normal accuracy within a few minutes. For units that cycle frequently, the platform also tracks average heat rate over defined operating periods — per shift, per day, or per load band — so that efficiency trends are visible even when individual readings are noisy during transients. Book a session to review cycling unit performance tracking.
What happens when a key sensor fails — does the entire heat rate calculation stop?
The platform is designed to degrade gracefully when individual sensors fail or produce unreliable readings. Each input to the heat rate calculation has a defined fallback strategy: if the primary feedwater flow meter fails, the platform can estimate feedwater flow from condensate flow, turbine first-stage pressure, or other correlated measurements. If a steam temperature sensor fails, the platform can use adjacent temperature readings or a short-term hold of the last validated value with an appropriate uncertainty flag. The heat rate calculation continues to run with whatever validated inputs are available, and the display clearly indicates which inputs are estimated and what the estimated uncertainty impact is. This approach ensures that the operator always has a heat rate number to work with, even if its accuracy is temporarily reduced. Talk to support about sensor fallback strategies for your unit.
How long does it take to deploy an online performance monitoring system on an existing unit?
A typical deployment for a single unit takes four to eight weeks from project kickoff to initial operation, depending on the complexity of the unit configuration, the quality of existing instrumentation, and the availability of a reference baseline such as a recent performance test or OEM guarantee data. The first two to three weeks are spent on data mapping — identifying which DCS tags correspond to the required measurements, verifying signal quality and scan rates, and configuring the communication interface. The next one to two weeks are used to build and validate the heat rate calculation model against known operating data. The final one to three weeks are used for operator training, display configuration, and tuning of alert thresholds. The platform begins producing useful heat rate numbers within the first week of data connection, and the full controllable loss decomposition is typically operational within three to four weeks. Book a demo to get a deployment timeline scoped for your plant.
SENSORS · CORRECTIONS · LOSSES · GUIDANCE — ONE EFFICIENCY LOOP

Give Every Shift Operator a Live Heat Rate Number and a Prioritized Loss List

Continuous online performance monitoring that turns your existing plant instrumentation into a real-time efficiency dashboard with controllable loss decomposition — catching heat rate degradation in minutes instead of months.
Share This Story, Choose Your Platform!