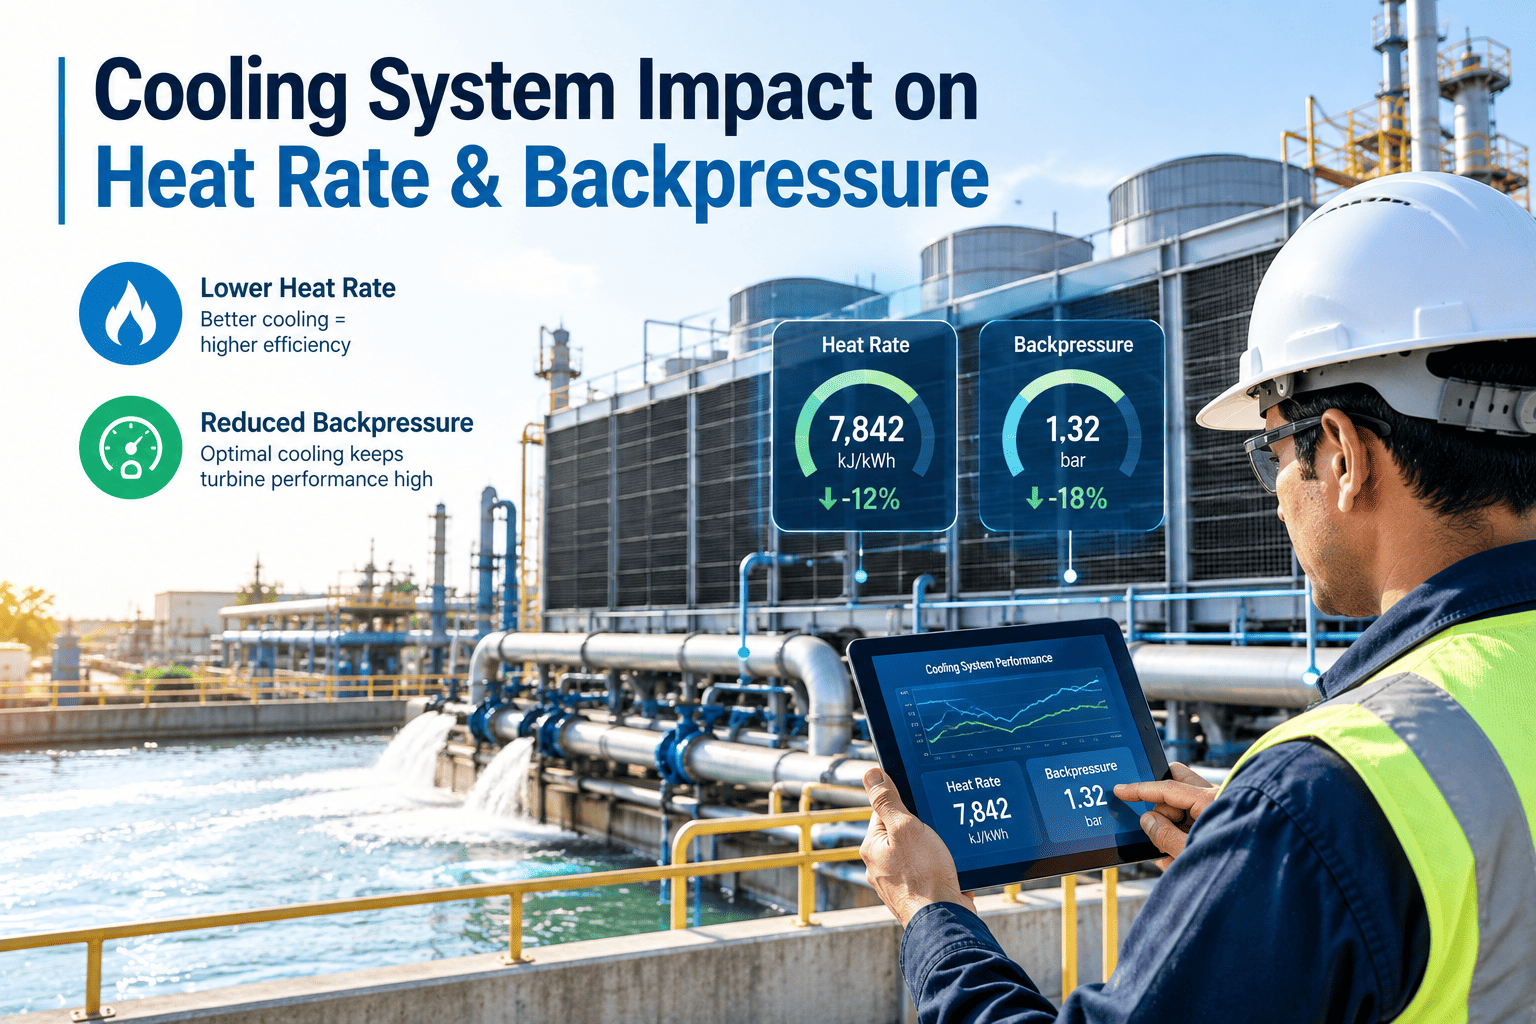
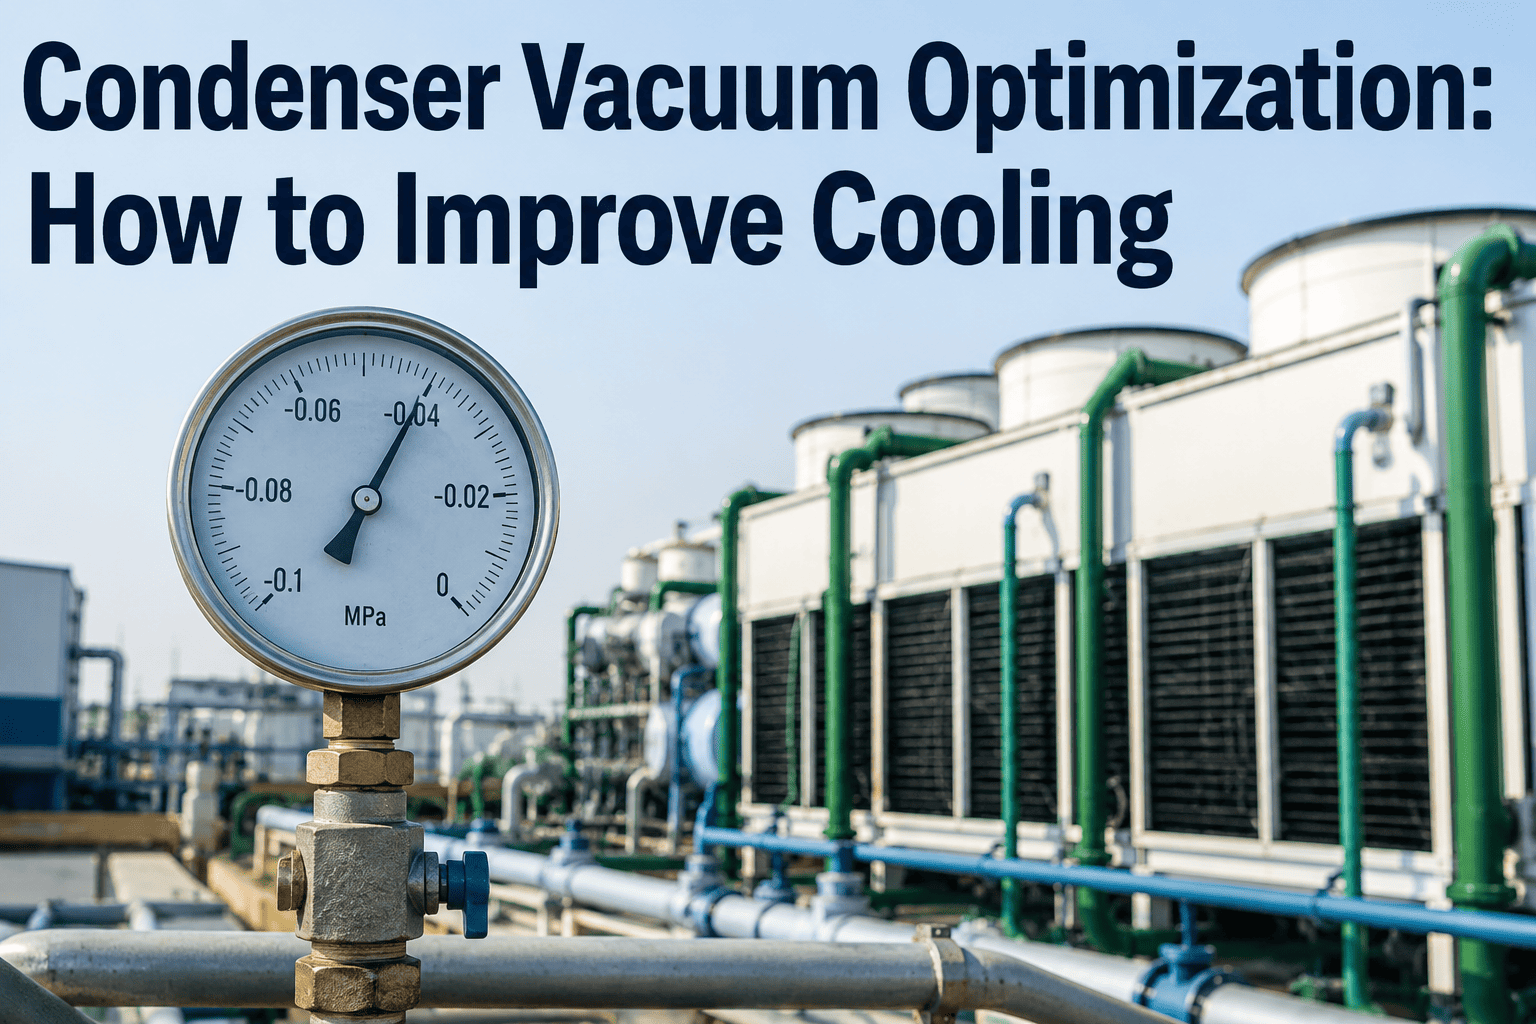
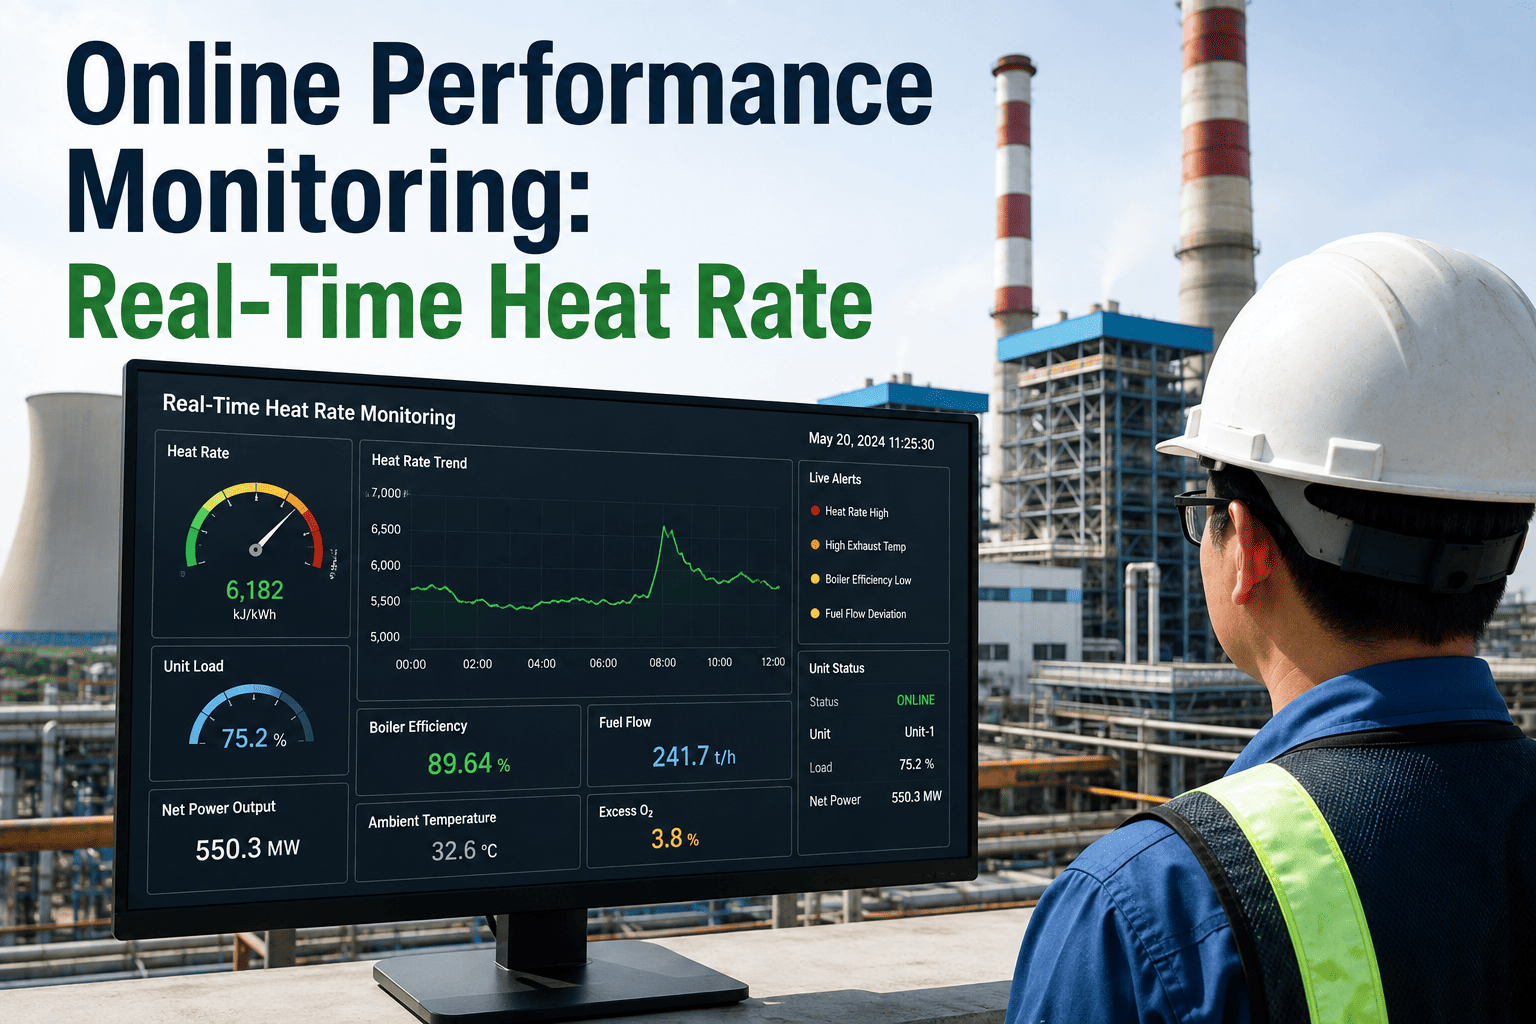
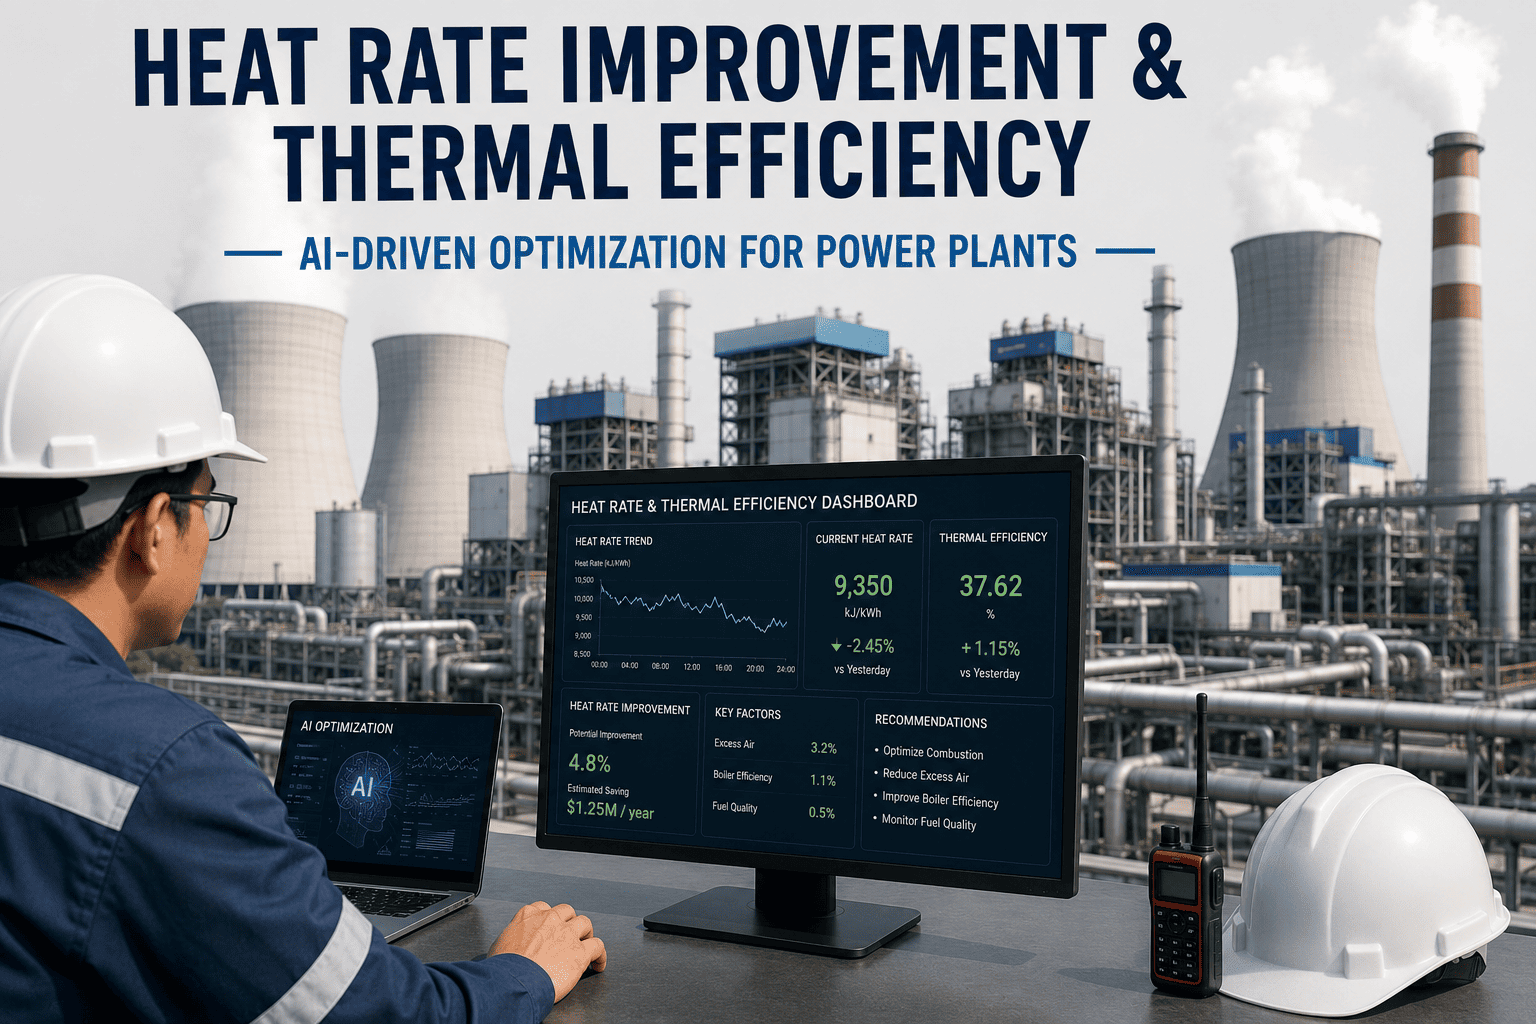
Condenser backpressure creeps upward so gradually that most plants never see it happen — a few thousandths of an inch of mercury lost to tube fouling this month, a little more to a cooling tower fill degrading next month, until a heat rate review eighteen months later shows the unit quietly burning noticeably more fuel for the same output than it did when the condenser was clean. Backpressure is one of the few performance losses in a power plant that translates directly and predictably into a fuel cost number, and it is also one of the easiest to let drift because nothing alarms, nothing trips, and the turbine keeps running — just less efficiently than it should. Continuous backpressure and heat rate correlation exists to catch that drift while it is still a cleaning job rather than a budget line, as explained in more detail at ifactory.
Cooling System Optimization · Heat Rate
Cooling System Impact on Heat Rate: Turning Backpressure Into a Number You Can Manage
Each 1 inHg improvement in condenser vacuum typically delivers a 1.5 to 3 percent heat rate improvement — continuous backpressure monitoring correlated against cooling system performance shows exactly where that margin is being lost and what it is costing every day it goes uncorrected.
The Invisible Fuel Cost
Why Backpressure Drift Rarely Shows Up Until the Heat Rate Review
Backpressure does not fail — it drifts. Tube fouling accumulates gradually, cooling tower fill degrades over a season, circulating water flow slips as strainers foul, and each of these individually small changes pushes condenser vacuum a little further from design. None of it trips an alarm or shows up on a control room screen in a way that draws attention, because the unit keeps generating at load. The only place the loss becomes visible is a periodic heat rate test or a fuel cost review, by which point months of avoidable fuel spend have already passed.
1.5–3%
Heat rate improvement per 1 inHg of vacuum gained
Condenser vacuum has one of the most direct, well-documented relationships to unit heat rate of any single performance parameter on the plant.
Months
Typical time before backpressure drift is noticed
Without continuous tracking, fouling and cooling tower degradation accumulate quietly until a scheduled heat rate test finally reveals the loss.
0
Alarms triggered by gradual fouling on most units
A slowly rising backpressure trend rarely crosses a hard alarm limit, so it never draws control room attention the way a trip or excursion would.
Daily
Fuel cost impact once backpressure is quantified
Correlating live backpressure against heat rate turns an abstract efficiency loss into a daily fuel cost figure that justifies cleaning or maintenance timing.
Where Backpressure Loss Comes From
Four Sources of Backpressure Drift Worth Watching Continuously
Rising backpressure is rarely caused by one single factor — it is usually the combined effect of several cooling system parameters drifting together, each contributing a small fraction of the total loss. Separating these sources is what turns a single vacuum number into an actionable diagnosis of where the fix actually needs to happen.
Condenser Tube Fouling
Scale, biological growth, and debris accumulation on condenser tubes reduce heat transfer efficiency, raising backpressure independently of anything happening on the cooling tower side of the system.
Cooling Tower Approach Temperature
Degraded fill, fouled nozzles, or fan performance loss on the cooling tower raises the temperature of water returning to the condenser, directly limiting how much vacuum the condenser can achieve regardless of tube cleanliness.
Circulating Water Flow
Fouled strainers, pump performance loss, or partially closed valves reduce circulating water flow through the condenser, lowering the cooling capacity available even when tubes and tower are performing normally.
Air In-Leakage
Non-condensable gas ingress through seals, joints, or low-pressure piping degrades vacuum directly and is often the fastest-moving of the four sources, capable of shifting backpressure within a single shift.
What the Monitoring Program Actually Does
Four Capabilities That Turn Vacuum Data Into Action
A backpressure number on a control room screen is only useful if someone can tell whether it is normal for current conditions and, if not, which part of the cooling system is responsible. The value of a dedicated monitoring program comes from combining continuous readings with the correlation and alerting logic that answers both questions automatically.
A
Continuous Backpressure Tracking
Condenser vacuum is logged continuously and normalized against ambient wet-bulb temperature and load, so a true deviation from design is separated from expected seasonal variation.
B
Heat Rate Correlation
Every inch of vacuum lost or gained is translated directly into a heat rate and fuel cost impact, turning an abstract thermodynamic parameter into a number operations and finance both understand.
C
Fouling Factor Calculation
Cleanliness factor is calculated continuously from condenser inlet and outlet temperatures, isolating tube-side fouling from cooling tower or circulating water contributions to the same backpressure trend.
D
Cooling Tower Approach Monitoring
Approach and range temperatures are tracked against design curves, flagging tower-side degradation before it becomes the dominant driver of a rising backpressure trend.
Setting Up the Program
Building a Backpressure Monitoring Program in Four Stages
Moving from periodic heat rate testing to continuous, correlated backpressure monitoring follows a defined sequence, applied consistently against the unit's own design curves so the resulting alerting logic reflects real operating conditions rather than a generic threshold.
Stage 1
Baseline Correlation
Historical heat rate test results, backpressure readings, and cooling system data are analyzed together to establish the unit's own design curve relating vacuum to load and ambient conditions.
Stage 2
Threshold Configuration
Warning and action thresholds are set against expected backpressure for current load and wet-bulb temperature, with margin sized to give the maintenance team planning time before a cleaning window closes.
Stage 3
Continuous Monitoring
Condenser vacuum, cleanliness factor, cooling tower approach, and circulating water data stream continuously into the platform, updating trends and heat rate impact in real time.
Stage 4
Corrective Action Workflow
A confirmed deviation routes into a tracked corrective action — tube cleaning, tower maintenance, or air in-leakage investigation — closing the loop from detection through resolution.
Turn Vacuum Loss Into a Tracked Fuel Cost
Every Reading Continuous. Every Source Correlated. Every Fuel Dollar Quantified.
iFactory tracks condenser vacuum, cooling tower performance, and circulating water data together, translating backpressure drift into the heat rate and fuel cost impact your operations and finance teams both need to see.
From Vacuum Reading to Corrective Action
What Happens Between "Backpressure Rising" and "Vacuum Restored"
01
Continuous Reading Capture
Condenser vacuum, inlet and outlet cooling water temperatures, and cooling tower parameters are logged continuously and time-aligned into a single dataset.
02
Normalization Against Load and Ambient
Readings are normalized against current load and wet-bulb temperature so a true deviation is separated from expected variation across seasons and dispatch conditions.
03
Source Correlation
A deviation is checked against cleanliness factor, cooling tower approach, and circulating water flow to identify which source is most likely driving the change.
04
Heat Rate and Fuel Cost Translation
The deviation is converted into its heat rate impact and an estimated daily fuel cost, giving the finding a business number rather than a raw inHg value.
05
Alert Escalation With Root Cause Context
The alert reaches the responsible engineer or planner with the correlated source data and cost estimate attached, supporting a fast, justified maintenance decision.
06
Post-Action Verification
After cleaning or corrective maintenance, the platform confirms vacuum recovery against the baseline curve, closing the loop and recording the fuel savings achieved.
Reactive vs Continuous Backpressure Management
What Changes When Cooling Performance Is Tracked in Real Time
Periodic heat rate testing remains a useful annual benchmark, but what changes with continuous monitoring is everything that happens between those tests, where drift used to accumulate completely unmeasured until the next scheduled check.
| Performance Factor | Periodic Heat Rate Testing Alone | Continuous Backpressure Monitoring |
| Detection frequency |
Once or twice a year, at scheduled test |
Continuous, updated in real time |
| Root cause visibility |
Aggregate result, no source breakdown |
Separated into tube, tower, flow, and air in-leakage sources |
| Time to detect drift |
Up to a year, until the next scheduled test |
Days to weeks from onset |
| Cleaning and maintenance timing |
Calendar-based or reactive to a complaint |
Justified by measured fuel cost impact |
| Verification of improvement |
Wait for the next annual test |
Confirmed immediately after corrective action |
Industry Standards
Where This Approach Aligns With Established Performance Practice
Backpressure and heat rate correlation is grounded in well-established performance testing and asset management standards that most plant engineering teams already reference, extended here into a continuous rather than periodic measurement approach.
ASME PTC 12.2
The performance test code for steam surface condensers provides the reference methodology this continuous correlation extends from a single test event into ongoing daily tracking.
HEI Standards
Heat Exchange Institute standards for condensers and cooling towers establish the design curves used as the baseline against which live vacuum and approach temperature readings are compared.
ISO 50001
Energy management system requirements call for continuous monitoring of significant energy uses, and condenser backpressure is consistently one of the largest single efficiency levers in a thermal plant.
EPRI Guidelines
Published condenser and cooling tower performance guidelines support the fouling factor and approach temperature calculations used to separate backpressure loss into its contributing sources.
Common Questions
Frequently Asked Questions
How is a 1.5 to 3 percent heat rate improvement per inHg of vacuum actually calculated?
The relationship between condenser vacuum and heat rate comes from the unit's own thermal kinetics — as backpressure drops, the turbine can extract more energy from each pound of steam before it exhausts to the condenser, directly reducing the heat input required for the same output. The exact percentage varies by turbine design, load, and how far current backpressure sits from optimal, which is why baseline correlation against your specific unit's design curve matters more than a generic industry figure. Details on how this correlation is built for a specific unit are covered at
ifactoryapp.com/support.
Can this distinguish between tube fouling and a cooling tower problem, or does it just show backpressure is high?
Yes — the platform calculates cleanliness factor from condenser inlet and outlet temperatures separately from cooling tower approach and range temperatures, so a rising backpressure trend is broken down into its contributing sources rather than reported as a single unexplained number. This distinction matters operationally, since a tube fouling issue calls for a cleaning outage while a tower issue may call for fill inspection or fan maintenance, and conflating the two wastes time and budget on the wrong fix.
Does this require new instrumentation, or can it work with our existing condenser and cooling tower sensors?
Most plants already have the core instrumentation needed — condenser pressure, circulating water inlet and outlet temperatures, and cooling tower approach data typically exist in the control system already. The platform is built to pull from that existing instrumentation and correlate it, rather than requiring a new sensor package, though gaps in specific measurement points can be identified and addressed during initial setup if needed for a complete picture.
How quickly can a detected backpressure deviation be turned into a fuel cost number my finance team will understand?
The translation from vacuum deviation to heat rate impact to daily fuel cost happens automatically as part of the correlation logic, so an engineer reviewing an alert sees the dollar impact alongside the technical reading rather than needing to run a separate calculation. This is often what turns a routine maintenance request into an approved, prioritized work order, since the cost of waiting is stated explicitly rather than left implicit in an inHg number nobody outside operations fully interprets.
How long does it take to get continuous backpressure monitoring running on a first unit?
Most first deployments move from initial data integration to live threshold monitoring within a few weeks, since the work centers on connecting existing condenser and cooling tower instrumentation rather than installing new sensors. Establishing an accurate baseline design curve for the specific unit typically continues in parallel using recent historical heat rate test data, refining thresholds as live readings accumulate.
Book a demo to scope a realistic timeline for your specific units and cooling system configuration.
Stop Letting Backpressure Drift Cost Fuel Silently
Turn Condenser Vacuum Into a Tracked, Actionable Heat Rate Number
iFactory correlates backpressure, cooling tower performance, and fouling data continuously, showing exactly what vacuum loss is costing your plant and when a cleaning or maintenance window will pay for itself.