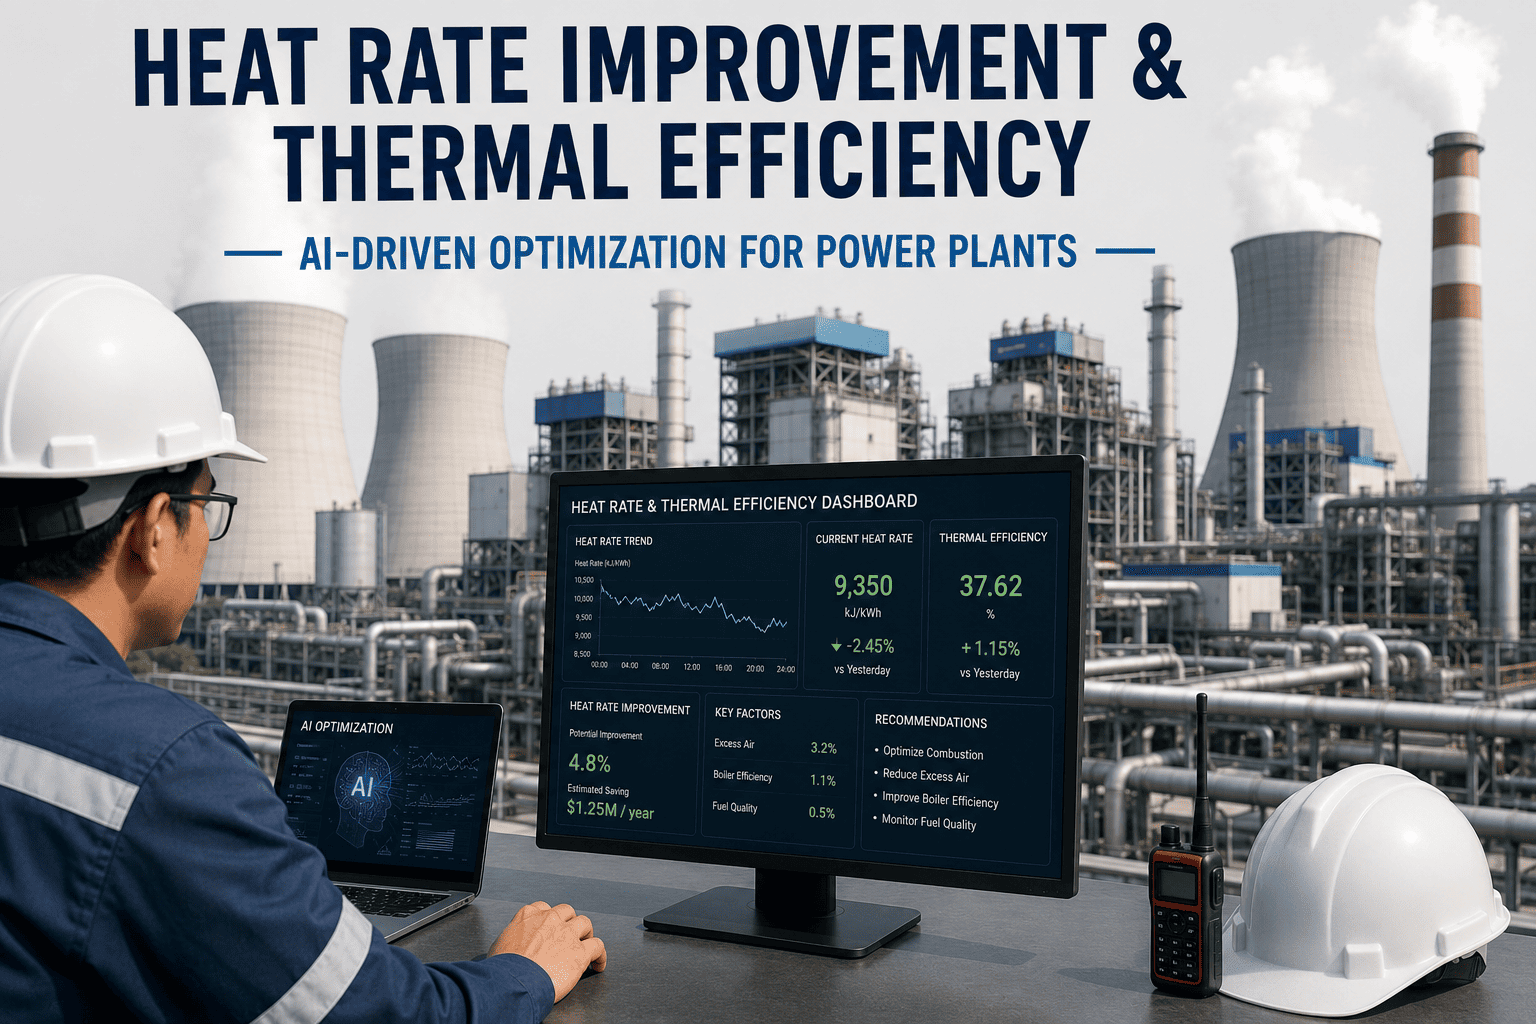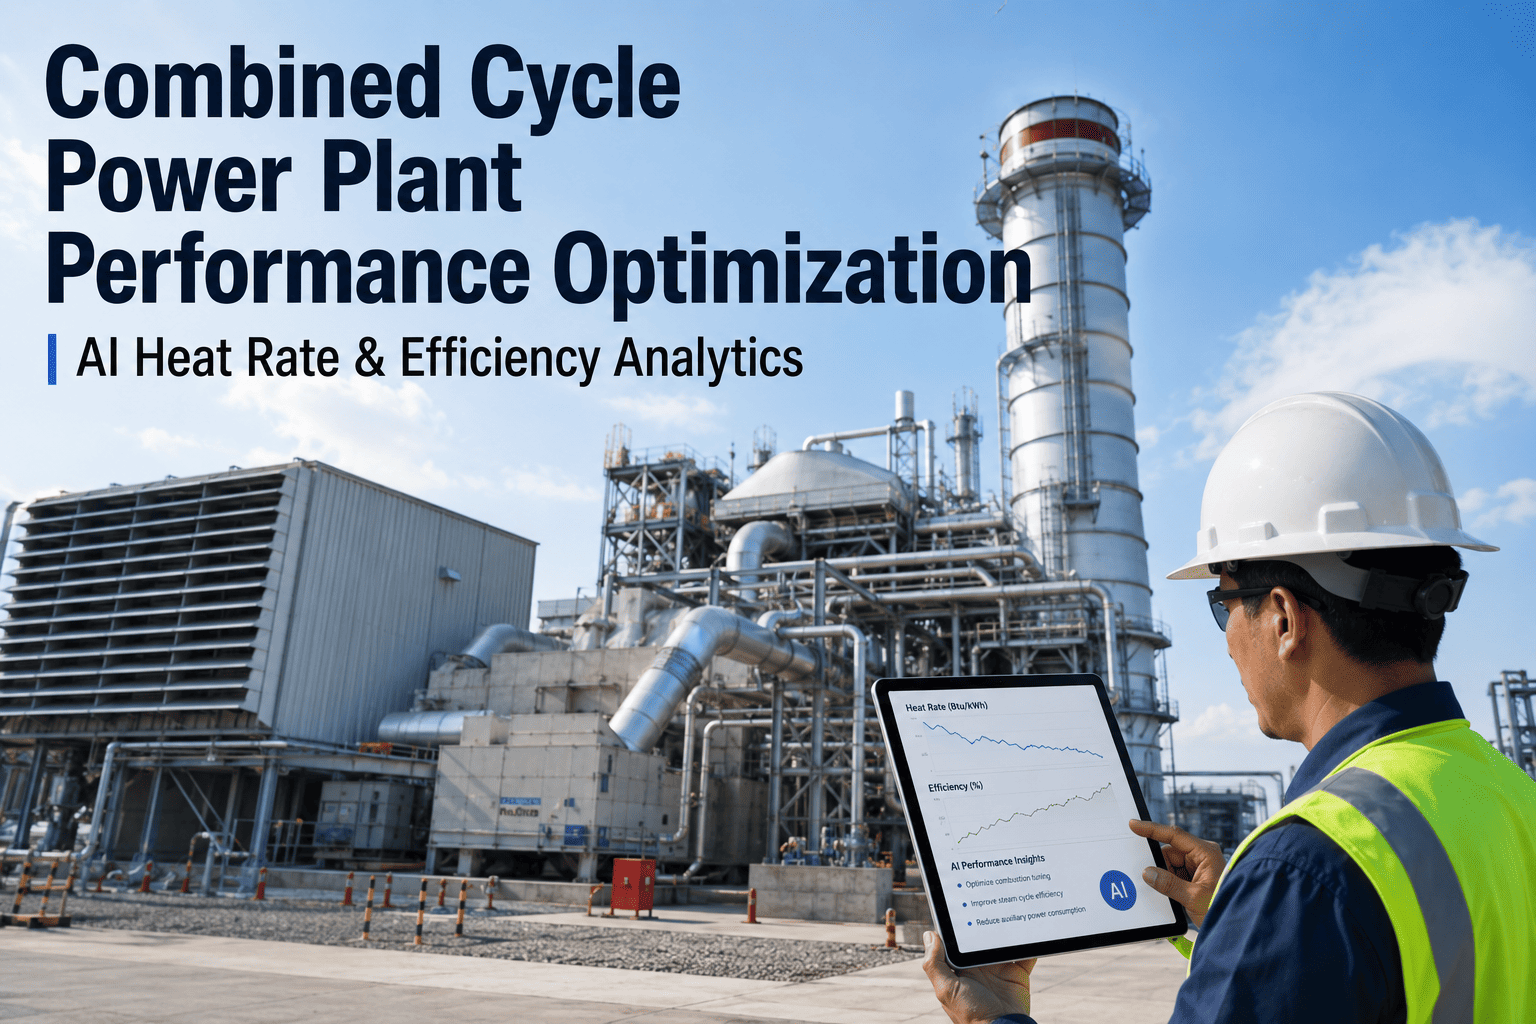
Most power plants have a heat rate improvement list somewhere in a filing cabinet or shared drive, built years ago after an efficiency audit and never revisited since. The problem is not a lack of ideas. It is the absence of a systematic program that continuously identifies losses, tracks them against design targets, and prioritizes the projects that actually move the needle. Plants that treat heat rate as a one-time audit rather than an ongoing discipline typically leave two to four percent of achievable efficiency on the table year after year, which compounds into millions of dollars in unnecessary fuel cost. A systematic program changes that by turning heat rate management into a continuous, measurable, and accountable process. Book a demo to see how a systematic program identifies your top loss opportunities.
Stop Guessing Where Your Heat Rate Losses Are Hiding
iFactory's AI heat rate analytics continuously compare actual performance against design and corrected targets so your team always knows exactly where the next improvement project should go.
Why Heat Rate Drifts Away From Design Over Time
Every plant starts life at or near its design heat rate. The gap that opens up over subsequent years is rarely caused by one dramatic failure. It accumulates from dozens of small, individually forgivable losses that nobody tracks in aggregate.
Four Pillars of a Systematic Heat Rate Program
A durable heat rate improvement program rests on four connected pillars. Removing any one of them turns the program back into an occasional audit rather than a continuous discipline.
Top Loss Categories Ranked by Typical Fuel Cost Impact
Across hundreds of heat rate audits, the same handful of loss categories reappear as the largest contributors, though their exact ranking varies with plant configuration, age, and fuel type.
Standing Up a Systematic Program in Four Phases
Plants that successfully transition from occasional audits to a continuous program typically follow a similar sequence over the first year.
What Systematic Programs Typically Deliver
Who Owns a Systematic Heat Rate Program
A program that lives entirely with one performance engineer tends to collapse the moment that person changes roles. Durable programs distribute ownership across three connected roles with clear accountability at each level.
Why Some Heat Rate Programs Stall After a Strong Start
Many plants launch a heat rate program with enthusiasm after an initial audit, only to see momentum fade within a year. The pattern behind that stall is usually one of the same three causes.
Frequently Asked Questions
How is a systematic heat rate program different from an annual performance test?
An annual or periodic performance test provides a single snapshot of unit efficiency at one point in time, typically under carefully controlled steady-state conditions that may not reflect how the unit actually operates day to day. A systematic program instead runs continuously, calculating theoretical heat rate for every operating condition the unit actually experiences and comparing it against real-time actual performance, which means losses are identified within days or weeks of appearing rather than being discovered up to a year later at the next scheduled test. This continuous approach also captures losses that only appear at certain load points or ambient conditions, which a single annual test at one operating point would completely miss. The result is a much richer, more actionable dataset that supports ongoing decision-making rather than a static report that is often outdated within months of being issued. Book a demo to see continuous heat rate tracking in action.
What instrumentation is required to run a systematic heat rate program?
Most plants already have sufficient instrumentation in their DCS to support a systematic program, including main and reheat steam temperature and pressure, feedwater flow and temperature, condenser vacuum, and fuel flow measurement, though the accuracy and calibration frequency of these instruments often needs review before the resulting calculations can be trusted for investment decisions. A structured instrumentation audit at program kickoff identifies any critical gaps, such as missing extraction steam flow measurement on feedwater heaters or unreliable coal flow metering, and prioritizes closing those gaps based on how much they limit loss attribution accuracy. In most cases, the required instrumentation upgrade is modest compared to the value unlocked, since the goal is to make better use of data the plant is largely already collecting rather than installing an entirely new sensor network. Contact support for an instrumentation readiness assessment.
How are improvement projects prioritized when there are competing capital demands?
Every identified loss is converted into an estimated annual fuel cost impact using the plant's actual fuel price and generation profile, which allows heat rate projects to be compared directly against other capital priorities using the same financial language that plant management already uses for other investment decisions. Projects are then further screened by estimated correction cost and implementation complexity, producing a ranked list that surfaces the highest return, lowest complexity projects first. This financial framing is often what finally gets heat rate projects funded, since a project pitched as reducing a specific thermodynamic loss competes poorly against reliability or safety capital requests, while the same project pitched as saving a defined dollar amount in annual fuel cost competes on equal footing. Book a demo to see how projects are ranked by fuel cost impact.
Can a systematic program work across a fleet of plants with different ages and configurations?
Yes, and fleet-wide deployment is often where systematic programs deliver the most additional value beyond what a single-site effort achieves, because it enables direct comparison of loss patterns and project outcomes across sites with similar equipment. A fleet-level view can reveal that a particular condenser fouling mitigation approach worked exceptionally well at one site and should be replicated at others with similar cooling water chemistry, or that a specific feedwater heater failure mode is recurring across multiple units of the same design vintage. Each site's thermodynamic model is calibrated to its own design and corrected curves so comparisons remain fair despite configuration differences, while a fleet dashboard aggregates total identified savings opportunity and program progress for corporate-level reporting. Contact support to discuss a fleet-wide rollout plan.
How long does it take before a systematic heat rate program starts showing measurable results?
Most plants see their first prioritized loss list within eight to ten weeks of program kickoff, since that is primarily a matter of deploying the monitoring and attribution models against existing instrumentation and historical data. Measurable heat rate improvement typically follows within the first two to four months as low-cost, fast-turnaround projects such as burner tuning, air heater leakage correction, or feedwater heater return to service are executed against the prioritized list. Larger projects such as condenser retubing or turbine component upgrades that require a planned outage will show their improvement only after that outage occurs, but the identification and business case development for those projects happens immediately, ensuring the outage scope is already justified and budgeted well before the outage window arrives. Book a demo to get a realistic timeline for your plant.
Build a Heat Rate Program That Never Stops Finding Savings
iFactory gives your performance engineers a continuously updated, financially ranked list of heat rate improvement opportunities backed by real thermodynamic data.