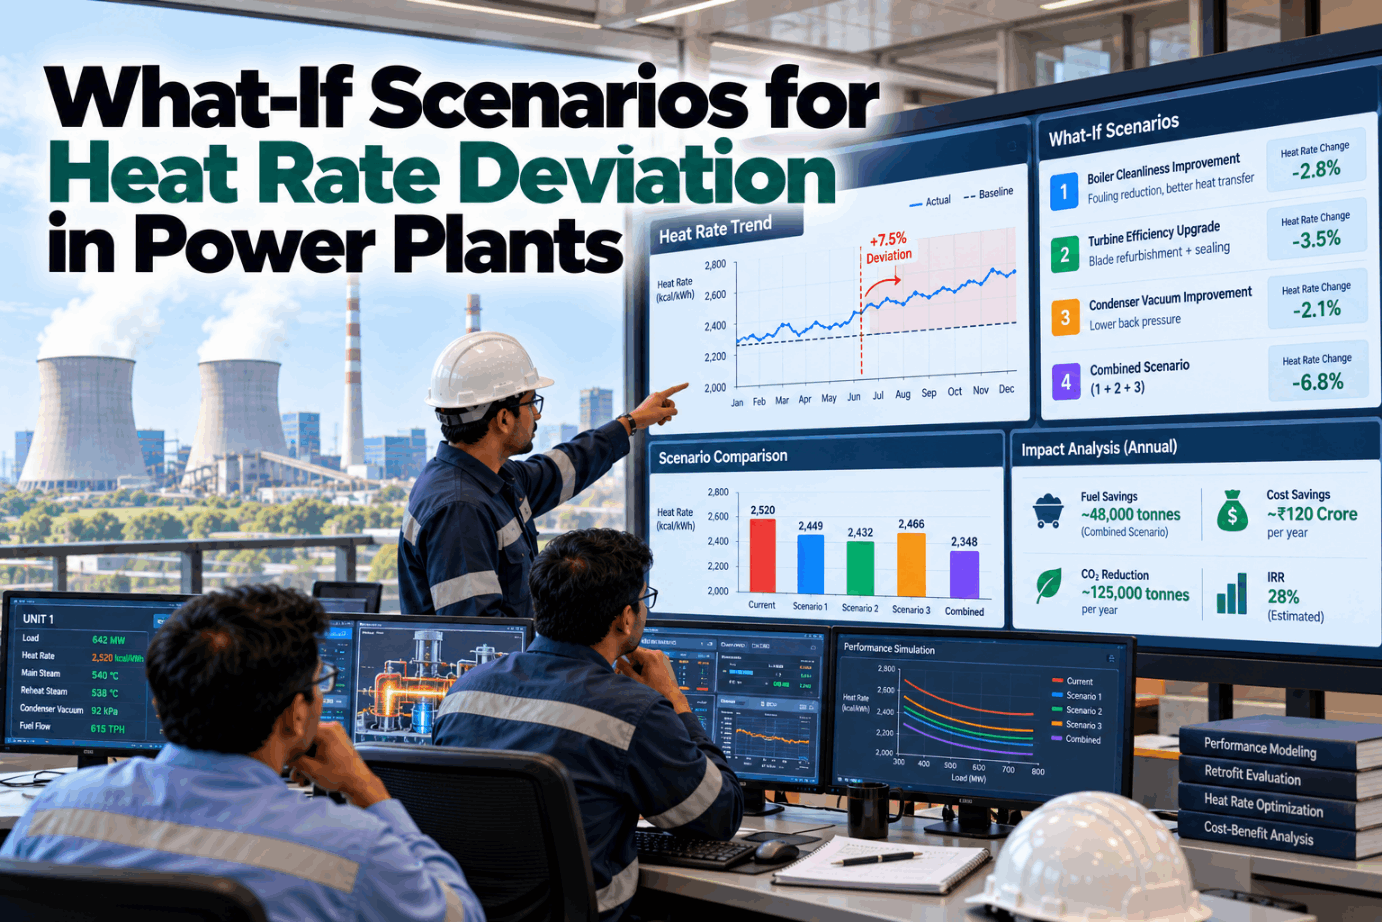
What-if scenarios for heat rate deviation let a power plant test a fix on a model before spending money on it. Heat rate drifts above target for many reasons at once: a fouled condenser, leaking air heater seals, low steam temperatures, more hours at part load. A what-if model splits the gap by cause, then shows how much each repair or retrofit would win back and what that is worth in fuel. This guide explains the method with published rules of thumb and worked examples. To see scenarios run on your own unit data, book a short walkthrough.
What-If Scenarios for Heat Rate Deviation in Power Plants: Value Every Fix Before You Spend
Split the heat rate gap by cause, model each repair or retrofit, and compare the fuel saved with the cost, before committing a budget.
A total deviation means little until it is divided by cause.
On a 500 MW coal unit, 1% of heat rate is worth roughly half a million dollars a year in fuel.
Fixes interact, so combinations must be modelled together.
Condenser cleaning and sootblowing changes can outrank costly retrofits.
What Is Heat Rate, and What Is a Deviation?
Heat rate is the fuel energy a plant uses to make one unit of electricity. Lower is better.
The gap between the heat rate a unit achieves and the heat rate it should achieve at the same load and conditions, measured in Btu/kWh or kcal/kWh.
The 3,412 figure and both examples are from the US Energy Information Administration.
Deviation is measured against a target for the same load, because heat rate naturally rises at part load. Comparing a night at half load with a design figure at full load says nothing useful.
A fair target curve is the first thing to set. We can check yours on a call.
What Heat Rates Do Plants Achieve?
Published averages give a sense of scale, though every unit has its own design value.
The Indian figures are CEA’s recommendations to the regulator. Check the notified tariff regulations for the final values that apply to your station.
Your own design and best-achieved figures are the benchmarks that matter. Our specialists can help set them by load.
What Is One Percent of Heat Rate Worth?
A one percent gain looks small. On a large unit it is a significant yearly fuel saving.
Our own arithmetic using EIA 2024 averages for coal heat rate, fuel price and capacity factor. Use your own figures.
- Higher load factor raises the value. A unit running 70% of the year saves proportionally more.
- Higher fuel price raises it too. Imported coal or gas makes each Btu worth more.
- Emissions fall in step. Less fuel burned means less carbon dioxide per MWh.
This single figure turns every heat rate question into money. See it calculated for your unit in a demo.
Where Heat Rate Deviation Comes From
The gap is usually several smaller losses added together. Published rules of thumb show their size.
| Cause | What happens | Published rule of thumb |
|---|---|---|
| Condenser back pressure | Fouling or air in-leakage raises turbine exhaust pressure | More than 2% on turbine cycle heat rate for a 2 in. Hg rise above design, at full load |
| Air heater exit gas temperature | Heat leaves with the flue gas | Each 40 °F reduction gives about 1 percentage point of boiler efficiency |
| Low steam temperatures | Main and reheat steam below design | Main steam 9 °F low with reheat 15 °F low cost 89 Btu/kWh in one case |
| Sootblowing practice | Dirty or over-cleaned heat surfaces | Optimisation averages about 0.6 points of boiler efficiency, about 60 Btu/kWh |
| Turbine condition | Deposits, erosion and seal wear | Overhaul recovers 100–300 Btu/kWh |
| Part-load running | Unit away from its design point | See the next section |
Sources are the Lehigh Energy Research Center for back pressure and steam temperature, and the Sargent and Lundy study for the others.
Splitting the gap this way is called a heat rate loss breakdown. We build one in every rollout.
The Part-Load Effect
As coal units flex to follow renewables, time at low load has become a major driver of heat rate.
Ranges by unit size, from the CEA and Ministry of Power compensation methodology for low-load operation.
- It is not a fault. Part-load heat rate is physics, not poor maintenance.
- It must be separated. Otherwise it hides the losses you can fix.
- It can be planned. A scenario shows the fuel cost of each dispatch pattern.
India’s roadmap targets a 40% minimum technical load for coal units, against about 55% today. More hours at low load make this separation essential.
A what-if model answers the dispatch question directly: what does a night at 45% cost in fuel? Ask our team to show it.
How a What-If Scenario Works
A scenario changes one thing in a model of the unit and shows the effect on heat rate, fuel and cost.
Model matches the unit as it runs today.
Deviation divided by cause.
One input: cleanliness, leakage, efficiency, load.
New heat rate and fuel against baseline.
Yearly saving against cost.
All options on one list.
A thermal model of boiler, turbine and condenser tuned to current plant data, so that its heat rate matches what the unit actually achieves.
The model matters because fixes interact. A cleaner condenser changes turbine exhaust conditions, which changes what a turbine overhaul is worth. A spreadsheet of separate estimates misses this.
Scenarios take minutes once the baseline is tuned. Our engineers can show the tuning step.
Published Gains and Costs for Common Fixes
A 2009 Sargent and Lundy study for the US EPA lists typical heat rate gains and capital costs for coal units.
| Measure | Heat rate gain, Btu/kWh | Capital cost |
|---|---|---|
| Turbine overhaul | 100–300 | $2–25 million |
| Economizer replacement | 50–100 | $2–8 million |
| Neural network optimisation | 0–150 | $0.5–0.75 million |
| Intelligent sootblowers | 30–150 | $0.3–0.5 million |
| Condenser cleaning | 30–70 | $30,000–80,000 a year |
| Boiler feed pump overhaul | 25–50 | $0.25–0.8 million |
| Variable frequency drives | 20–100 | $1.5–6 million |
| Air heater leakage control | 10–40 | $0.3–1.2 million |
Costs are in 2009 dollars and ranges are wide. They show the order of magnitude and why each option needs its own scenario.
fleet heat rate improvement was treated by the US EPA as reasonable for coal plants, with total potential cited at up to 6%.
The ranges overlap, so ranking depends on your unit. See the ranking built from your data in a session.
Comparing Two Fixes on the Same Unit
Using the published ranges and the fuel value above, two options look very different.
Illustrative, for the 500 MW unit in the earlier example.
Illustrative. Lower fan power from reduced leakage would add to the saving.
The cheaper job wins clearly here. On another unit, with a clean condenser and badly worn seals, the answer could reverse. That is the reason to model before committing.
Discuss which options to model first with our advisors.
Why Gains Do Not Simply Add Up
Sargent and Lundy caution that combinations of measures are not additive and must be assessed case by case.
- Shared losses. Two fixes may recover part of the same loss.
- Changed conditions. One fix moves the operating point of another component.
- Limits elsewhere. A gain may be capped by a fan, pump or temperature limit.
- Load profile. A fix worth a lot at full load may be worth little at part load.
Illustrative. The gap between the first two rings is the reason to model combinations as one scenario.
A business case built on added-up estimates will overstate the return. We test combinations in a working session.
From Scenario to Verified Result
A scenario is a forecast. A performance test before and after confirms it.
India’s Perform, Achieve and Trade scheme set targets on the deviation between net operating and net design heat rate. Its first cycle covered 144 thermal plants.
Verified results build trust in the next scenario. Plan the test points in a pilot.
Estimate by Spreadsheet vs Model-Based What-If
Both give a number. Only one accounts for how the unit behaves.
- Rule-of-thumb gain for each fix
- Gains added together
- Full-load view only
- Refreshed before each budget
- Hard to check afterwards
- Gain calculated for this unit
- Combinations modelled as one case
- Weighted by the real load profile
- Baseline follows current plant data
- Result compared with test data
Instrument checks come first; a wrong flow reading can look like a heat rate loss. A performance review starts there.
How iFactory Runs Heat Rate What-If Scenarios
iFactory keeps a live baseline of each unit, splits the deviation by cause and values every option.
Actual against target at the current load.
Deviation split by cause, in fuel and money.
Repairs, retrofits and dispatch patterns.
Saving, cost and payback on one list.
Answers performance questions in plain language.
Scenario forecast against measured gain.
It runs on premises and reads from your DCS and historian. Share a month of unit data and we will show the first loss breakdown in a trial.
See Where Your Heat Rate Gap Comes From
Share a month of unit data. We split the deviation by cause and run the first what-if scenarios with the fuel value of each fix.
Heat rate is 142 kcal/kWh above target. Condenser back pressure explains 58, air heater leakage 36 and reheat spray 27.
Choosing Which Fix to Fund First
This is how a performance engineer might use the scenarios.
iFactory ships as a pre-configured NVIDIA AI server, racked and ready with the performance and heat rate models loaded. Rack it, plug in power and Ethernet, and the AI is live. Scope covers data connections across units, control room, stores and planning office, DCS, historian, CMMS and ERP integration, cabling and network setup, team training and 24×7 remote monitoring.
Server installed, DCS, historian and CMMS links live, history loaded.
Models tuned on your own plant data, then piloted on one unit with your team reviewing every output.
Rollout to the agreed units, team training done, 24×7 remote monitoring in place.
Software, server and integration come as one package. For pricing, contact our sales team.
Frequently Asked Questions
A model run that changes one input, such as condenser cleanliness or air heater leakage, and shows the effect on heat rate, fuel use and cost.
Divide 3,412 by the heat rate in Btu/kWh, or 860 by the heat rate in kcal/kWh. For example, 10,500 Btu/kWh is 33% efficient.
Common causes are high condenser back pressure, high air heater exit gas temperature, low steam temperatures, turbine wear and more time at part load.
For a 500 MW coal unit at average US 2024 fuel price and capacity factor, our arithmetic gives about half a million dollars a year.
No. Sargent and Lundy caution that combinations are not additive. Fixes interact, so they should be modelled together.
A tuned baseline, loss breakdown and first scenarios for one unit typically fit within a 6–12 week rollout. Plan it with our specialists.
Simulate the Fix Before You Fund It
iFactory splits heat rate deviation by cause and values each repair or retrofit on your own unit data, so budgets go where the return is.
Illustrative. Splitting the gap by cause shows which fix is worth modelling first.