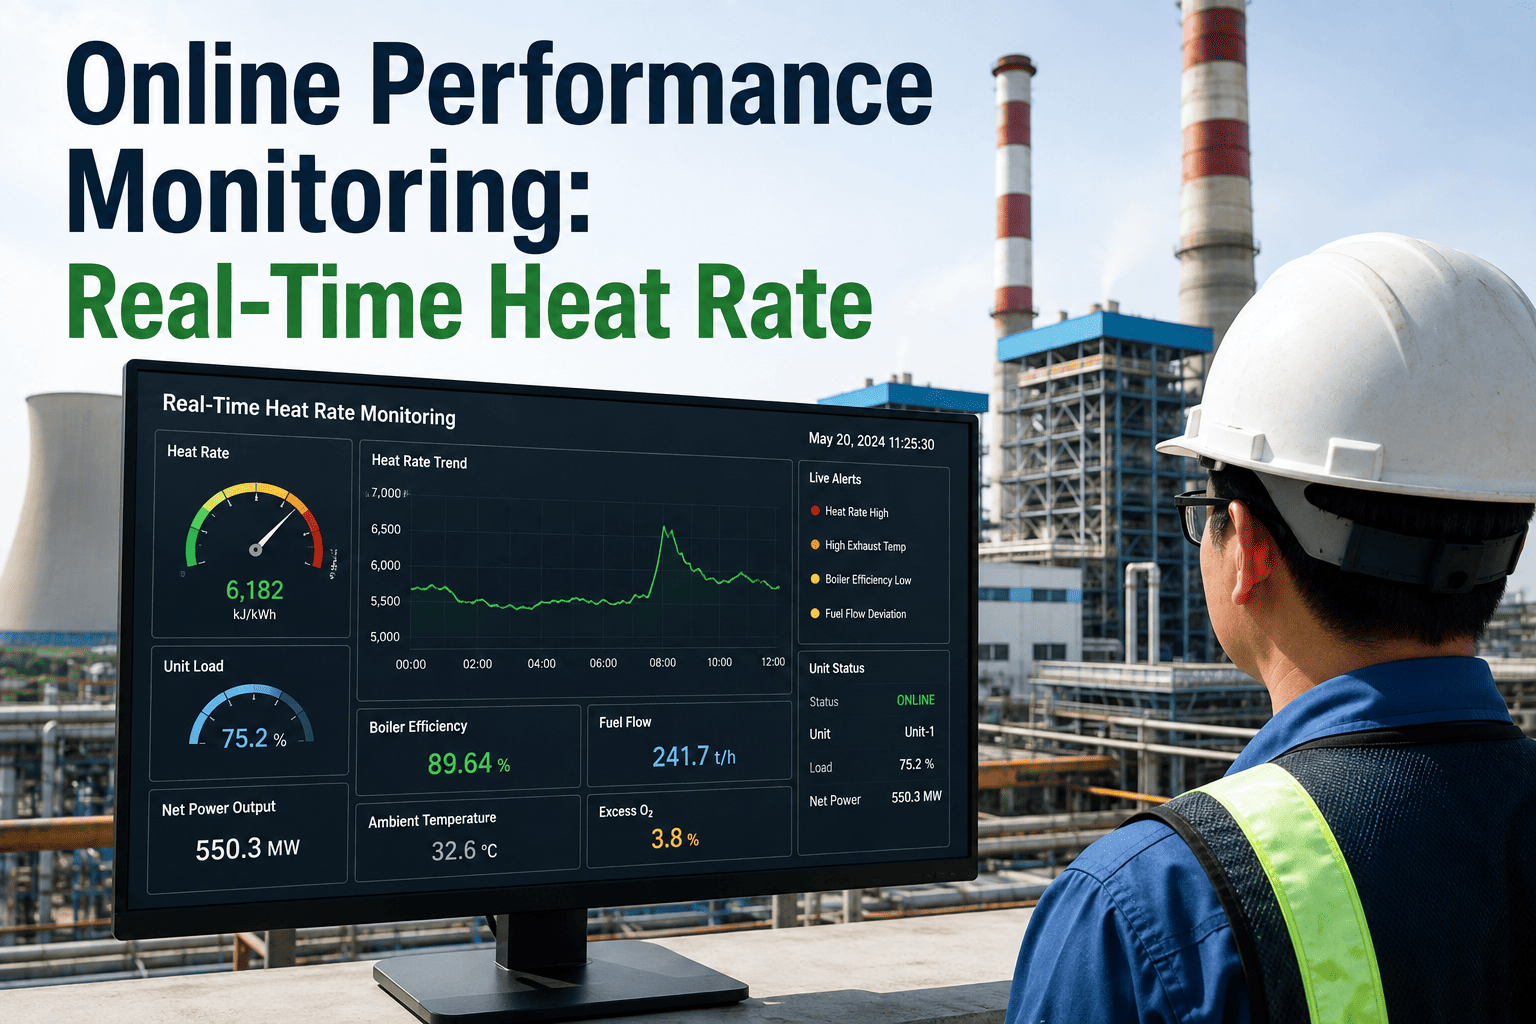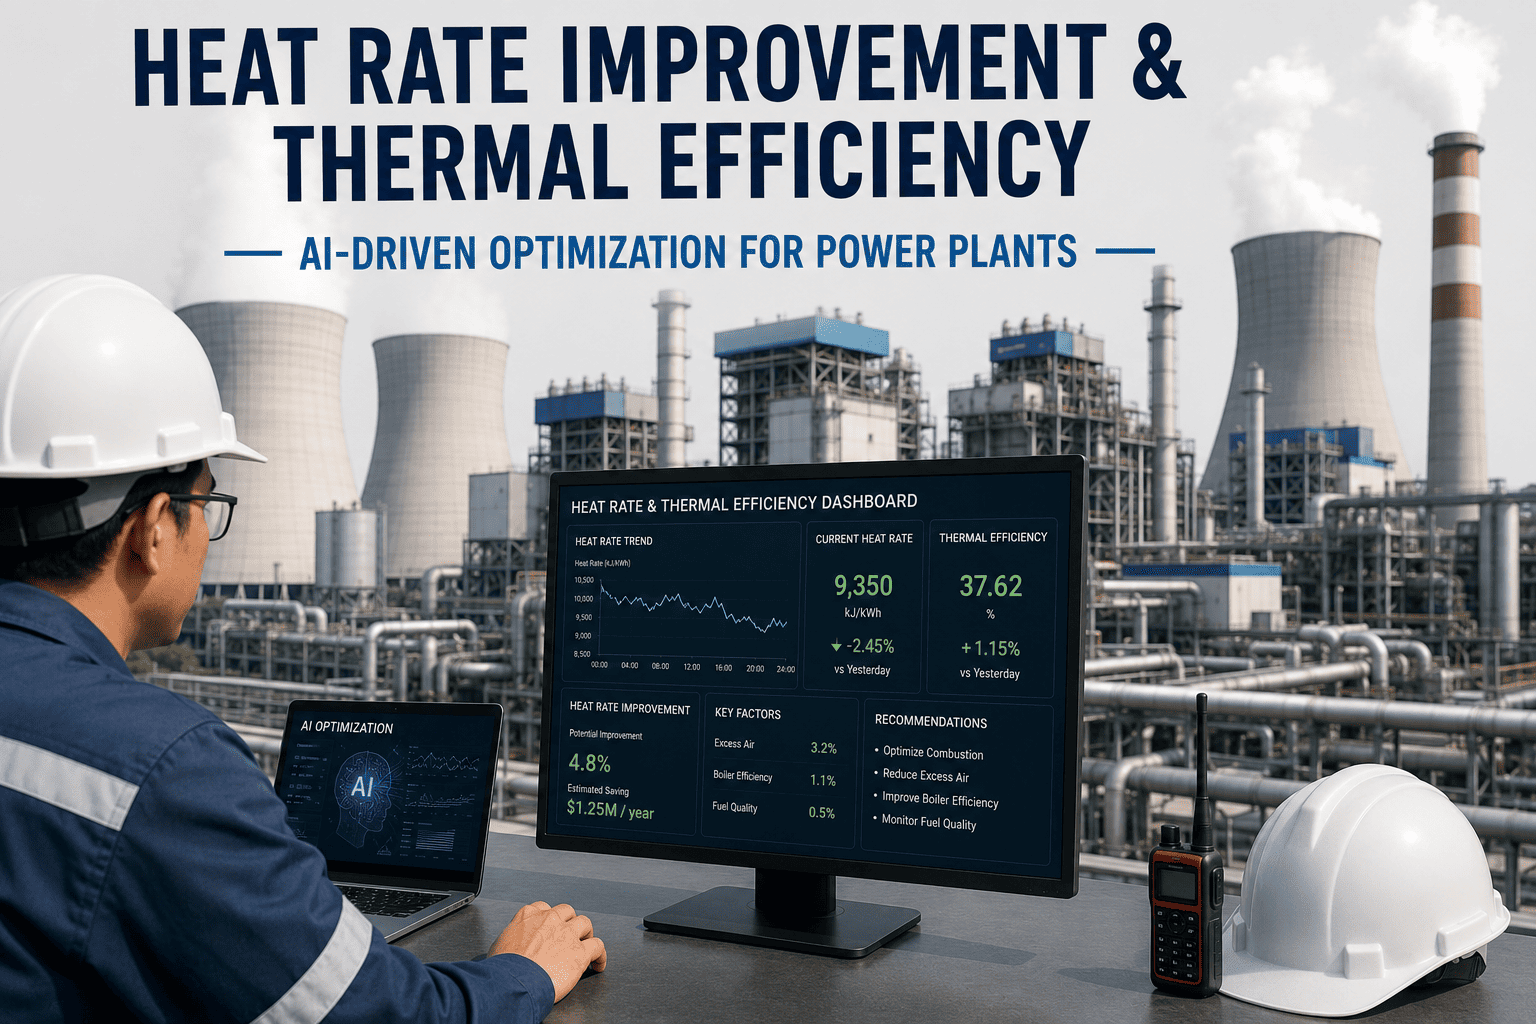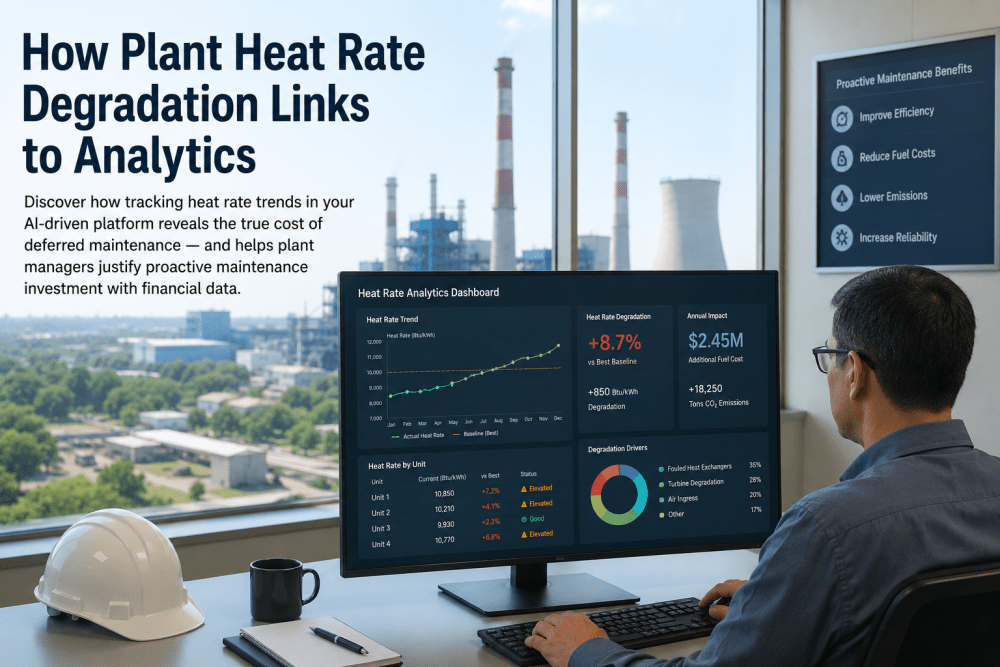
Heat rate is the single most financially transparent performance metric at a thermal power plant — and it is the one that most maintenance analytics programs treat as a reporting output rather than a maintenance decision input. Every BTU per kilowatt-hour of heat rate degradation above the unit's design curve has a direct, calculable fuel cost attached to it. A 300 MW coal unit operating 150 BTU/kWh above its clean baseline heat rate at $2.50/MMBtu coal is burning approximately $900,000 in unnecessary fuel annually — before accounting for capacity market performance deductions, environmental compliance impacts from elevated emissions rates, and the accelerated equipment wear that typically accompanies the mechanical conditions driving the degradation. The reason most plants tolerate this cost is not because they are unaware heat rate as a concept — every plant reports it. The reason they tolerate it is because their analytics platform does not connect the heat rate trend to the specific maintenance actions that would recover it, which means the financial signal never reaches the maintenance planning process that could act on it. This guide covers how AI-driven heat rate tracking changes that connection — making the link between a developing turbine seal leak or a fouled condenser and the specific dollar value of the heat rate penalty it is producing visible at the point in the planning process where the maintenance decision can still be made before the cost compounds.
Is Your Plant Paying a Six-Figure Annual Fuel Premium From Deferred Heat Rate Recovery Maintenance?
iFactory's AI-driven heat rate analytics platform connects your historian data, maintenance records, and fuel cost inputs to calculate the running dollar value of each degradation source — giving plant managers the financial justification for proactive maintenance investment before the outage budget conversation.
Why Heat Rate Degradation Is a Maintenance Signal, Not Just a Performance Metric
The fundamental insight that AI-driven heat rate analytics delivers — and that traditional heat rate reporting misses — is that heat rate degradation is almost never random. Every meaningful deviation from the unit's design or corrected heat rate baseline is caused by a specific, identifiable mechanical or operational condition: turbine blade fouling, steam path seal wear, condenser tube fouling, air heater leakage, feed water heater terminal temperature difference increase, boiler sootblower ineffectiveness, or valve passing. Each of these conditions produces a characteristic heat rate signature — a specific pattern of deviation across the unit's operating parameter set that the AI analytics platform can identify and classify when it has the right combination of connected data from the plant historian, the CMMS maintenance history, and the performance test database. When the analytics platform classifies the heat rate degradation source rather than simply reporting the total deviation, the maintenance planning team has an actionable work scope rather than a performance concern.
Turbine Steam Path Degradation
Blade fouling, erosion, and seal wear in the HP, IP, and LP turbine sections produce measurable heat rate impact that appears as efficiency loss on the expansion line. AI analytics tracks stage efficiency calculations from available pressure and temperature data to isolate degradation to specific turbine sections — generating maintenance scope before the degradation reaches performance test failure thresholds.
Condenser Performance Degradation
Condenser tube fouling, air in-leakage, and circulating water flow degradation each produce characteristic condenser backpressure increases that translate directly and predictably into heat rate penalty. The AI platform tracks actual versus clean condenser performance using hotwell temperature, circulating water temperature, and steam flow data — quantifying the heat rate impact and the estimated tube cleaning or air removal maintenance scope.
Feed Water Heater Train Degradation
Feed water heater tube plugging, terminal temperature difference increase, and drain cooler approach degradation each reduce the thermal efficiency of the regenerative heating cycle — adding measurable heat rate penalty that accumulates progressively as heater performance deteriorates between maintenance outages. AI heat rate analytics tracks FWH performance metrics continuously and calculates the heat rate penalty attributable to each heater in the train.
Air Heater and Boiler Efficiency Losses
Air heater leakage, increased stack temperature from fouled convection pass surfaces, and degraded sootblower performance each reduce boiler efficiency — contributing heat rate penalty that the AI platform isolates from turbine-side losses through the heat balance calculation. Boiler-side heat rate losses typically respond to operational interventions like sootblowing optimization and air heater basket cleaning, which the analytics platform tracks for effectiveness.
The Deferred Maintenance Premium: Quantifying Heat Rate Penalty Cost Before the Maintenance Decision
The financial case for proactive maintenance investment that recovers heat rate is most compelling when the cost of deferral is calculated explicitly — before the outage budget discussion rather than after. The table below illustrates the annual fuel cost premium associated with representative heat rate degradation levels at different plant sizes and fuel costs. These are not hypothetical figures — they are the calculations that iFactory's heat rate analytics module performs continuously using actual plant heat rate data, actual fuel cost inputs, and actual generation dispatch history to produce a running dollar value for each identified degradation source.
| Unit Size | Heat Rate Deviation | Fuel Cost | Annual Fuel Premium | Typical Maintenance Recovery Cost | Payback Period |
|---|---|---|---|---|---|
| 150 MW | 100 BTU/kWh above baseline | $2.50/MMBtu | ~$230,000/yr | $45,000–$90,000 | 2–5 months |
| 300 MW | 150 BTU/kWh above baseline | $2.50/MMBtu | ~$900,000/yr | $80,000–$160,000 | 1–2 months |
| 300 MW | 150 BTU/kWh above baseline | $4.00/MMBtu | ~$1,440,000/yr | $80,000–$160,000 | 5–7 weeks |
| 500 MW | 200 BTU/kWh above baseline | $3.50/MMBtu | ~$3,000,000/yr | $120,000–$240,000 | 2–4 weeks |
| 800 MW | 250 BTU/kWh above baseline | $3.00/MMBtu | ~$6,000,000/yr | $180,000–$350,000 | 10–21 days |
These calculations assume 80% capacity factor. At higher dispatch levels the annual fuel premium scales proportionally — making heat rate recovery maintenance one of the highest-ROI maintenance investments available at any thermal power plant. Book a Demo to see iFactory calculate your unit's current heat rate penalty cost from actual operating data.
How iFactory's Heat Rate Analytics Platform Connects Degradation Detection to Maintenance Action
The heat rate analytics workflow that produces actionable maintenance scope — rather than simply a performance trending dashboard — requires five connected steps: baseline establishment, continuous deviation detection, degradation source classification, financial impact quantification, and maintenance work order generation. Each step is necessary; the absence of any one of them produces a system that reports heat rate without influencing the maintenance decisions that would recover it. Book a Demo to see this workflow demonstrated against your unit's historian data and current heat rate performance.
Corrected Heat Rate Baseline Establishment
iFactory establishes the unit's corrected heat rate baseline from available performance test data, design curves, and historical historian data from periods of demonstrated optimal operating condition. The baseline is corrected for ambient conditions, load level, fuel quality variation, and operating mode using the unit-specific correction factors from the OEM performance curves or from empirically derived correction factors built from the unit's own operating history. This corrected baseline is the reference against which all subsequent operating data is compared — ensuring that heat rate deviations reflect actual equipment degradation rather than correction errors from ambient or load variation.
Continuous Corrected Heat Rate Monitoring and Trend Detection
Operating data from the plant historian — fuel flow, steam flow, electrical output, temperature and pressure measurements at key cycle points — is ingested continuously and used to calculate the corrected heat rate at each operating point. The AI analytics engine applies statistical trend detection to the corrected heat rate time series, distinguishing true degradation trends from normal operating variability, and generating alerts when the degradation trend exceeds a configurable significance threshold that represents a financially meaningful deviation from the corrected baseline.
Degradation Source Classification Using Heat Balance Analysis
When a statistically significant heat rate deviation is confirmed, the platform performs a heat balance decomposition — calculating the contribution of each major system (turbine section efficiencies, condenser backpressure, feed water heater performance, boiler efficiency, auxiliary power consumption) to the total measured deviation. This decomposition identifies which system is the primary source of the detected degradation, and the AI classification engine compares the decomposition pattern against its database of known degradation signatures to classify the most likely root cause and generate the associated maintenance work scope recommendation.
Financial Impact Quantification and Maintenance ROI Calculation
The classified degradation and its associated heat rate penalty are translated into an annual fuel cost premium using the unit's actual fuel cost, dispatch schedule, and heat rate deviation magnitude. This financial quantification is generated automatically and updated continuously as operating conditions change — so the dollar value of each identified degradation source is always current at the point when the maintenance planning team reviews the work order queue. The platform also calculates the estimated maintenance cost for the recommended recovery action from historical maintenance cost data for similar scope on the same asset, generating a pre-decision ROI estimate that the planning team can present to plant management without additional analysis.
Maintenance Work Order Generation and Post-Maintenance Verification
The heat rate recovery maintenance scope is generated as a CMMS work order through iFactory's standard work order integration — with the heat rate penalty calculation, the degradation source classification evidence, and the estimated recovery value documented in the work order description. After the maintenance work is completed, the platform monitors the post-maintenance heat rate performance to verify that the expected recovery was achieved and updates the degradation source model with the confirmed before-and-after heat rate values, improving the platform's source classification accuracy for future detections on the same equipment.
Before vs. After: What Changes When Heat Rate Analytics Drives the Maintenance Justification Process
The organizational change that heat rate analytics produces is not primarily technical — it is the shift in how maintenance investment decisions get made. Before heat rate analytics, maintenance managers justify proactive scope based on condition indicators and engineering judgment in a budget conversation where the opposing argument is always "the unit is running." After heat rate analytics, the maintenance manager presents a financial case: this specific degradation condition is costing this specific dollar amount per month, and this maintenance scope will recover it at this estimated cost with this payback period. The budget conversation changes completely when the cost of deferral is as specific as the cost of action.
What Plant Performance Engineers Say About Heat Rate Analytics and Maintenance Justification
From Performance Metric to Maintenance Decision: The Financial Case Heat Rate Analytics Makes Automatically
Heat rate is already measured at virtually every thermal power plant in the United States. The gap is not measurement — it is interpretation and connection. The AI-driven heat rate analytics platform that delivers actionable maintenance value is not the one that produces a better heat rate trend chart. It is the one that connects the detected deviation to the specific maintenance action that would recover it, calculates the financial value of that recovery using actual fuel costs and dispatch data, generates the work order with the ROI pre-documented, and verifies the recovery after the work is completed. This complete workflow — from deviation detection through financial quantification through maintenance execution through post-maintenance verification — is what converts heat rate from a performance reporting metric into a proactive maintenance investment justification tool.
The plants that consistently operate near their design heat rate curves are not the ones with the newest equipment — they are the ones where the maintenance investment decisions are made with financial specificity rather than general condition concerns. AI-driven heat rate analytics is the platform capability that delivers this specificity systematically and continuously rather than once per performance test cycle. Book a Demo to see how iFactory's heat rate analytics module calculates your unit's current degradation cost from actual historian data.
Heat Rate Degradation Analytics — Frequently Asked Questions
What historian data points are required to run the heat balance decomposition that identifies the degradation source?
The core heat balance decomposition requires the following historian data streams at a minimum: main steam flow and conditions (pressure and temperature), hot reheat steam conditions, condenser hotwell temperature and circulating water inlet and outlet temperatures, extraction steam flows or feed water heater inlet and outlet temperatures for each heater in the train, electrical output (net and gross), and fuel flow with fuel analysis data for heat content calculation. Where some of these signals are unavailable due to measurement gaps, the platform uses available signals with configurable estimation methods for the missing quantities — flagging which components of the heat balance are directly calculated versus estimated so the maintenance team understands the confidence level of each source classification. Book a Demo to review your historian's available signal set against the heat balance requirements for your specific unit configuration.
How does the platform distinguish between heat rate deviations caused by equipment degradation and those caused by ambient conditions or load following?
The corrected heat rate calculation applies the unit's heat rate correction curves — derived from OEM performance curves or empirically from the unit's own operating history — to adjust the calculated heat rate for variations in ambient temperature and pressure, condenser circulating water temperature, partial load operation relative to the design point, and steam extraction variations for non-generation heat loads. Once these corrections are applied, the residual deviation from the corrected baseline represents genuine equipment condition change rather than operating condition variation. The statistical trend detection engine then distinguishes sustained degradation trends from random operating variability by applying configurable significance thresholds — typically requiring a sustained deviation above 50 BTU/kWh for more than 72 consecutive hours before generating a maintenance alert, to avoid false positives from short-duration operating anomalies.
Can the platform track heat rate recovery effectiveness after maintenance is completed and verify that the expected performance improvement was actually achieved?
Yes — post-maintenance heat rate verification is one of the platform's most operationally valuable functions. After a heat rate recovery maintenance event is marked complete in the CMMS, the platform enters a verification monitoring period during which the corrected heat rate trend is evaluated against the pre-maintenance baseline and the expected recovery value. The verification assessment is typically completed within 2 to 4 weeks of return to service and generates a maintenance effectiveness report showing the actual heat rate recovery achieved versus the projected recovery, the financial value of the verified recovery, and the updated degradation rate projection for the next maintenance cycle. This verified recovery data accumulates across maintenance events to produce a historical record of maintenance ROI that the performance engineering team can use for future maintenance investment justification discussions. Book a Demo to see the post-maintenance verification workflow demonstrated.
How does the platform handle combined cycle units where the heat rate calculation involves both the gas turbine and the steam turbine in an integrated heat balance?
Combined cycle heat rate analytics in iFactory tracks the integrated net plant heat rate as well as the individual performance of the gas turbine section and the heat recovery steam generator and steam turbine section separately. Gas turbine heat rate degradation — driven by compressor fouling, combustion system wear, and hot section component degradation — is tracked through the gas turbine performance calculation from available GT inlet conditions, fuel flow, and output data. HRSG and steam cycle performance is tracked through the steam turbine section heat balance. When a total plant heat rate deviation is detected, the platform's decomposition identifies whether the primary source is GT-side or steam cycle side, which directs the maintenance scope to the appropriate equipment group. For units with multiple GT and one steam turbine in a 2×1 or 3×1 configuration, the platform performs the individual GT performance calculations separately and the steam cycle heat balance across the combined steam flow to all GT inputs.
What is the typical annual fuel cost saving that plants achieve after deploying connected heat rate analytics and acting on the maintenance recommendations?
Based on deployment outcomes across thermal power plant clients, facilities that deploy iFactory's heat rate analytics platform and act on the generated maintenance recommendations within the recommended window typically recover between 80 and 250 BTU/kWh of heat rate degradation in the first 12 months of deployment — representing annual fuel cost savings of $180,000 to $2,400,000 depending on unit size, fuel cost, and dispatch level. The variance in outcomes is primarily driven by how much accumulated degradation existed at the time of deployment — plants that have been running significantly above their corrected baseline for multiple years without systematic heat rate recovery maintenance tend to show the largest first-year savings as the highest-value degradation sources are identified and addressed in sequence. Plants that already maintain near-baseline performance see the primary value in the platform's continuous monitoring function — detecting new degradation much earlier in its development and preventing the fuel cost accumulation that compounds over multi-year deferral periods. Book a Demo to receive a site-specific heat rate savings estimate based on your unit's available performance data.
Deploy iFactory Heat Rate Analytics — From Degradation Detection to Maintenance ROI in Weeks
iFactory's AI-driven heat rate analytics module connects your historian data, fuel cost inputs, and maintenance records to classify degradation sources, calculate the running dollar value of each penalty, and generate maintenance work orders with ROI pre-documented — giving plant managers the financial justification tool that turns performance data into proactive maintenance investment.