A turbine engineer watches backpressure creep from 1.8 to 2.4 inches of mercury over six weeks and assumes it's just summer heat pushing cooling water temperature up, the way it does every year. Nobody pulls the cleanliness factor trend or checks the air ejector's non-condensable removal rate, because the unit is still making its dispatch target and nothing looks broken. By the time someone finally investigates, the plant has quietly given up several megawatts of output for weeks, spread thin enough across daily generation reports that no single day looked alarming. Book a demo with iFactory to see how continuous vacuum diagnostics catch that MW loss the week it starts, not the month someone finally goes looking.
Condenser Vacuum Optimization
Condenser Vacuum Optimization: Find the Megawatts Hiding in Your Backpressure Trend
Cooling water performance, tube cleanliness, and air in-leakage — decomposed into a single diagnostic so you know exactly which one is costing you output before the next dispatch cycle.
1 inHg
Backpressure rise above design that typically costs 1-2% in unit heat rate
4-8 MW
Approximate output lost on a 600 MW unit per inch of avoidable backpressure creep
3
Independent root causes that can each raise backpressure — only one usually needs tube cleaning
Why Backpressure Creep Goes Unnoticed
One Number, Three Different Root Causes
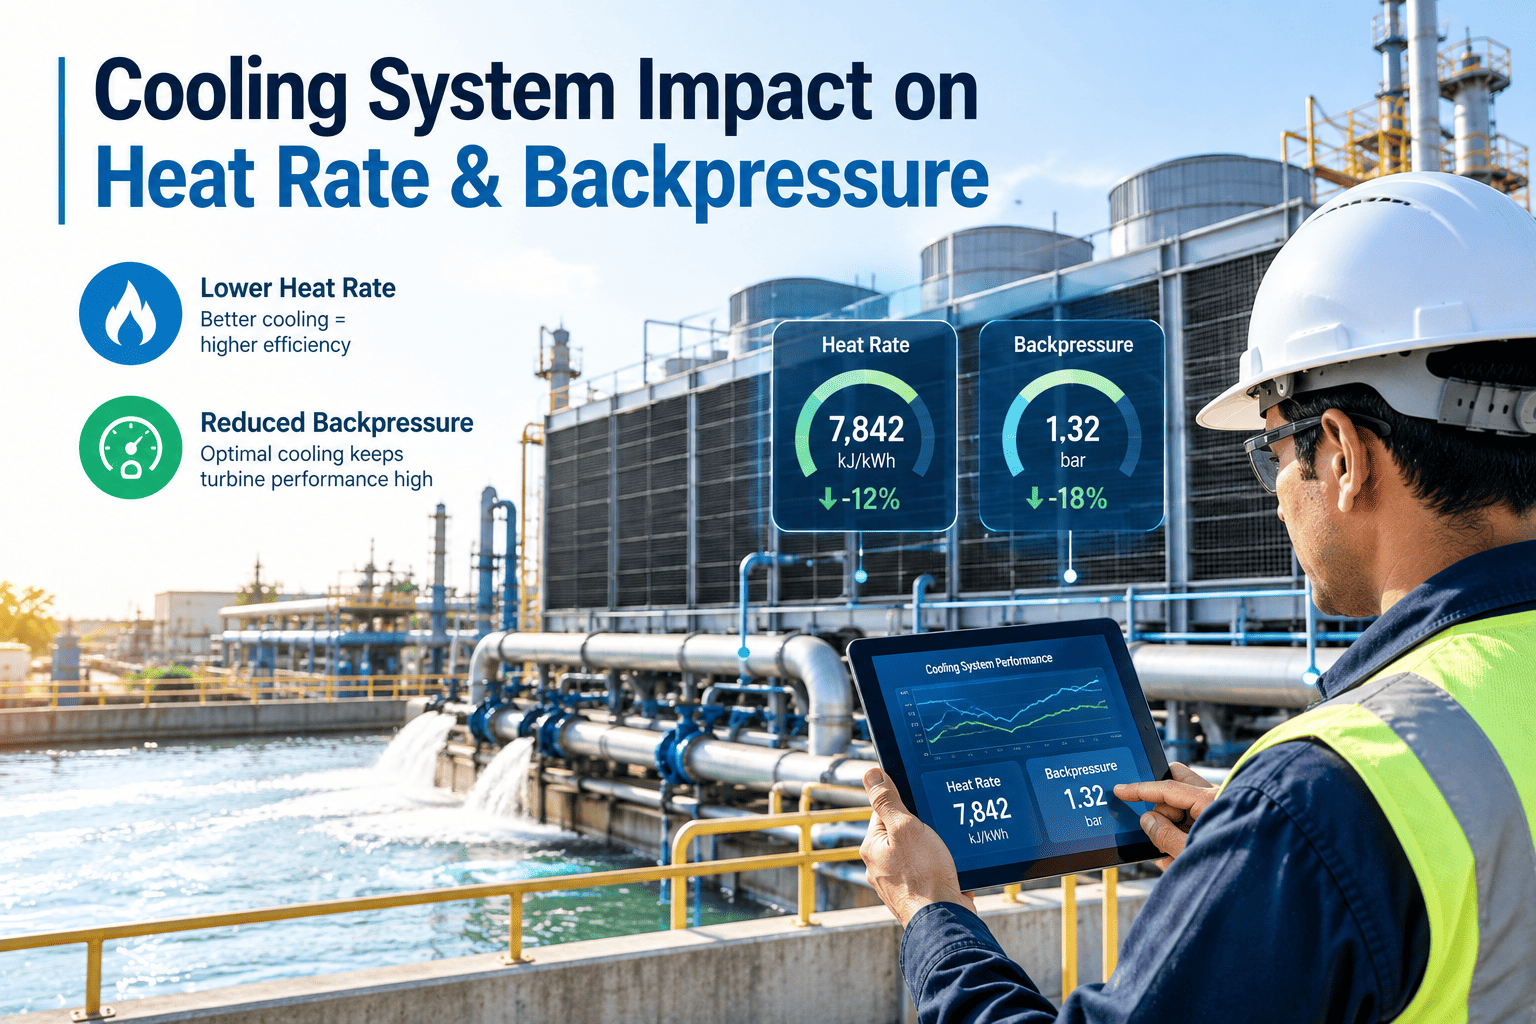
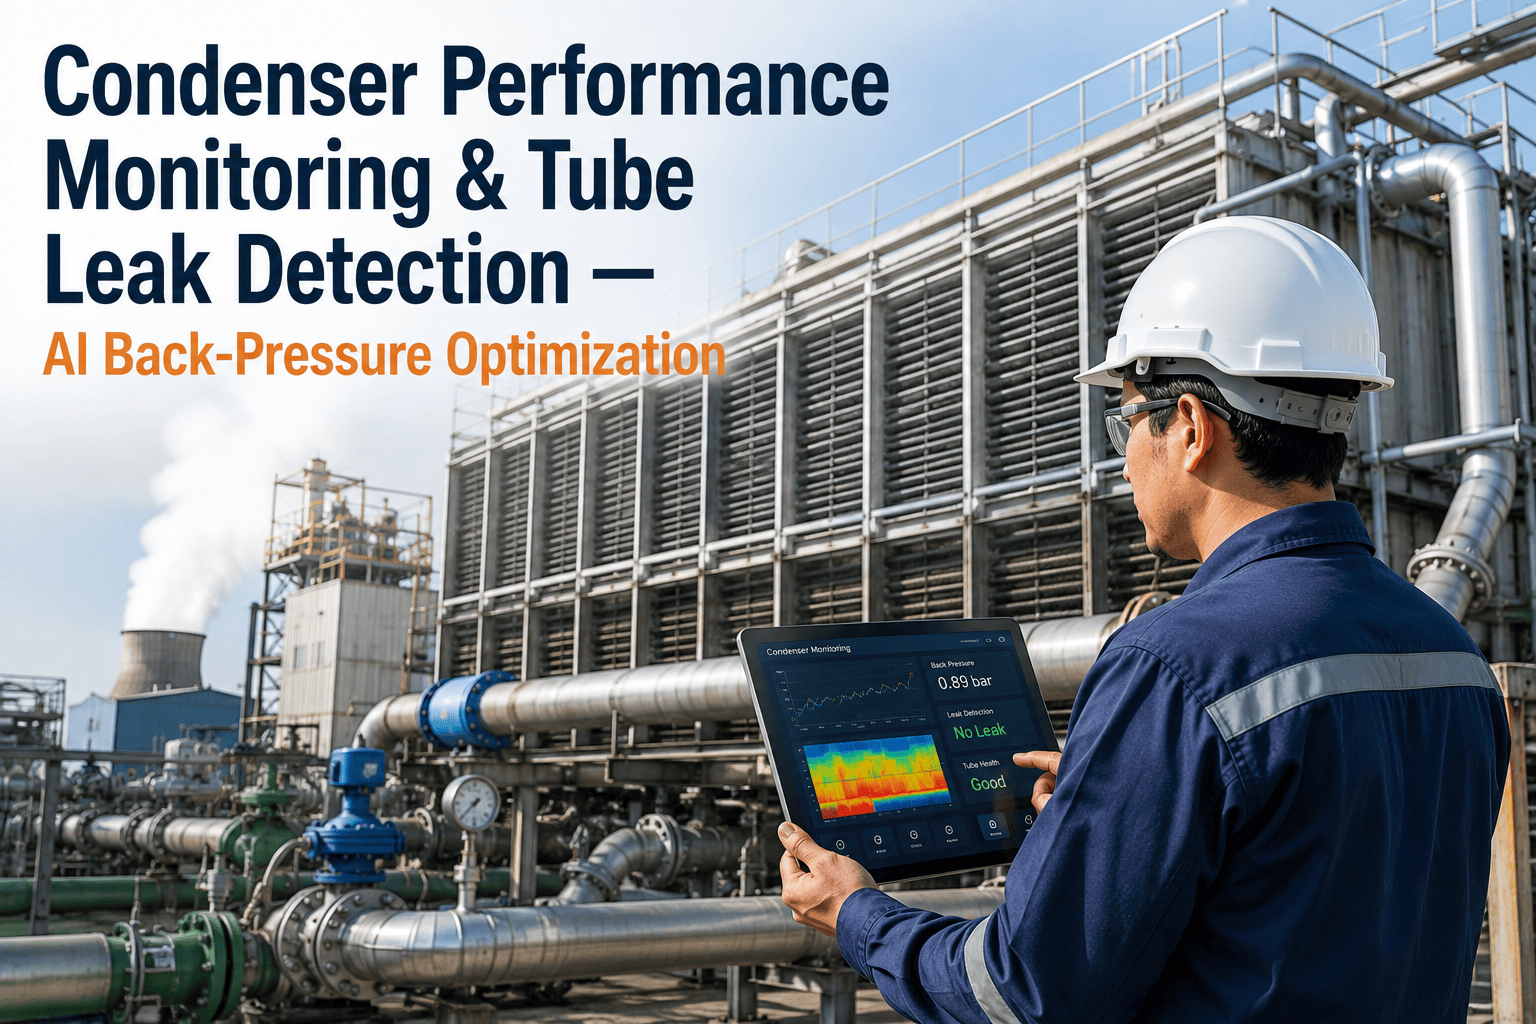
Condenser backpressure is a single gauge reading, but it's the output of three independent systems working together — the circulating water side, the tube surface itself, and the air removal system. When backpressure rises, most plants reach for the same fix by default: schedule a tube cleaning. Sometimes that's exactly right. Sometimes the tubes are perfectly clean and the real problem is a cooling tower fill that's fouled, or an air ejector quietly losing capacity while non-condensable gases build up in the shell.
Cleaning tubes that don't need it costs an outage day for nothing, while the actual cause keeps eating output. Diagnosing backpressure by trend and by which sub-signal moved first — approach temperature, cleanliness factor, or air removal rate — is the difference between a targeted fix and a maintenance action that doesn't touch the real problem. The plants that hold their heat rate tightest year over year aren't running fundamentally different equipment; they've just stopped treating backpressure as one undifferentiated number.
Backpressure Watched Alone
One combined number, three possible causes
Tube cleaning scheduled by calendar, not condition
Air in-leakage discovered only after vacuum collapses
MW loss attributed to "summer weather" by default
Decomposed Vacuum Diagnostics
Approach temp, CF, and air rate tracked separately
Tube cleaning triggered by cleanliness factor threshold
Air in-leakage trended continuously against baseline
Root cause identified before the next dispatch cycle
The Three Levers
Cooling Water, Tube Surface, and Air Removal — Each Moves Backpressure Differently
Lever 1
Cooling Water Performance
Circulating water flow rate and cooling tower approach temperature set the floor for how cold the water reaching the condenser can be. A degraded cooling tower fill or a circulating pump running below design flow raises inlet water temperature before the condenser tubes are even involved, and no amount of tube cleaning corrects a cooling-tower-side problem, which is exactly why checking this lever first prevents a wasted cleaning outage on a condenser that was never the actual bottleneck.
Lever 2
Tube Cleanliness Factor
Scale, biofouling, and silt deposits on the tube's water side reduce the heat transfer coefficient below its clean design value. Cleanliness factor — the ratio of actual to design heat transfer — is the single best indicator of when tube cleaning will actually move backpressure, as opposed to cleaning on a fixed outage-based schedule regardless of condition, which either wastes a cleaning cycle on tubes that were already performing well or delays a genuinely necessary one.
Lever 3
Air In-Leakage & Ejector Capacity
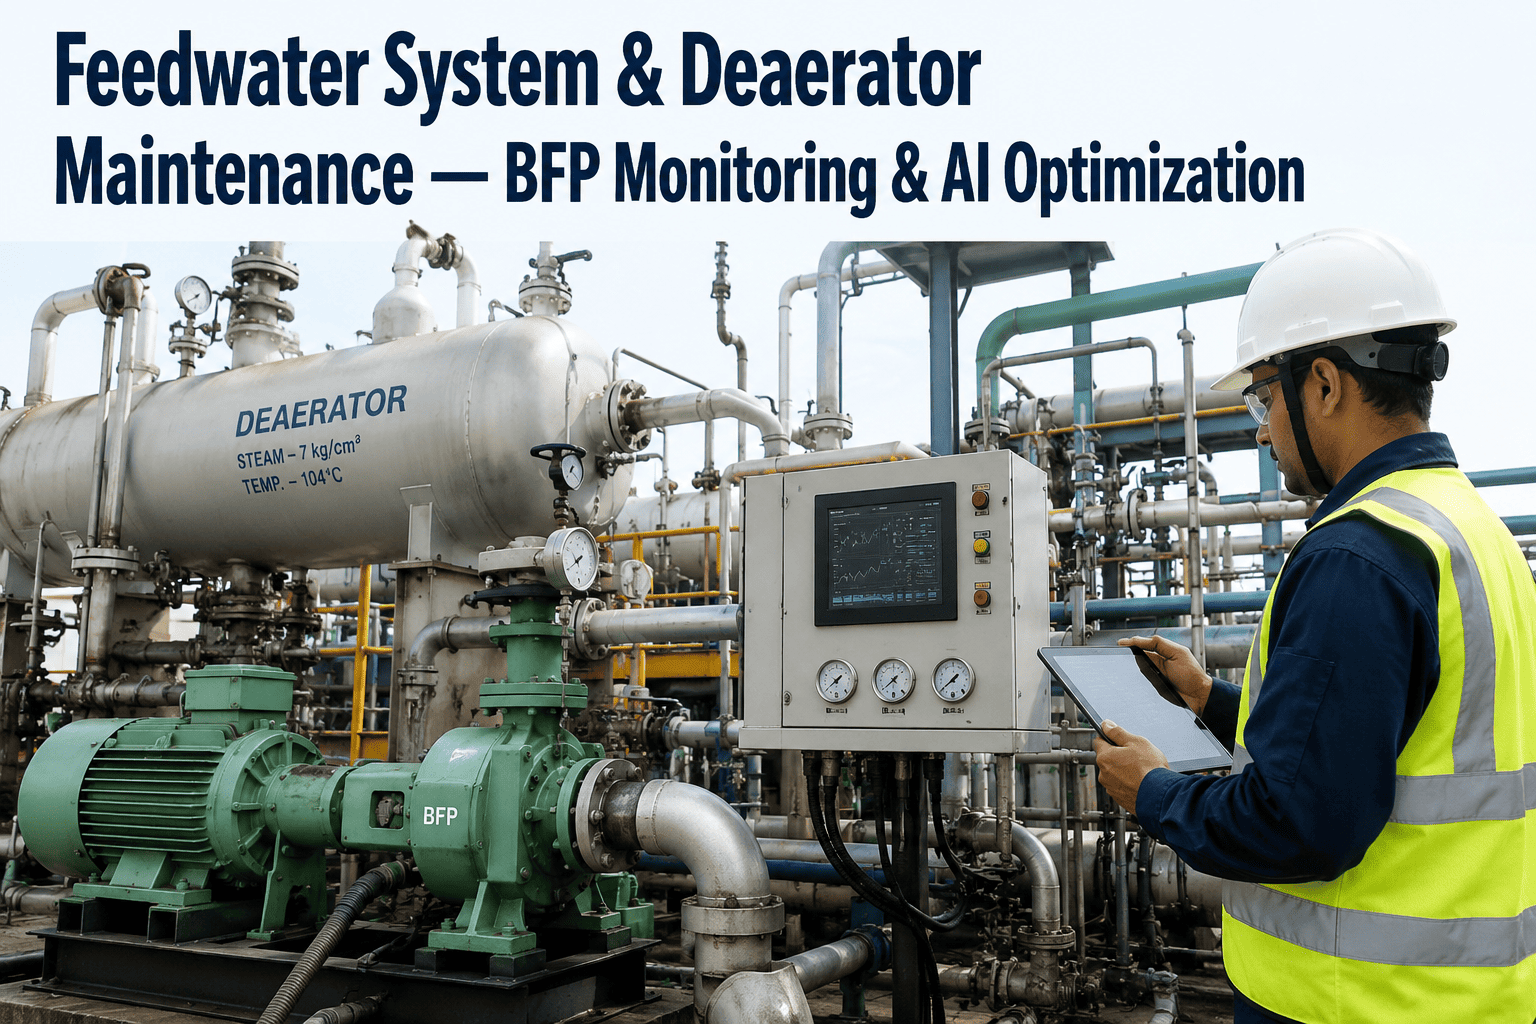
Non-condensable gases entering through LP turbine seals, expansion joints, and valve packing blanket the tube surface and insulate it from steam, raising backpressure even with perfectly clean tubes and cold water. The air removal system's actual extraction rate against its rated capacity is the tell — a shrinking margin there predicts vacuum trouble before backpressure itself moves.
What Backpressure Creep Actually Costs
Heat Rate and Output Impact by Backpressure Deviation
The relationship between backpressure and output isn't linear across the whole operating range, but near typical design points, small deviations compound faster than most operators expect — a gauge reading that looks like a rounding error on the control room screen can represent real dispatch revenue lost every single hour it persists uncorrected.
| Backpressure Above Design | Approx. Heat Rate Penalty | Approx. Output Loss (600 MW unit) | Typical Root Cause |
| +0.5 inHg |
0.5-1.0% |
2-4 MW |
Elevated cooling water inlet temp |
| +1.0 inHg |
1.0-2.0% |
4-8 MW |
Tube fouling or reduced CW flow |
| +1.5 inHg |
1.8-3.0% |
7-12 MW |
Combined fouling and air in-leakage |
| +2.0 inHg |
2.5-4.0% |
10-16 MW |
Air ejector capacity shortfall |
Figures are directional and vary by unit design and site conditions — the diagnostic value is in the trend direction and which lever moved first, not the absolute megawatt number alone.
Diagnostic Flow
From a Rising Gauge to a Confirmed Root Cause
A five-step sequence separates the three levers cleanly, so the maintenance action that gets scheduled is the one that actually addresses what moved. Skipping straight from a rising gauge to a cleaning work order is the single most common shortcut that wastes outage time on the wrong fix.
1
Baseline Comparison
Compare current backpressure against the expected value for today's cooling water inlet temperature and load, not against a flat historical average.
2
Approach Temp Check
If cooling water inlet temperature itself is elevated versus wet-bulb expectation, the cooling tower side is implicated first.
3
Cleanliness Factor Trend
If inlet water is normal but CF has been declining steadily, tube fouling is the likely driver and cleaning is justified.
4
Air Removal Rate Check
If CF and inlet water both look normal, check the air ejector's extraction rate against its rated capacity for a shrinking margin.
5
Corrective Action
Route the confirmed cause to the correct fix — tower fill inspection, tube cleaning, or air in-leakage survey — instead of defaulting to cleaning.
See Your Own Vacuum Trend Decomposed
iFactory Separates Cooling Water, Fouling, and Air In-Leakage From One Backpressure Signal
No new instrumentation required in most cases. iFactory reads existing condenser and cooling tower data to tell you which of the three levers is actually moving.
Tube Cleaning Scheduling
Letting Cleanliness Factor, Not the Calendar, Decide When to Clean
Cleaning tubes too early wastes an outage day on a condenser that wasn't limiting output. Cleaning too late leaves megawatts on the table for weeks past the point cleaning would have paid for itself. A cleanliness factor threshold table turns that judgment call into a documented trigger everyone on the reliability team can act on the same way, regardless of who happens to be reviewing the trend that week.
CF above 85%
No action — tubes performing at or near design
CF 75-85%
Monitor trend weekly, schedule cleaning at next planned outage
CF 65-75%
Schedule cleaning within 30 days, confirm no ball-cleaning system fault first
CF below 65%
Clean as soon as operationally feasible — significant output already lost
Air In-Leakage
Where the Air Is Probably Getting In
Air in-leakage rarely comes from one dramatic failure — it accumulates from several small entry points, and the air ejector's extraction rate is usually the first place the combined effect shows up before backpressure itself moves noticeably. A structured leak survey working through the most likely points first saves hours of blind searching across the whole vacuum boundary.
LP Turbine Shaft Seals
Worn labyrinth seals on low-pressure turbine shafts are one of the most common in-leakage points, especially after extended run time since last inspection, and they tend to worsen gradually rather than fail suddenly.
Condenser Expansion Joints
Rubber or metal expansion joints between the LP turbine exhaust and condenser shell degrade over years of thermal cycling, and small cracks can be difficult to spot visually without a dedicated leak test.
Valve Packing & Flanges
Vacuum-side valve packing and flange gaskets on any line below atmospheric pressure are candidate leak points during a helium or ultrasonic survey, and they multiply quickly across a large steam plant's piping network.
Condensate Pump Seals
Mechanical seal wear on condensate pumps operating under vacuum conditions introduces air directly into the condensate stream.
Implementation Path
Getting From a Single Gauge to a Three-Lever Diagnostic
Weeks 1-2
Baseline Build
Establish expected backpressure as a function of cooling water inlet temperature and load across the historical operating range.
Weeks 3-4
Signal Separation
Connect cleanliness factor calculation and air ejector extraction rate as independently trended signals against the baseline.
Weeks 5-6
Threshold Calibration
Set cleanliness factor and air in-leakage alert thresholds specific to the unit's design margins and outage calendar.
Week 7+
Live Root-Cause Alerts
Route confirmed root-cause alerts directly to the correct maintenance action instead of a default cleaning recommendation.
Common Failure Points
Where Plants Chase the Wrong Lever
Cleaning on Calendar, Not Condition
Fixed annual tube cleaning schedules waste outage days on tubes that were still performing near design and miss the window when CF actually crossed a meaningful threshold, sometimes weeks or months earlier than the next planned outage.
Blaming Weather by Default
Rising backpressure in summer gets attributed to ambient conditions without checking whether inlet water temperature actually explains the full deviation, leaving a real fouling or leakage problem hidden inside a plausible-sounding excuse.
Ignoring Air Ejector Trend
Extraction rate is checked only during a dedicated test, missing the gradual capacity decline that predicts vacuum trouble weeks in advance and turns a small leak survey into an emergency repair.
Treating Backpressure as One Number
Without decomposing the signal, the same MW loss gets diagnosed differently by whoever happens to be reviewing it that week, and the maintenance backlog fills with inconsistent, sometimes contradictory work orders.
The plants that hold their heat rate the tightest aren't the ones with the newest condensers — they're the ones that stopped treating backpressure as a single number years ago. I've seen a unit schedule three straight outage cleanings while cleanliness factor barely moved, because nobody had separated out that the real problem was an air ejector losing capacity month over month. Once you can see which lever actually moved first, the fix stops being a guess and starts being a work order with a clear justification attached.
Desmond Okafor-Lindqvist
Thermal Performance Engineer · 16 years in fossil and combined-cycle heat rate optimization · Former condenser performance test lead
Operations Team Questions
Condenser Vacuum Optimization — Frequently Asked
What's a normal condenser backpressure range, and why does it change so much by season?
Design backpressure typically falls between 1.0 and 3.5 inches of mercury absolute depending on unit design and site cooling water source, and it shifts seasonally because it's fundamentally tied to cooling water inlet temperature, which itself tracks ambient wet-bulb temperature. A unit designed around a 70°F cooling water inlet will run measurably higher backpressure in August than in January purely from that temperature swing, with no equipment problem involved at all. This is exactly why comparing today's backpressure against a flat historical average misleads — the comparison needs to account for today's actual inlet temperature and load.
Contact our support team to build a load- and temperature-adjusted backpressure baseline for your unit.
How is cleanliness factor actually calculated, and what data does it need?
Cleanliness factor compares the condenser's actual overall heat transfer coefficient, derived from measured steam-side and water-side temperatures and circulating water flow, against the manufacturer's clean design value for the same operating conditions. It requires condenser inlet and outlet water temperature, saturation temperature on the steam side, and circulating water flow rate, all of which most plants already have instrumented for other purposes. The result is expressed as a percentage of design performance, which is what makes it comparable across different load points and seasons in a way raw backpressure alone isn't.
How much air in-leakage is considered a problem versus normal for a large steam turbine?
Air in-leakage limits are typically expressed in standard cubic feet per minute per unit of MW capacity, with vendor guidance generally setting acceptable levels in the low single digits of SCFM per 100 MW for a well-sealed unit, though exact figures vary by turbine OEM and condenser design. The more actionable signal for most plants is trend rather than absolute value — a steady climb in required air ejector capacity over weeks or months, even while still within nameplate limits, reliably predicts a leak developing well before backpressure itself shows a clear deviation.
Can improving condenser vacuum actually pay back the cost of tube cleaning or an air leak survey?
Yes, and the payback math is usually straightforward once the megawatt impact from the table above is converted into dispatch value — even a partial recovery of 1 inHg of avoidable backpressure on a large unit running near full load for most of the year adds up to a meaningful annual output gain against a cleaning or leak-survey cost measured in a single outage day or a contracted helium test. The harder part isn't justifying the fix once the cause is confirmed, it's confirming which of the three levers is actually responsible before committing outage time to the wrong one.
Book a demo to see how a decomposed vacuum diagnostic builds that payback case automatically from your existing data.
Does ball cleaning or brush cleaning system operation affect how I should read cleanliness factor trends?
Yes — an online ball cleaning or brush system running continuously should hold cleanliness factor relatively stable near design, so a declining CF trend despite an operating cleaning system points toward a system fault, such as balls not circulating through all tube passes, rather than simply needing more aggressive cleaning. Confirming the cleaning system itself is functioning correctly is worth doing before scheduling an offline mechanical or chemical cleaning outage, since the fix for a broken online system is very different from the fix for tubes that are genuinely fouled beyond what continuous cleaning can manage.
Stop Guessing Which Lever Moved
Get a Vacuum Diagnostic That Tells You Where the Megawatts Went
iFactory decomposes your condenser backpressure trend into cooling water, tube cleanliness, and air in-leakage signals — so the next maintenance action targets the actual cause, not a guess.