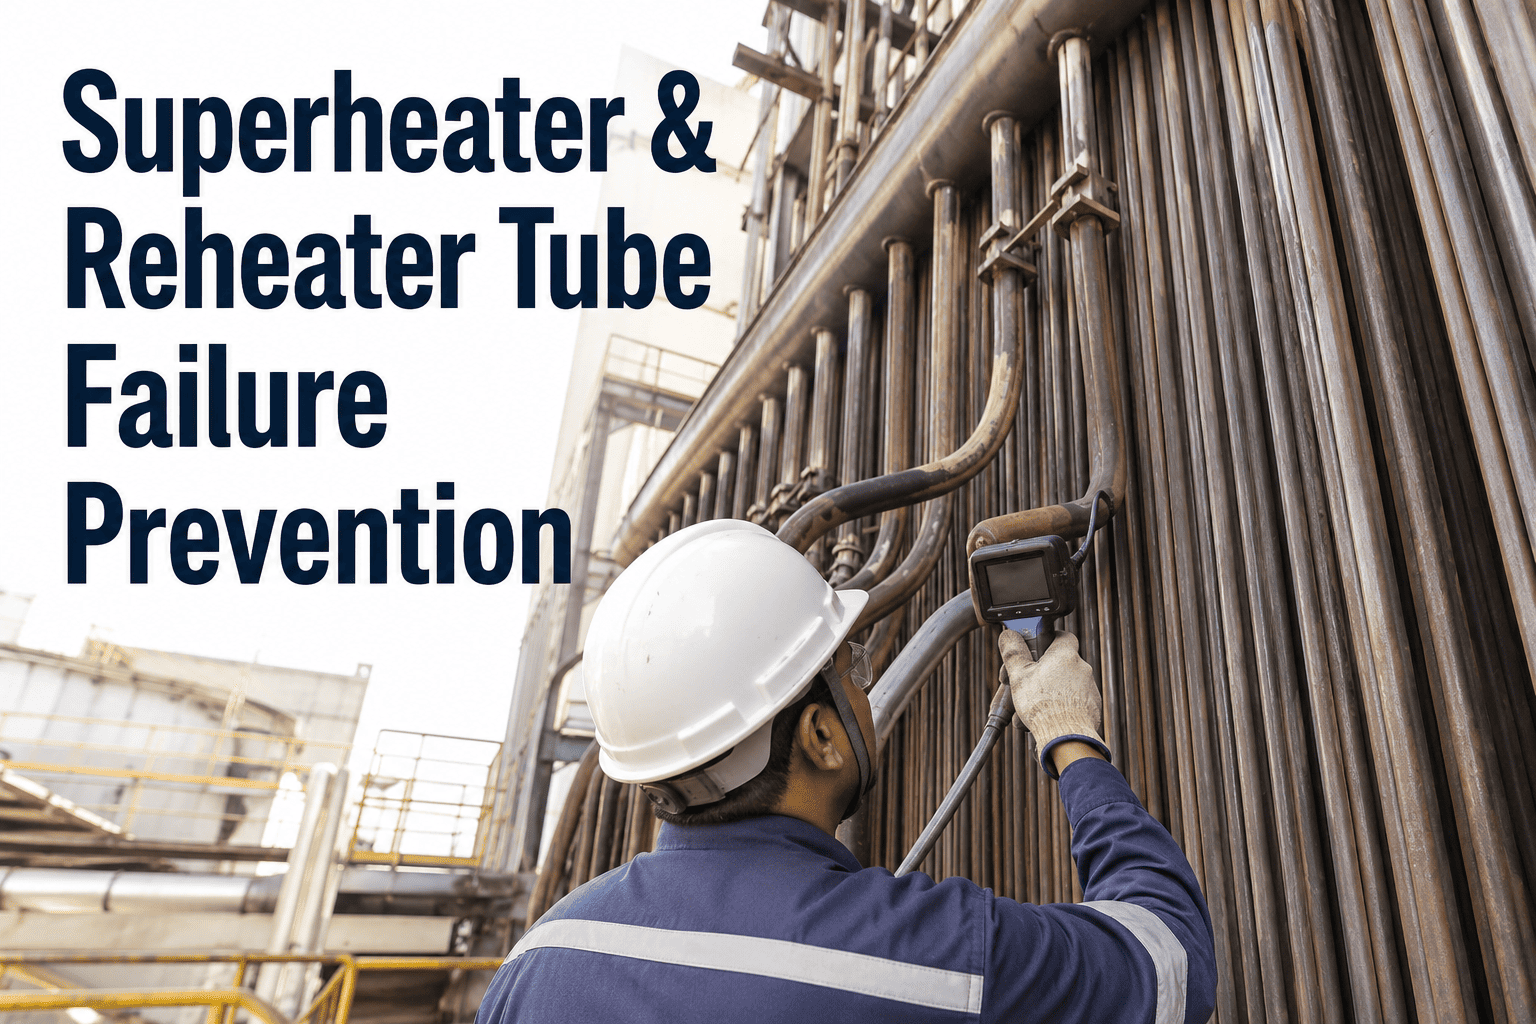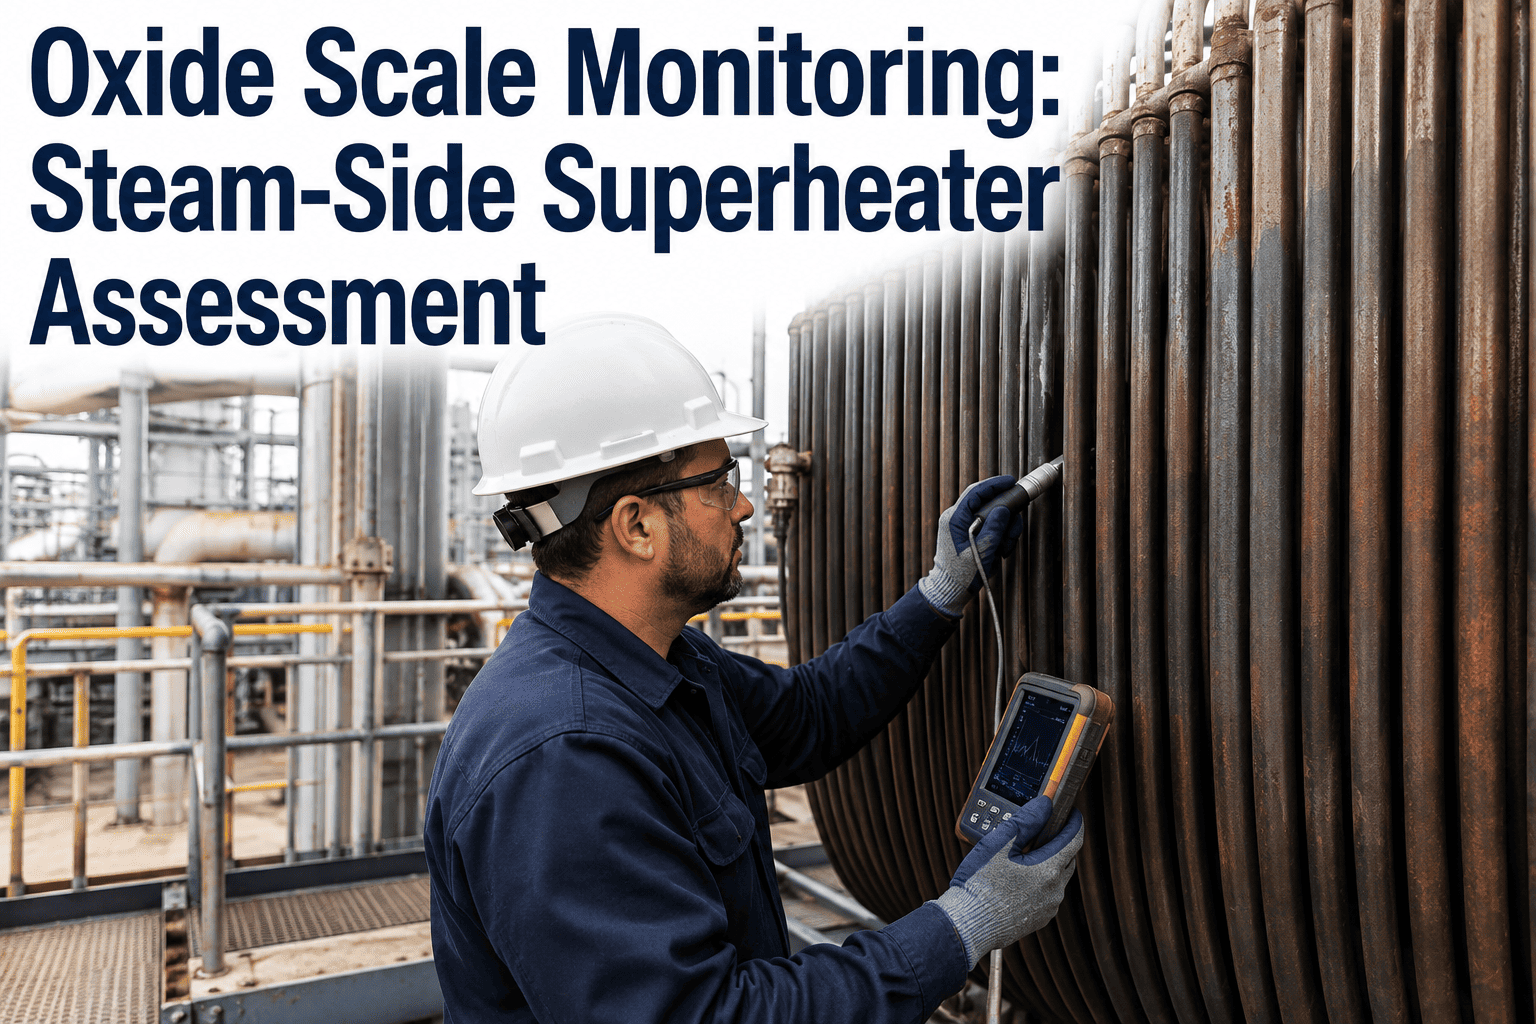
A superheater tube does not fail because someone skipped an inspection — it fails because an oxide layer growing quietly on the inside of the tube, invisible from any external walkdown, crosses a thickness where it stops protecting the metal and starts insulating it instead. That insulating effect raises tube metal temperature at the exact spot where creep damage accumulates fastest, and if a shutdown cools the tube quickly enough, the scale can crack and exfoliate, drop into a bend, and block steam flow outright. The tube that ruptures on the next startup usually carries no visible warning until the failure itself becomes the first data point anyone has. Reliability teams that track scale thickness growth over time catch this shift long before it reaches rupture, and plants building that visibility into their boiler program can book a demo to see how it fits an existing inspection plan.
Why Steam-Side Oxide Scale Is the Damage Mechanism Nobody Sees Coming
Every superheater and reheater tube in a boiler running above roughly 480°C is growing an oxide layer on its inside surface, all the time, whether anyone is tracking it or not. Superheated steam reacts continuously with the tube alloy to form magnetite, and for most of a tube's life that oxide layer is doing exactly what it should — forming a thin, adherent barrier that actually slows further oxidation. The problem is that the layer keeps growing on a predictable curve, and past a certain thickness it stops behaving like protection and starts behaving like insulation, holding heat against the tube wall instead of letting it pass through to the steam.
That shift matters because superheater and reheater tubes already run close to their metallurgical temperature limits by design. A few extra degrees of metal temperature, sustained over months, is enough to move a tube meaningfully further along its creep-life curve, and creep damage does not reverse itself once it starts accumulating. The tube does not announce this shift. From the outside, an oxide-thickened tube looks identical to a clean one, which is exactly why oxide scale ranks among the four dominant superheater and reheater failure mechanisms alongside creep, thermal fatigue, and fireside erosion, and why it is so often the one that gets discovered only after a forced outage rather than before one.
Scale growth follows a parabolic law tied directly to operating temperature, which means the hottest-running tubes in a superheater bank are not just the most stressed thermally — they are also the ones accumulating insulating scale the fastest, compounding both risks on the same section of tubing at the same time.
This is also why oxide scale tends to get deprioritized relative to more visible damage mechanisms. A boiler team can walk a superheater platform and spot a sagging tube support, a soot-blower erosion pattern, or a header weld showing surface cracking without any special instrumentation. Scale thickness offers no equivalent visual cue, and the tubes most likely to be affected are often the ones deepest inside the bank, furthest from easy access during an outage. Without a deliberate measurement program tied to alloy grade and operating history, scale-driven overheating stays invisible until it presents as a rupture, at which point the diagnosis happens after the outage rather than before it.
The Oxide Growth Timeline: From Protective Layer to Failure Trigger
Oxide scale does not appear suddenly. It moves through a recognizable sequence over years of operation, and the timeline below reflects the stages a typical superheater tube passes through as scale accumulates on its steam-side wall, from a benign protective film through to the point where exfoliation becomes a real possibility.
Protective Film Forms
In early service, the magnetite layer forms thin and adherent, actually slowing further oxidation of the base metal. Tube metal temperature stays close to design values and the scale itself is not yet a risk factor worth tracking closely.
Parabolic Thickening Begins
Growth rate is governed by operating temperature and alloy composition, so hotter sections of a superheater bank thicken faster than cooler ones. Growth is still gradual here, but the rate itself is a leading indicator worth trending per tube location.
Insulating Effect Takes Hold
Once scale crosses a critical thickness, it begins acting as a thermal barrier rather than a protective layer, and tube metal temperature starts climbing even though steam temperature and firing rate have not changed. This is the point where creep life starts eroding faster than the operating log would suggest.
Strain Accumulates During Cool-Down
Oxide and base metal expand and contract at different rates. A slow cool-down through a wide temperature range during shutdown puts the thickened scale under strain it did not experience during steady operation, and that strain is what eventually cracks the layer.
Exfoliation and Blockage
Cracked scale spalls away from the tube wall in flakes. Larger fragments settle at the bottom of pendant bends or hairpin sections rather than moving with the steam, and an accumulation of fine particles plus condensate at startup can sinter into a mass that partially or fully blocks steam flow through that section.
How Scale Thickness Maps to Tube Overheating Risk
Not every micron of oxide scale carries the same consequence. The relationship between measured scale thickness and the resulting rise in tube metal temperature is where a monitoring program earns its value, because it turns a raw thickness reading into an actual risk signal rather than just another number in an inspection report.
Once accumulated scale passes roughly 0.3 mm on typical alloy grades, tube metal temperature tends to rise sharply enough to noticeably accelerate creep damage and shorten remaining tube life, which is why that threshold anchors most scale-based inspection triggers rather than a fixed calendar interval.
Scale Behavior Differs by Alloy — What That Means for Monitoring
Superheater and reheater banks are rarely built from a single alloy. Lower-temperature sections often run low-alloy ferritic steel, hotter sections step up to martensitic or austenitic grades, and each of those alloy families grows and sheds oxide scale differently. A monitoring program that applies one threshold across every tube in the bank will consistently misjudge risk on at least one of these three profiles.
Common on lower-temperature superheater and reheater sections. Oxide grows faster relative to its temperature range than the higher-alloy grades, and the scale that forms tends to be less adherent, making earlier and more frequent thickness checks worthwhile even though this alloy typically operates at lower absolute temperatures.
Used where higher strength at elevated temperature is needed without moving to full austenitic grades. Scale growth and exfoliation behavior sits between the ferritic and austenitic profiles, and its strain response during cool-down transients is a specific factor worth tracking separately from either neighboring alloy class.
Deployed on the hottest superheater and reheater sections. Chromium content generally slows oxide growth compared to ferritic grades, but the scale that does form can still exfoliate under the right cool-down conditions, and when it does, the flakes tend to be denser and more likely to lodge in bends.
What Actually Triggers Exfoliation, Beyond Simple Thickness
Thickness alone does not tell the whole story. Laboratory and field studies on steam-side scale consistently point to a small set of contributing factors that determine whether a given thickness of scale stays put or breaks loose, and a monitoring program that only tracks thickness misses most of them.
Rate and Depth of Cool-Down
A slow cool-down through a wide temperature range during a shutdown creates far more differential strain between oxide and base metal than steady operation ever does. Units with frequent start-stop cycling or unplanned trips accumulate this strain faster than units that run steady-state for long stretches.
Feedwater and Fuel Contaminants
Elements such as silicon, vanadium, and aluminum entering from feedwater chemistry or fuel combustion can destabilize the magnetite layer, promoting low-melting-point compounds that weaken scale adhesion and make spallation more likely at a given thickness than it would otherwise be.
Tube Geometry and Bend Location
Regular bends, short bends, and hairpin sections each collect exfoliated flakes differently, and horizontal or sagged sections that trap condensate at startup are more prone to the sintered blockages that follow an exfoliation event than straight, well-drained runs.
Alloy and Scale Adhesion Characteristics
Each alloy class has a different strain trajectory before scale failure, meaning the same operating history can leave one alloy's scale intact while another alloy's scale has already begun cracking, which is exactly why alloy-specific thresholds matter more than a single fleet-wide number.
The Downstream Cost of an Undetected Exfoliation Event
When scale exfoliation and the blockage it causes go undetected until failure, the consequences rarely stay contained to a single tube. The chain reaction that follows a blockage event tends to touch several parts of the unit at once, which is part of why forced outages tied to superheater and reheater tube failures are so expensive relative to their frequency.
Localized Overheating
A blocked or partially blocked tube section loses steam flow cooling exactly where it needs it most, driving metal temperature up sharply and pushing that section into accelerated short-term overheating rather than gradual creep.
Wall Thinning and Rupture
Overheating combines with internal carbon diffusion and microstructural changes to thin the tube wall and soften the metal, a degradation pattern that has been documented reducing tube hardness significantly before ductile rupture occurs.
Turbine Blade Erosion
Fine exfoliated particles that do get carried downstream with the steam do not stop at the boiler. They travel into the turbine, where they contribute to blade erosion and a measurable loss of turbine efficiency over time.
Unplanned Outage Duration
Because the failure typically presents with no prior warning in the operating log, the resulting outage tends to run longer than a planned tube replacement would, since the extent of blockage and affected sections has to be diagnosed after the fact rather than scoped in advance.
How AI-Based Oxide Scale Monitoring Changes the Inspection Cycle
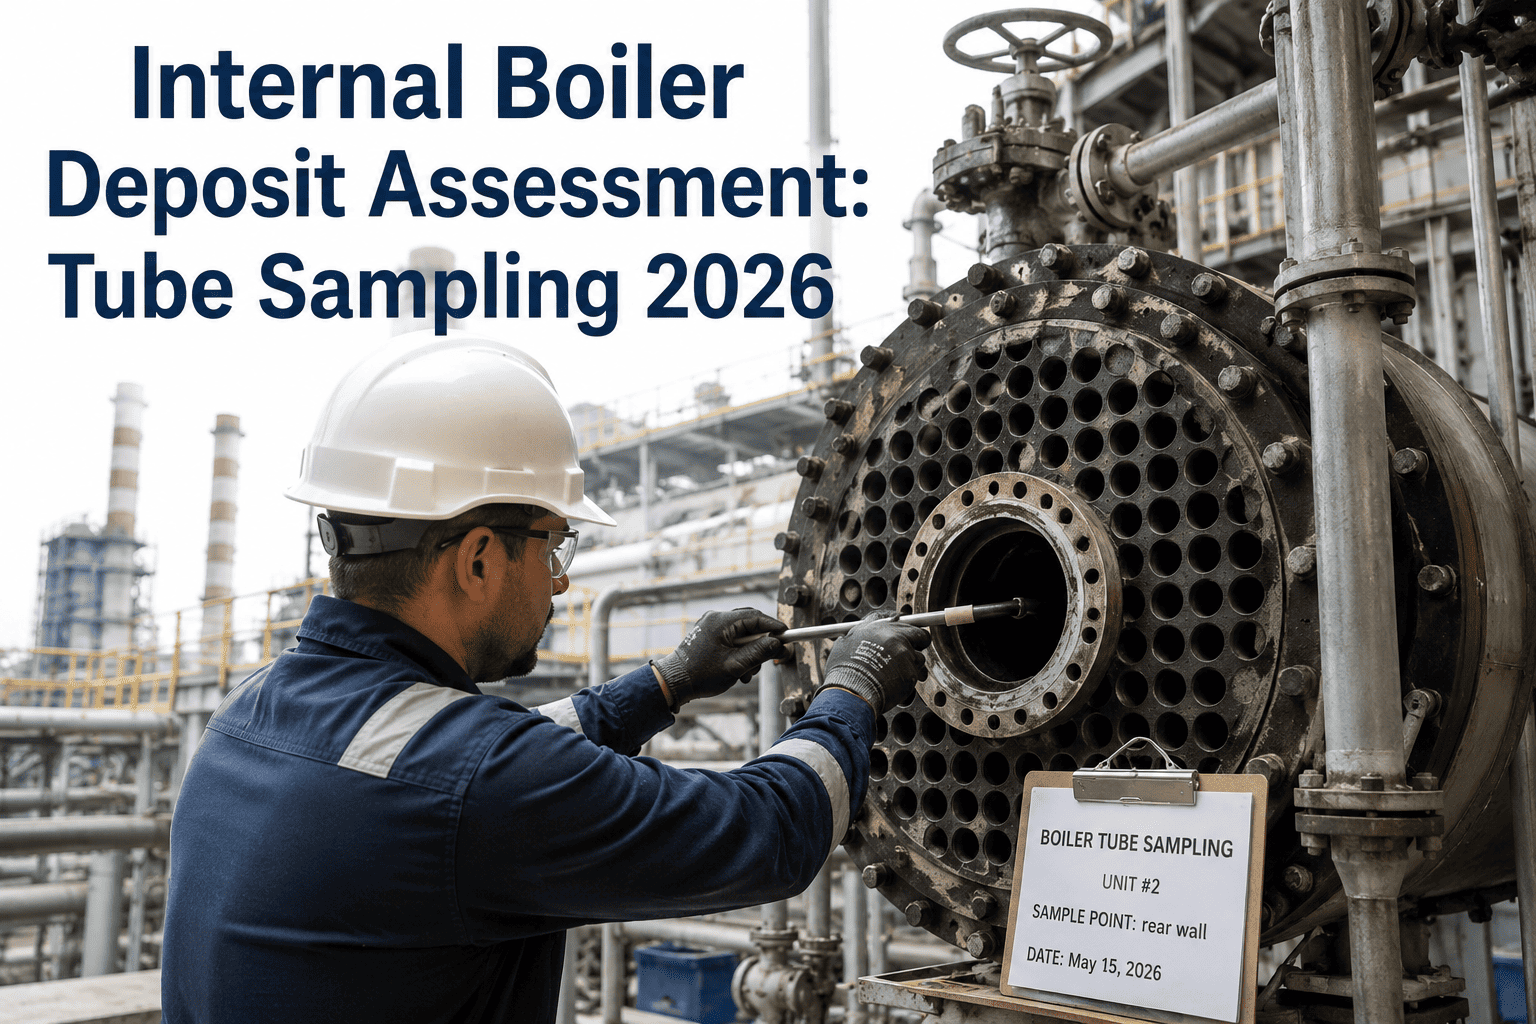
Traditional oxide scale assessment relies on periodic outage-window measurements, usually taken by pulling a small sample of tubes for replica metallography or electromagnetic scale-thickness testing and extrapolating the result across the rest of the bank. That approach works, but it leaves long gaps between data points and assumes the sampled tubes represent the whole bank fairly. An AI-based monitoring approach closes that gap by treating scale growth as a continuous, trackable trend rather than a snapshot taken once every few years.
Establish the Baseline
Existing scale thickness measurements, alloy grade, tube location, and operating temperature history are compiled into a single record per tube section, giving every location a documented starting point instead of relying on institutional memory.
Model the Growth Curve
Operating temperature and time in service are used to project each tube section's parabolic scale growth forward, flagging sections approaching the thickness range where insulating effects and exfoliation risk both start climbing.
Layer In Cycling and Chemistry Data
Startup and shutdown frequency, cool-down rate, and feedwater chemistry excursions are added to the thickness projection, since these are the factors that determine whether a given thickness is likely to stay adherent or exfoliate.
Prioritize the Next Inspection Window
Tube sections projected to cross the elevated or critical thickness range before the next scheduled outage move to the top of the inspection scope, so measurement time and budget go to the sections actually approaching risk.
Periodic Sampling vs Continuous Scale Trend Monitoring
The table below lays out how a periodic, sample-based scale assessment compares against a continuously trended monitoring approach, across the factors that matter most when a planner is deciding how much confidence to place in either method.
| Factor | Periodic Sampling | Continuous Trend Monitoring |
|---|---|---|
| Data frequency | Taken during scheduled outages, often years apart | Every reading logged and trended as it becomes available |
| Coverage | A representative sample of tubes, extrapolated to the bank | Every monitored tube section carries its own growth curve |
| Cycling sensitivity | Start-stop history considered informally, if at all | Cool-down rate and cycling frequency feed directly into risk scoring |
| Early warning | A tube can cross the critical range between sampling windows | Projected crossing dates flag sections before the threshold is reached |
| Inspection scoping | Based on last cycle's sample results and inspector judgment | Driven by projected growth curves for the specific outage window |
Mistakes Plants Make When Managing Steam-Side Scale
Boiler teams that have dealt with an exfoliation-related failure tend to trace the miss back to one of a small set of recurring blind spots. Naming them helps a new monitoring effort avoid repeating the same gaps.
Applying One Threshold Fleet-Wide
A single scale thickness limit applied across ferritic, martensitic, and austenitic sections alike will consistently be too conservative for one alloy and too permissive for another, since each grade's growth rate and exfoliation strain response is different.
Ignoring Cool-Down Rate as a Risk Factor
Two tubes with identical scale thickness can carry very different exfoliation risk depending purely on how quickly the unit has cooled through past shutdowns, a factor that rarely appears on a standard inspection checklist at all.
Treating a Sampled Tube as Representative
The hottest tubes in a bank, often located at the steam outlet or on the fireside face, grow scale faster than the tubes typically pulled for sampling, which means fleet-average figures can understate the real risk on the worst-performing sections.
Not Connecting Feedwater Chemistry to Scale Data
Contaminant excursions in feedwater chemistry are often logged in a separate system entirely from tube inspection records, which means a chemistry event that destabilized scale adhesion months earlier never gets connected to the exfoliation failure it likely contributed to.
None of these mistakes require a dramatic overhaul to fix. Most plants already collect the underlying data — thickness readings from replica sampling, cycling counts from the DCS historian, chemistry logs from the water treatment team — the gap is almost always in connecting those records to a single per-tube risk view rather than leaving them siloed in separate reports that nobody cross-references until after a failure has already happened.
Frequently Asked Questions: Oxide Scale Monitoring for Superheater Tubes
What causes oxide scale to build up on the inside of superheater tubes?
Superheated steam reacts continuously with the tube alloy to form an oxide layer, primarily magnetite, and this reaction never fully stops as long as the tube is in service at elevated temperature. Growth rate follows a parabolic relationship with operating temperature, so hotter sections of a bank thicken faster than cooler ones, and alloy composition changes how quickly and how adherently that layer forms. Teams wanting a walkthrough of how this applies to their specific alloy mix can contact iFactory Support for more detail.
At what scale thickness does tube metal temperature start rising significantly?
On typical alloy grades, tube metal temperature tends to climb sharply once accumulated scale passes roughly 0.3 mm, because the layer has crossed the point where its insulating effect outweighs its protective function. Below that range, scale is generally considered part of normal operating baseline, though the exact threshold shifts somewhat by alloy and operating temperature, which is why alloy-specific tracking matters more than a single fixed number applied fleet-wide.
Why does scale exfoliate during shutdown rather than during normal operation?
Oxide scale and the base tube metal expand and contract at different rates, and that mismatch produces relatively little strain during steady-state operation when temperatures stay stable. A slow cool-down through a wide temperature range, however, puts the accumulated scale under strain it was not built to handle at that thickness, which is why exfoliation events cluster around shutdowns and start-stop cycling rather than steady running.
How is oxide scale thickness actually measured without cutting a tube open?
Electromagnetic and ultrasonic-based techniques can estimate steam-side scale thickness from the outside of the tube without requiring removal, and these readings are typically supplemented by replica metallography and periodic tube sampling during major outages for calibration. Plants wanting to see how these readings integrate into a broader monitoring workflow can book a demo to review the data pipeline directly.
Can oxide scale monitoring be added without replacing our current outage inspection process?
Yes — most plants start by layering scale thickness trending, alloy-specific thresholds, and cycling history on top of their existing sampling program rather than replacing it outright. The outage-window measurements a plant already takes become inputs to the growth model instead of standalone data points, and the inspection scope for the next outage is then built from projected risk rather than last cycle's checklist alone.