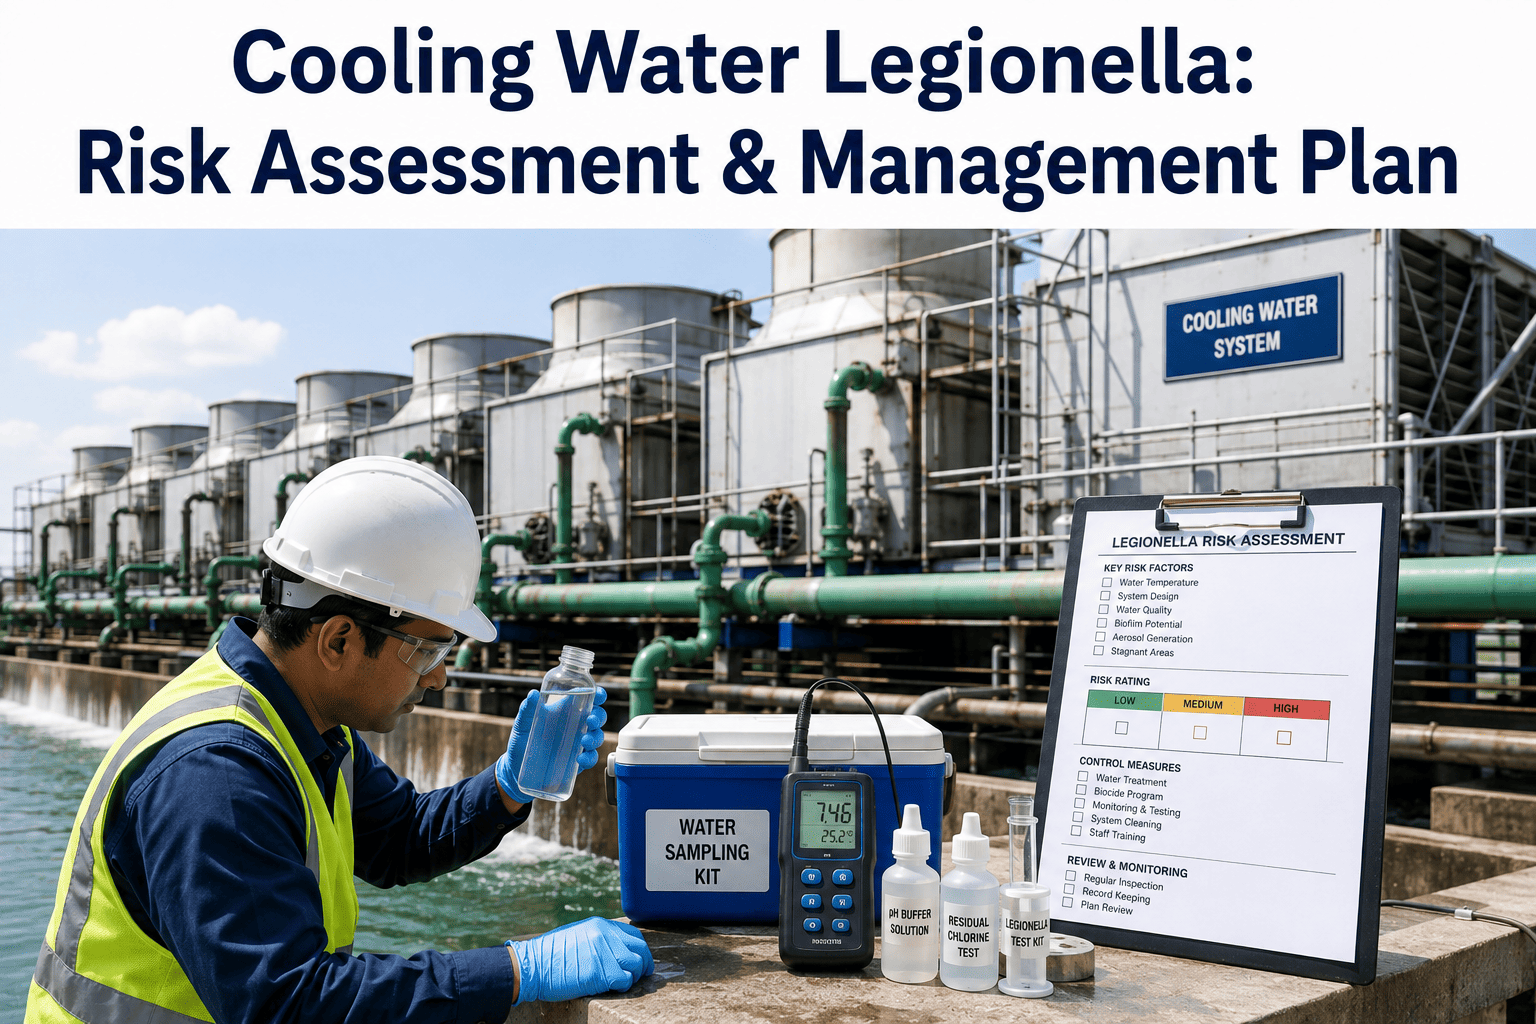
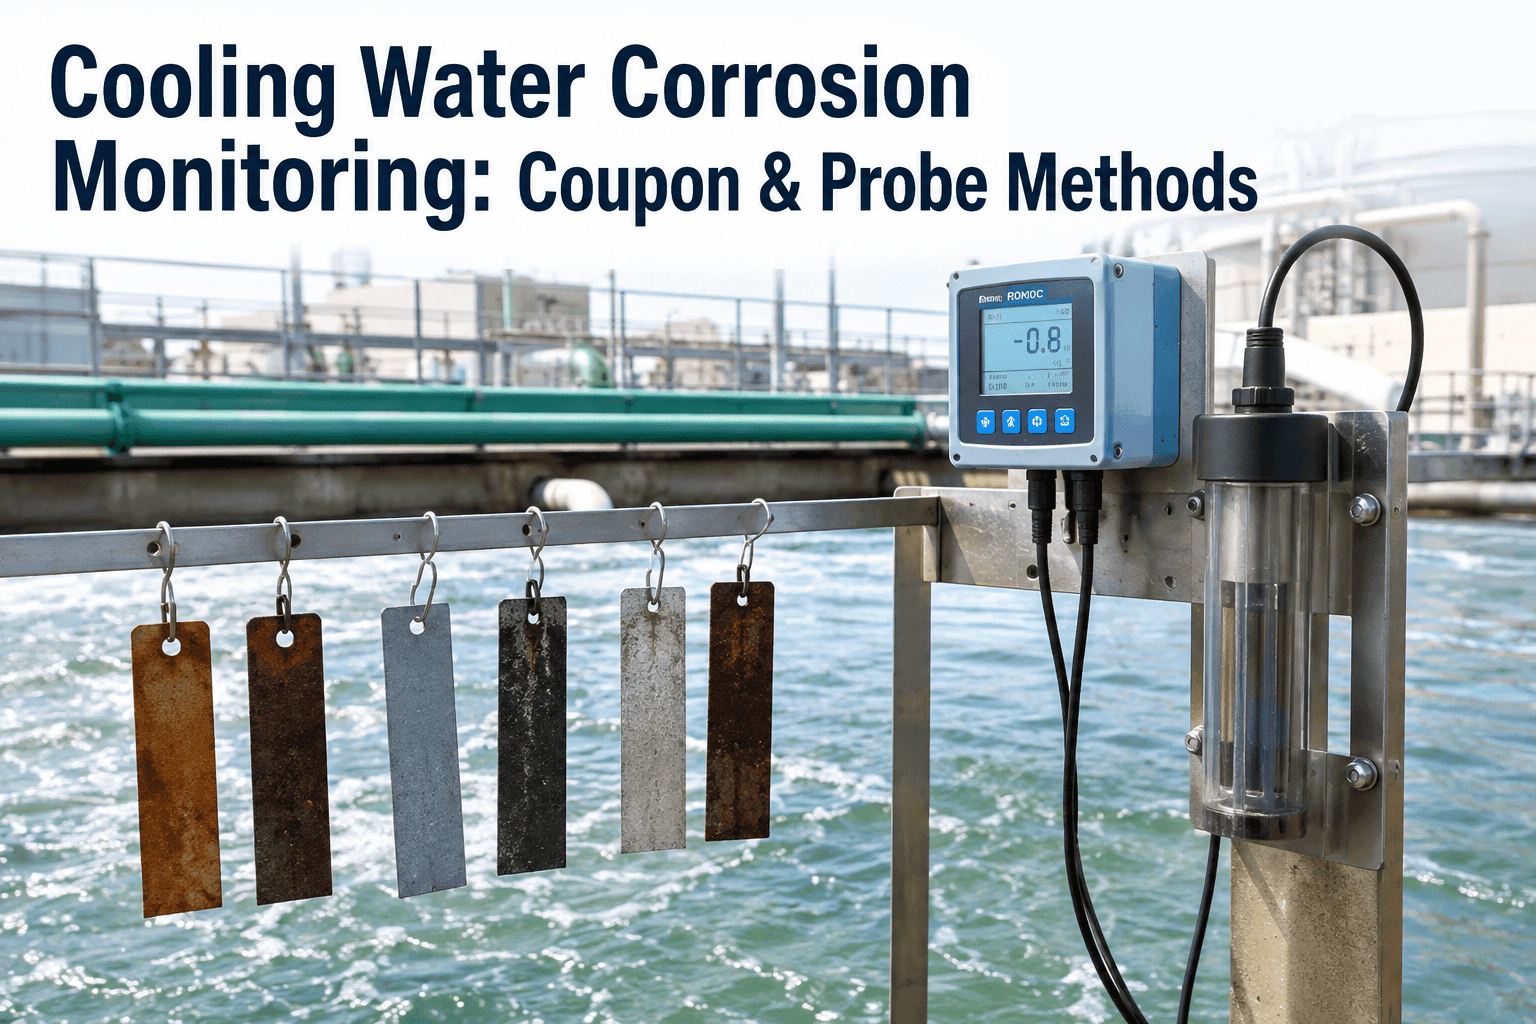
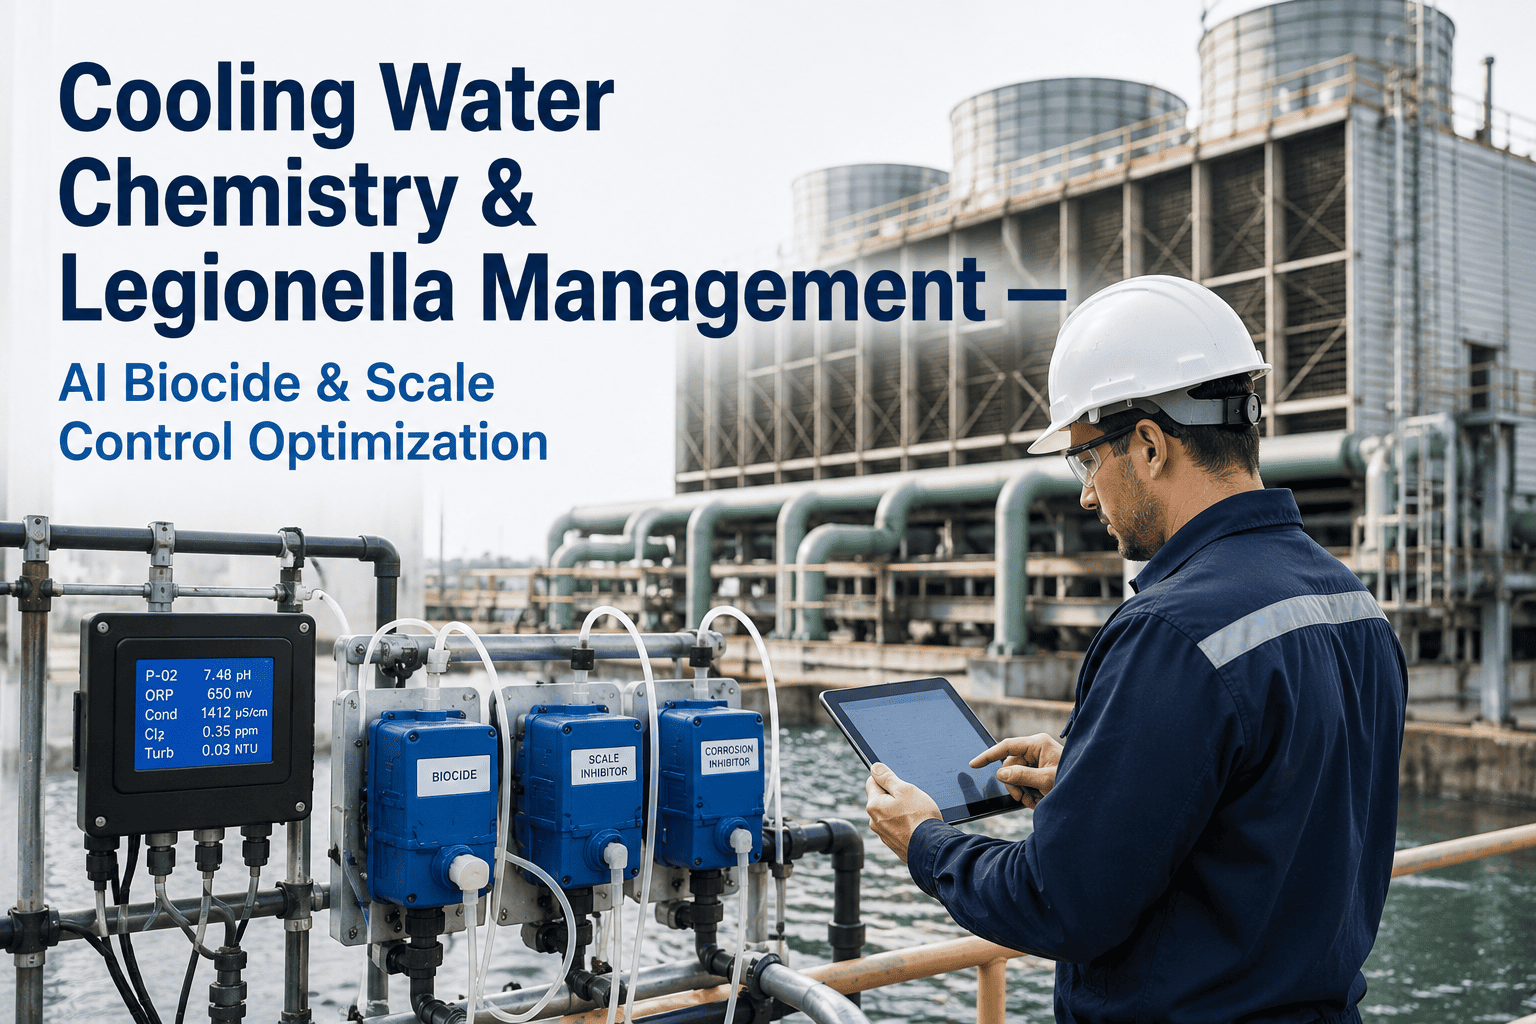
A cooling tower is one of the most efficient Legionella incubators a plant can build without meaning to, warm water, constant aerosol generation, and biofilm-coated surfaces sitting together in exactly the conditions the bacteria needs to multiply. Most systems run for years without an issue, right up until a control measure quietly lapses, a temperature setpoint drifts, a biocide feed pump underperforms, or a low-flow zone goes unnoticed, and a routine culture sample comes back with a count that triggers a mandatory shutdown and public health notification. The gap between a compliant program on paper and one that actually catches a rising count in time is almost always monitoring frequency and how quickly a result reaches someone who can act on it. You can see how continuous monitoring closes that gap by choosing to book a demo with our team.
WATER CHEMISTRY · LEGIONELLA RISK · ASHRAE 188 COMPLIANCE
Legionella Risk Doesn't Announce Itself. Your Water Management Program Has to Find It First.
Cooling towers, evaporative condensers, and closed-loop systems all carry Legionella risk that shifts with temperature, flow, and biocide performance day to day. iFactory keeps every risk factor in your water management program trended and visible, so a drifting control measure gets corrected before a culture result forces a shutdown.
SAMPLE RISK FACTOR SCORECARD · COOLING TOWER 3
Water Temperature Zone
Medium Risk
Stagnation / Dead Legs
Low Risk
Biofilm / Scale Presence
High Risk
Aerosol Drift Exposure
Medium Risk
WHY COOLING TOWERS ARE UNIQUELY EXPOSED
Four Conditions That Make Cooling Water Systems a Natural Fit for Legionella
Legionella bacteria are common in natural water sources at low concentrations that pose little risk on their own. A cooling tower changes that equation entirely, providing the specific combination of warmth, stagnation, nutrients, and aerosolization that lets a low background count multiply into a genuine exposure risk within days rather than months.
None of these four conditions are unusual or avoidable in a working cooling system, they are inherent to how the equipment functions. That is exactly why a water management program has to actively manage each one on an ongoing basis rather than treating Legionella control as a one-time design decision made when the tower was installed.
Water Temperature in the Growth Range
Legionella multiplies fastest between roughly 20°C and 45°C, a range that overlaps directly with normal cooling tower basin temperatures, particularly during shoulder-season operation when heat rejection load is lower.
Stagnant Water in Low-Flow Zones
Dead legs, idle standby towers, and low-flow piping sections lose disinfectant residual faster than actively circulating water, creating pockets where bacteria can establish and grow largely undisturbed.
Biofilm and Scale as a Nutrient Source
Biofilm colonies on fill media and basin surfaces both shelter Legionella from biocide contact and supply the nutrients it needs to thrive, making biofilm control as important as disinfectant dosing itself.
Constant Aerosol Generation by Design
A cooling tower's entire function depends on generating fine water droplets for evaporative cooling, which is the same mechanism that can carry Legionella into the air where people can inhale it.
THE COMPLIANCE FRAMEWORK
What an ASHRAE 188-Aligned Water Management Program Actually Requires
ASHRAE 188 does not prescribe a single fixed testing interval for every facility, it requires a documented program built around an honest risk assessment of the specific system involved. Understanding the four core elements makes it clear why a program built on paper checklists alone tends to fall behind the standard's intent.
Keep Every Control Measure Verified, Not Just Documented
iFactory trends temperature, flow, and biocide dosing data against your program's control limits continuously, so a drifting measure is flagged the day it happens, not at the next audit.
BUILDING THE CONTROLS
From Baseline Risk Assessment to a Verified Control Program, in Five Steps
A water management program earns its value only once its control measures are actually being followed day to day, not just described in a binder. The sequence below reflects how a program moves from an initial paper assessment to something that continuously proves it is working.
1
Complete a System-Specific Risk Assessment
Map every cooling tower, closed loop, and evaporative condenser on site, along with temperature ranges, flow patterns, and any known dead legs or idle equipment.
2
Set Control Limits for Each Risk Factor
Define acceptable ranges for temperature, disinfectant residual, and biofilm indicators for each system, rather than applying one generic limit across every tower on site.
3
Schedule Biocide and Cleaning Cycles
Put oxidizing and non-oxidizing biocide dosing, along with periodic mechanical cleaning, on a fixed schedule tied to the actual risk level of each system rather than a single plant-wide calendar.
4
Monitor Continuously Between Culture Results
Track temperature, flow, and disinfectant residual continuously so a control measure drifting out of range is visible weeks before the next scheduled culture sample would reveal a rising count.
5
Verify and Document Every Control Action
Log every biocide dose, temperature check, and cleaning event automatically, so an audit or an incident investigation can confirm the program was actually followed, not just designed.
TREATMENT APPROACHES COMPARED
Three Ways Plants Approach Biocide Treatment and Monitoring
The chemistry behind Legionella control has not changed much in decades, oxidizing and non-oxidizing biocides both remain effective when dosed correctly. What separates programs that stay ahead of a rising count from ones that get surprised by a positive culture is how consistently dosing is verified and how quickly a lapse gets caught.
WHERE PROGRAMS BREAK DOWN
Common Mistakes That Undermine an Otherwise Solid Legionella Program
Most facilities that experience a Legionella-related incident already had a written water management program in place, the failure is rarely a missing plan. It is almost always a gap between what the plan describes and what actually happens day to day on the equipment.
Treating Culture Testing as the Only Monitoring Layer
Culture results can take days to return and only reflect conditions at the moment of sampling, leaving a wide gap where temperature or biocide residual could drift out of range unnoticed.
Overlooking Idle or Standby Equipment
A standby cooling tower that only runs seasonally is often left out of the regular monitoring schedule, even though stagnant idle periods make it one of the higher-risk assets on site.
Applying One Control Limit Across Every System
A single plant-wide temperature or residual limit ignores real differences in flow, exposure, and design between towers, masking risk on the systems that actually need tighter control.
Incomplete Verification Records
A program that cannot produce clear proof that biocide dosing and temperature checks actually happened as scheduled struggles to demonstrate compliance during an audit or an incident investigation.
A REAL SCENARIO
How Continuous Residual Monitoring Caught a Dosing Failure Before a Positive Culture
BEFORE
A combined-cycle plant dosed its main cooling tower with an oxidizing biocide on a fixed schedule, verified by a manual residual check once per shift. A dosing pump diaphragm began failing gradually, reducing actual chemical delivery well below the logged setpoint for nearly two weeks before a routine quarterly culture sample was due. The manual checks, taken at inconsistent times relative to the dosing cycle, never caught the shortfall.
AFTER
After adding continuous residual monitoring trended against the dosing schedule, the same gradual decline triggered an alert within days of the pump beginning to underperform, well before the next culture sample would have caught it. The pump was serviced and residual restored to target range, and the following culture result came back at background levels with no corrective action required beyond the repair already made.
GETTING STARTED
Four Steps to Strengthen Your Legionella Program This Quarter
Confirm Every Water System Is Captured in the Risk Assessment
Check that idle standby towers and closed-loop systems are included, not just the units running continuously, since idle equipment often carries the highest overlooked risk.
Set Distinct Control Limits Per System
Move away from one plant-wide temperature or residual limit and set control ranges that reflect each system's actual flow and exposure profile.
Close the Gap Between Culture Samples
Add continuous residual, temperature, or flow monitoring as a leading indicator so a control lapse is visible in days rather than waiting on the next scheduled culture result.
Centralize Verification Records
Bring dosing logs, temperature checks, and cleaning records into one place so an audit or incident review can confirm the program was actually followed as written.
FREQUENTLY ASKED QUESTIONS
Questions Facility Teams Ask About Legionella Risk Management
How often does ASHRAE 188 actually require Legionella culture testing?
ASHRAE 188 does not set one fixed interval for every facility, it requires testing frequency to be based on the site-specific risk assessment, control measures in place, and any applicable local regulations. Many cooling tower programs land on monthly to quarterly culture sampling as a baseline, with more frequent testing during startup, after a shutdown, or following any control measure disruption. The right interval depends on documented risk factors rather than a single industry-wide number.
Book a demo to see how continuous monitoring supports whatever testing interval your risk assessment calls for.
What should happen immediately after a positive Legionella culture result?
A positive result above the action level typically triggers an immediate review of control measures, often paired with a shock disinfection treatment and increased monitoring frequency until subsequent samples confirm the count has returned to an acceptable range. The specific response threshold and required actions should already be defined in the written water management program before an incident occurs, rather than decided in the moment under pressure.
Contact our support team to review how response protocols get built into a monitoring program in advance.
Can rapid testing methods replace traditional culture testing entirely?
Rapid methods, including PCR-based and ATP-based testing, provide much faster results than traditional culture, which can take several days to a week to incubate, making them valuable as an early screening tool between scheduled culture samples. Most water management programs still rely on culture testing as the confirmatory method, since it remains the most established basis for regulatory and public health decisions, with rapid testing serving as an earlier warning layer rather than a full replacement.
Does automated monitoring actually reduce Legionella risk, or just improve recordkeeping?
It does both, and the recordkeeping benefit is often what gets noticed first during an audit, but the risk reduction comes from catching a drifting control measure, such as falling biocide residual or a temperature excursion, days or weeks before a scheduled culture sample would reveal a rising count. That earlier catch is what actually prevents a count from reaching a level that requires a shutdown or public health notification in the first place.
Book a demo to see how continuous data shortens that detection window.
Are idle or seasonally operated cooling towers really higher risk than towers running continuously?
Often yes, since stagnant water sitting in an idle tower loses disinfectant residual and provides an undisturbed environment for biofilm and bacterial growth to establish without the flushing effect of continuous circulation. Facilities frequently under-monitor standby equipment precisely because it is not actively contributing to plant operations, which is exactly the gap a comprehensive risk assessment needs to close before it becomes a real exposure incident.
Turn Every Control Measure Into a Verified, Trended Data Point
iFactory continuously monitors temperature, flow, and biocide residual across every cooling water system, so a drifting control measure gets caught long before a culture result forces a shutdown.