Inside a modern steam turbine, blades spin at 3,000 or 3,600 RPM with tolerances measured in thousandths of an inch and stress levels that push modern high-alloy metallurgy to its limits. What separates a turbine that runs for decades from one that fouls in months is not the metallurgy — it is what arrives at those blades dissolved in the steam. Ten parts per billion of the wrong contaminant, day after day, deposits on the low-pressure blades, degrades efficiency, initiates pitting corrosion, and sets up the stress-corrosion cracking that ends turbine sections early. This is why steam purity monitoring exists as an operational discipline in its own right, and why the industry has converged on three specific measurements — silica, sodium, and cation conductivity — as the diagnostic core of turbine chemistry protection. Teams strengthening their steam chemistry program can Book a Demo to see how iFactory turns SWAS data into automated turbine protection.
STEAM PURITY · SILICA · SODIUM · CATION CONDUCTIVITY · SWAS
Steam Purity Monitoring: Silica, Sodium, and Cation Conductivity for Turbine Deposit Prevention
A working guide to the three continuous measurements that protect steam turbines from deposits and corrosion — with IAPWS and EPRI limit values, alarm strategies, root-cause diagnostics when parameters drift, and the corrective actions that keep megawatts flowing instead of blades fouling.
SiO₂
< 10 ppb
IAPWS limit for dissolved silica in superheated steam
Na⁺
< 2 ppb
IAPWS limit for sodium in superheated steam
CC
< 0.2 µS/cm
Typical cation conductivity alarm threshold at turbine inlet
Why Steam Purity Became Non-Negotiable at Modern Pressure and Temperature
Steam purity monitoring emerged as a formal discipline in the 1970s when EPRI and OEM turbine builders began correlating stress-corrosion cracking incidents to feedwater and steam chemistry. Industry surveys from that era found that units continuously monitoring sodium and cation conductivity and holding tight limits — typically 3 ppb or less sodium and 0.2 µS/cm or less cation conductivity in the final feedwater — experienced no major stress-corrosion cracking incidents and only minor pitting corrosion. Units that did not monitor to those limits accumulated damage. The correlation was strong enough that the operational discipline moved from optional to standard across the steam power industry within a decade, and it has only tightened since.
The physics behind these limits is not intuitive. Turbines contain powerful concentrating mechanisms — as steam expands and cools, dissolved contaminants that were in the parts-per-billion range at the throttle can precipitate onto blade surfaces at parts-per-thousand concentrations within the metal-steam boundary layer. Aggressive contaminants like sodium hydroxide, sodium chloride, and silica each cause different problems: silica reduces turbine efficiency by depositing on blades and altering aerodynamic profiles, sodium salts corrode blade metallurgy and initiate pitting, and chlorides plus sulfates drive stress-corrosion cracking in high-alloy stainless components. The safe operating envelope is defined at parts-per-billion because the concentrating mechanisms inside the turbine turn those ppb-level throttle concentrations into destructive ppm-level surface concentrations.
The Three Diagnostic Parameters and What Each One Actually Tells You
Silica, sodium, and cation conductivity are not redundant measurements. Each responds to a different class of contamination event, and each has a different signature during upset conditions. A steam chemistry program that treats all three as continuous, correlated measurements can diagnose contamination sources within hours; a program that watches only overall conductivity or only sodium ends up in reactive investigations after damage has already occurred. Understanding what each parameter actually indicates is the working knowledge that separates a compliant SWAS panel from a diagnostic instrument.
Volatile Contaminant with Independent Carryover Physics
Silica is unique among common boiler-water contaminants — it can vaporize and carry over into steam independent of mechanical droplet carryover, particularly at higher boiler pressures. Selective vaporous carryover of silica can begin at pressures as low as 400 psig and becomes operationally significant above 900 psig, meaning a boiler running mechanically well can still deliver silica-contaminated steam if bulk boiler water silica is not controlled.
What it indicatesBoiler water silica concentration and vaporous carryover behavior at operating pressure
Turbine impactBlade deposits reducing aerodynamic efficiency, leading to measurable output loss over time
Measurement notePredictable from boiler water silica, so continuous steam analyzer is rarely warranted; boiler water silica trend usually adequate
Universal Tracer for Mechanical Carryover
Sodium is the workhorse tracer for overall steam purity because it appears in almost every carryover pathway — phosphate boiler treatment programs, caustic dosing, and any mechanical carryover of boiler water droplets. Continuous sodium analyzers using ion-selective electrodes routinely measure below 1 ppb, giving very high sensitivity to any droplet-carryover event or attemperation water contamination. A rising sodium trend that is not explained by boiler-side changes is almost always a carryover event.
What it indicatesMechanical droplet carryover, phosphate treatment overshoots, and attemperation water contamination
Turbine impactSodium hydroxide corrosion, sodium chloride stress-corrosion cracking, blade pitting
Measurement noteContinuous analyzer standard; often the fastest indicator of a developing carryover problem
Aggregate Indicator of Acidic Anion Contamination
Cation conductivity measures the conductivity of a sample after it has passed through a hydrogen-form ion exchange column that removes cations like sodium and ammonia. What remains is the conductivity contribution from anionic species — chloride, sulfate, carbonate — expressed as their corresponding strong acids. Because ammonia and amine cations are removed, cation conductivity gives a clean view of acidic-anion contamination that overall conductivity would mask in an amine-treated cycle.
What it indicatesChloride and sulfate contamination, condenser tube leaks, and amine decomposition products (CO₂)
Turbine impactChloride-driven stress-corrosion cracking and sulfate pitting in high-alloy stainless components
Measurement noteContinuous measurement essential; degassed variant differentiates CO₂ contribution from true anion contamination
The Steam Purity Alarm Ladder: What Each Threshold Actually Means
Modern steam chemistry programs operate against a layered alarm structure rather than a single limit. IAPWS and EPRI publish tiered normal, action-level-1, action-level-2, and immediate shutdown thresholds for each parameter, and the multi-tier approach lets operators respond proportionately to the severity of an excursion rather than treating every deviation as a shutdown event. The ladder below reflects the industry-standard thresholds most operators track continuously at the turbine inlet, with the corresponding operational response at each level.
| Alarm Level |
Cation Conductivity |
Sodium |
Operational Response |
| Normal |
< 0.2 µS/cm |
< 2 ppb |
Continue operation with routine chemistry monitoring |
| Action Level 1 |
0.2 – 0.35 µS/cm |
2 – 6 ppb |
Investigate cause, tighten monitoring, correct within one week |
| Action Level 2 |
0.35 – 0.65 µS/cm |
6 – 20 ppb |
Correct within 24 hours; consider load reduction if uncorrected |
| Action Level 3 |
> 0.65 µS/cm |
> 20 ppb |
Correct immediately or take unit offline; contamination event underway |
| Immediate Shutdown |
> 1.0 µS/cm sustained |
> 50 ppb sustained |
Trip turbine to prevent significant corrosion or deposit damage |
The ladder is not just a set of numbers — it is a decision framework tied to the physics of turbine damage accumulation. Short excursions at Action Level 1 or 2 recover with minimal damage if corrected quickly; sustained excursions at Action Level 3 accumulate deposits and corrosion damage measurably per hour. Immediate shutdown at Action Level 4 is not an overreaction — it is the recognition that continuing to run at that contamination level costs more in turbine damage than the outage costs in lost generation. Every mature steam chemistry program has this ladder written into its operating procedures with the specific numeric thresholds appropriate to the turbine, the boiler, and the OEM guidance for the unit.
The Contamination Pathway Map: Where Impurities Actually Come From
When silica, sodium, or cation conductivity rises, the diagnostic question is always the same — where is it coming from? Steam contamination has a limited set of physical pathways, and knowing the pathway map turns "the numbers are up" into a targeted investigation. The four pathways below account for the majority of contamination events in operating power plants, each with its own signature across the three parameters and its own remediation response.
01
Mechanical Carryover from Boiler Drum
Boiler water droplets physically entrained in steam leaving the drum, carrying all dissolved species with them. Signature: sodium rises proportionally to any dissolved species in boiler water, cation conductivity rises with acidic anions present in boiler water.
Common causesHigh boiler load, low drum level, mechanical damage to steam separators, foaming from organic contamination
02
Vaporous Silica Carryover
Silica selectively vaporizes into steam independent of mechanical carryover, particularly at higher operating pressures. Signature: silica rises with no corresponding sodium increase, meaning classic mechanical carryover diagnostics show clean but silica still deposits.
Common causesElevated boiler water silica, especially above 900 psig operating pressure, pretreatment silica leakage into feedwater
03
Attemperation Water Contamination
Water injected into superheated steam for temperature control carries any contaminants present in the attemperation supply directly into the steam downstream of drum-side separation. Signature: sodium and cation conductivity spike during attemperation events, correlating with superheat spray flow rate.
Common causesAttemperation water source contaminated with condensate polisher regeneration bleed-through, condenser leakage into feedwater, or makeup water contamination
04
Condenser Tube Leak
Cooling water leaking through condenser tubes into condensate, carrying chloride, sulfate, and hardness into the feedwater system. Signature: cation conductivity rises sharply, sodium may or may not rise depending on cooling water chemistry, silica typically stable.
Common causesTube erosion at inlet, tube fatigue cracks, tube-to-tubesheet joint failure, ammonia grooving on brass tubes
Cross-referencing the three parameters against these pathways is the essential diagnostic move. Silica up with sodium stable points to vaporous carryover or attemperation with silica-contaminated water. Sodium up with cation conductivity stable points to phosphate treatment overshoot or caustic dosing anomaly. Cation conductivity up with sodium stable points to condenser leak or attemperation with acidic anion contamination. Sodium up together with cation conductivity up points to classic mechanical carryover. This pattern-matching turns three continuous measurements into a fault-tree diagnostic that resolves contamination sources in operator time rather than investigation time.
THREE PARAMETERS · ONE CORRELATED VIEW · TURBINE PROTECTION
See Silica, Sodium, and Cation Conductivity as One Diagnostic Picture
iFactory streams SWAS panel data into a correlated chemistry dashboard where deviations in one parameter automatically cross-check against the others — so calibration drift, real contamination, and CO₂ ingress are distinguished in minutes instead of investigated over shifts.
The SWAS Panel: The Physical Instrument Behind the Measurements
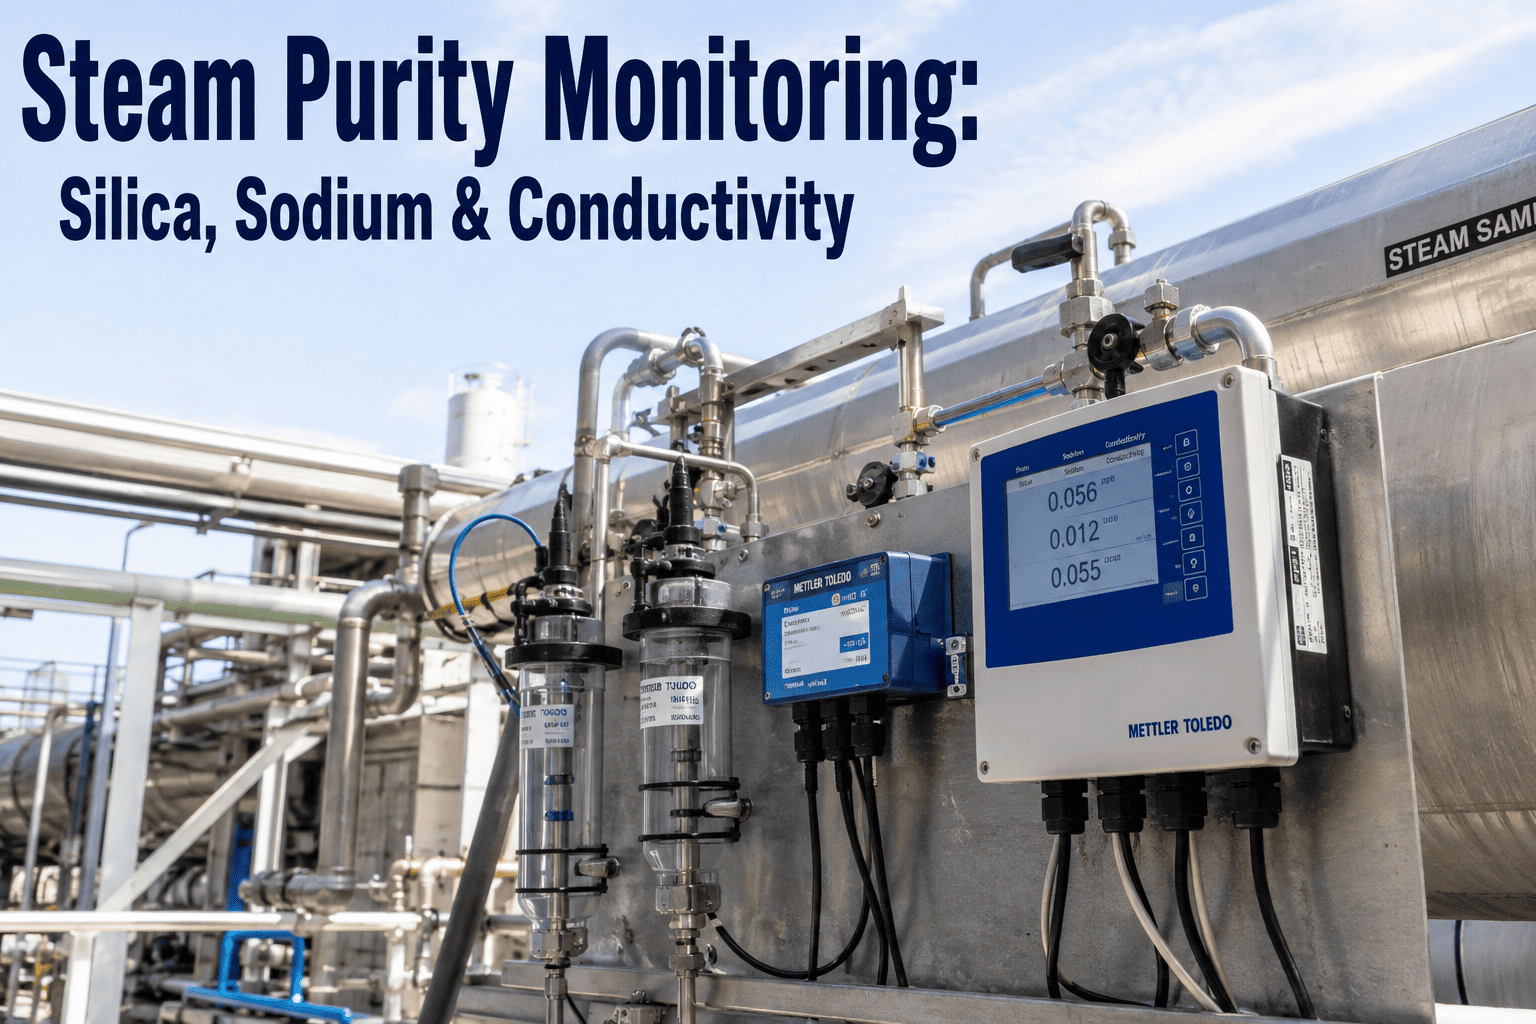
All three parameters are measured on a Steam and Water Analysis System — SWAS — panel that conditions steam and water samples for continuous analytical measurement. The SWAS panel is a piece of process equipment in its own right, with sample lines from the throttle, cold reheat, and other cycle points, temperature and pressure conditioning, cation exchange columns for cation conductivity, and analytical instruments in a cabinet or room adjacent to the turbine. A SWAS panel that is not properly maintained produces bad data, which produces bad decisions, which produces the damage the whole program was supposed to prevent.
Sample Extraction
Isokinetic sampling probes at the throttle, cold reheat, and other cycle sampling points extract representative samples of the process stream. The sample lines feed the SWAS panel with continuous flow that must be maintained to keep the analytical instruments in valid measurement conditions.
Temperature Conditioning
Sample coolers reduce sample temperature to the range required by the analytical instruments — typically 25 to 40 °C. Sample cooler water supply and heat exchange integrity are compliance-critical because a sample delivered too hot damages instruments and produces invalid readings.
Pressure & Flow Regulation
Pressure reduction from process pressure to instrument pressure, plus flow regulation to keep sample flow steady across all measurement channels. Flow variation causes systematic error in continuous measurements and is one of the most common sources of unreliable SWAS data.
Cation Exchange Column
Hydrogen-form cation exchange resin column that removes cations (sodium, ammonia, amines) from the sample stream feeding the cation conductivity cell. Column exhaustion produces gradual drift toward specific conductivity readings — a common failure mode that must be caught by scheduled regeneration or replacement.
Analytical Instruments
Continuous specific conductivity cell, cation conductivity cell, sodium analyzer (ion-selective electrode), pH meter, and optionally silica analyzer and degassed cation conductivity. Each instrument has its own calibration and maintenance schedule that determines the reliability of its output.
Data System & Alarms
Analytical outputs feed the plant control system and chemistry data historian, with alarm thresholds configured against the plant's action-level ladder. This is where the platform layer earns its keep — turning raw signals into actionable alerts routed to chemistry and operations staff.
Instrument Correlation: Distinguishing Real Contamination from Calibration Drift
One of the practical realities of steam chemistry monitoring is that continuous analytical instruments drift, and calibration issues can produce readings that look like contamination events but are actually instrument problems. A mature program uses cross-correlation between the three parameters to distinguish real from artifact, which is faster and more reliable than pulling grab samples every time a reading rises. The correlation rules below are the practical heuristics that experienced chemistry engineers use to categorize alarms as they occur.
Cation conductivity rises but sodium stays at zero
Very likely a cation conductivity instrument issue — calibration drift, cation exchange column exhaustion, or air ingress into the sample line producing CO₂ contribution. Verify with degassed cation conductivity measurement if available, and pull a grab sample for verification.
Sodium rises but cation conductivity stays flat
Points to a sodium-source event without corresponding acidic anion — most likely phosphate boiler treatment overshoot or caustic dosing anomaly. Boiler water side investigation typically resolves before the steam side needs intervention.
Both cation conductivity and sodium rise together
Real contamination event — mechanical carryover from the drum, attemperation water contamination, or a compound source. This correlation pattern is the strongest indicator that the alarm is not instrument drift and requires immediate operational response.
Cation conductivity rises with a specific pattern during startup
Common during unit startup when residual carbonate and CO₂ work through the system. Degassed cation conductivity typically stays low while standard cation conductivity spikes. Not a contamination event in the classical sense but requires monitoring until steady-state chemistry establishes.
A Scenario: The Overnight Cation Conductivity Rise
Consider a combined-cycle plant with a heat recovery steam generator feeding a steam turbine at high-pressure superheater outlet. SWAS panel readings at turbine inlet have run steady for months — cation conductivity at 0.12 µS/cm, sodium at 0.8 ppb, silica at 3 ppb. At 02:15 on a Tuesday morning, cation conductivity rises to 0.18 µS/cm, then to 0.22, then to 0.28 within an hour. Sodium remains at 0.8 ppb. Silica remains stable. The plant chemistry dashboard flags Action Level 1 on cation conductivity, and the correlation pattern — cation conductivity rising, sodium stable — suggests either instrument drift or an acidic anion source without a sodium companion.
The night shift chemistry engineer's first move is to check the degassed cation conductivity reading, which has risen only marginally from 0.10 to 0.13 µS/cm. That gap between standard and degassed cation conductivity points to CO₂ contribution rather than chloride or sulfate. The engineer pulls a grab sample for laboratory chloride analysis to verify, and simultaneously checks the ammonia feed for the cycle. Ammonia feed rate is normal, but the deaerator vent is showing intermittent operation from a stuck vent valve — CO₂ that would normally have vented is dissolving into the feedwater and increasing cation conductivity without any real acidic anion contamination.
Maintenance is dispatched to the deaerator, the vent valve is freed, deaerator operation returns to normal, and cation conductivity trends back to its baseline over the next four hours. Chloride grab sample results confirm no chloride excursion. What could have been treated as a contamination event — with defensive measures like load reduction or extended monitoring — was correctly diagnosed as an air-ingress issue and resolved without impact to the turbine or generation. This is what correlated monitoring buys: the ability to diagnose the class of event in real time, from the pattern across parameters, rather than treating every deviation as worst-case.
Frequently Asked Questions
Which is more important to monitor continuously — sodium or cation conductivity?
Both, and the value comes from monitoring them together rather than either alone. Sodium is the more sensitive tracer for mechanical carryover and gives the fastest indication of drum-side carryover events. Cation conductivity is the more comprehensive indicator of acidic anion contamination and catches chloride and sulfate ingress that sodium would miss. In practice, running both continuously and correlating their trends is significantly more powerful than either alone because the correlation pattern is what distinguishes different contamination pathways from each other and from instrument drift. Modern SWAS panels include both as standard, and the incremental cost of running both far exceeds the diagnostic value one alone would provide.
Do smaller boilers below 900 psig really need this level of monitoring?
The specific IAPWS limits tighten with pressure and turbine sensitivity, and smaller lower-pressure boilers can operate under less-strict limits. But the underlying diagnostic value of continuous sodium and cation conductivity monitoring applies at any pressure — the ability to catch condenser leaks, attemperation water contamination, and mechanical carryover events before they cause damage. Smaller units often justify a simpler SWAS panel with continuous sodium and cation conductivity but grab sampling for silica and other parameters, rather than the full six-instrument panel a large utility unit would run. Teams sizing SWAS specifications for smaller boilers can
Book a Demo to review typical configurations by boiler class.
What is the difference between specific conductivity and cation conductivity?
Specific conductivity measures the total conductivity of a sample — every dissolved ion contributes, including ammonia and amines added as pH control agents. Cation conductivity measures the conductivity of the same sample after it has passed through a hydrogen-form cation exchange column that removes cations. The difference matters because in an ammonia or amine-treated cycle, specific conductivity is dominated by the treatment chemicals themselves and gives poor visibility to contamination. Cation conductivity removes the treatment-chemical contribution and shows only the anionic contamination — chloride, sulfate, carbonate as their strong acids — which is exactly the contamination that matters for turbine protection. This is why cation conductivity emerged as the standard turbine-inlet steam purity indicator despite being a more complex measurement than plain specific conductivity.
How often should sodium analyzer calibration and cation column regeneration be scheduled?
Manufacturer specifications for continuous sodium analyzers typically call for calibration verification at monthly intervals with full calibration quarterly, though the specific schedule depends on the analyzer model and the operating environment. Cation exchange columns for cation conductivity are typically regenerated or replaced on a schedule tied to sample throughput — commonly every six to twelve months depending on ammonia loading and other cation contributions to column exhaustion. What matters more than the specific interval is having the schedule documented, executed on time, and the calibration records retained as part of the plant chemistry program. Support engineers at
iFactory Support can advise on maintenance scheduling patterns for common SWAS panel configurations.
What happens if a plant runs above the recommended limits for an extended period?
Damage accumulates progressively rather than instantaneously — a unit running above sodium and cation conductivity limits for weeks accumulates blade deposits and initiates pitting or stress-corrosion cracking that may not become mechanically evident for many operating hours. The economic consequences show up first as declining turbine efficiency (silica deposits altering blade aerodynamics), then as increased forced-outage risk from developing corrosion, and eventually as turbine section replacements measured in millions of dollars and weeks of outage. The IAPWS and EPRI guidelines exist because the industry has documented these damage curves across many decades of operating experience, and the tight limits reflect the reality that turbine components have very low tolerance for contaminants that concentrate on their surfaces during operation. Extended excursions are always more expensive than the corrective action would have been at the time.
SWAS · SILICA + SODIUM + CATION CONDUCTIVITY · TURBINE PROTECTION
Turn Your SWAS Panel Into an Automated Turbine Chemistry Protection System
iFactory ingests continuous SWAS data streams, applies IAPWS and EPRI alarm ladders, cross-correlates the three parameters for real-versus-artifact diagnosis, and delivers actionable alerts to chemistry and operations staff — with audit-ready records for every excursion and correction. Book a walkthrough tailored to your specific SWAS configuration.