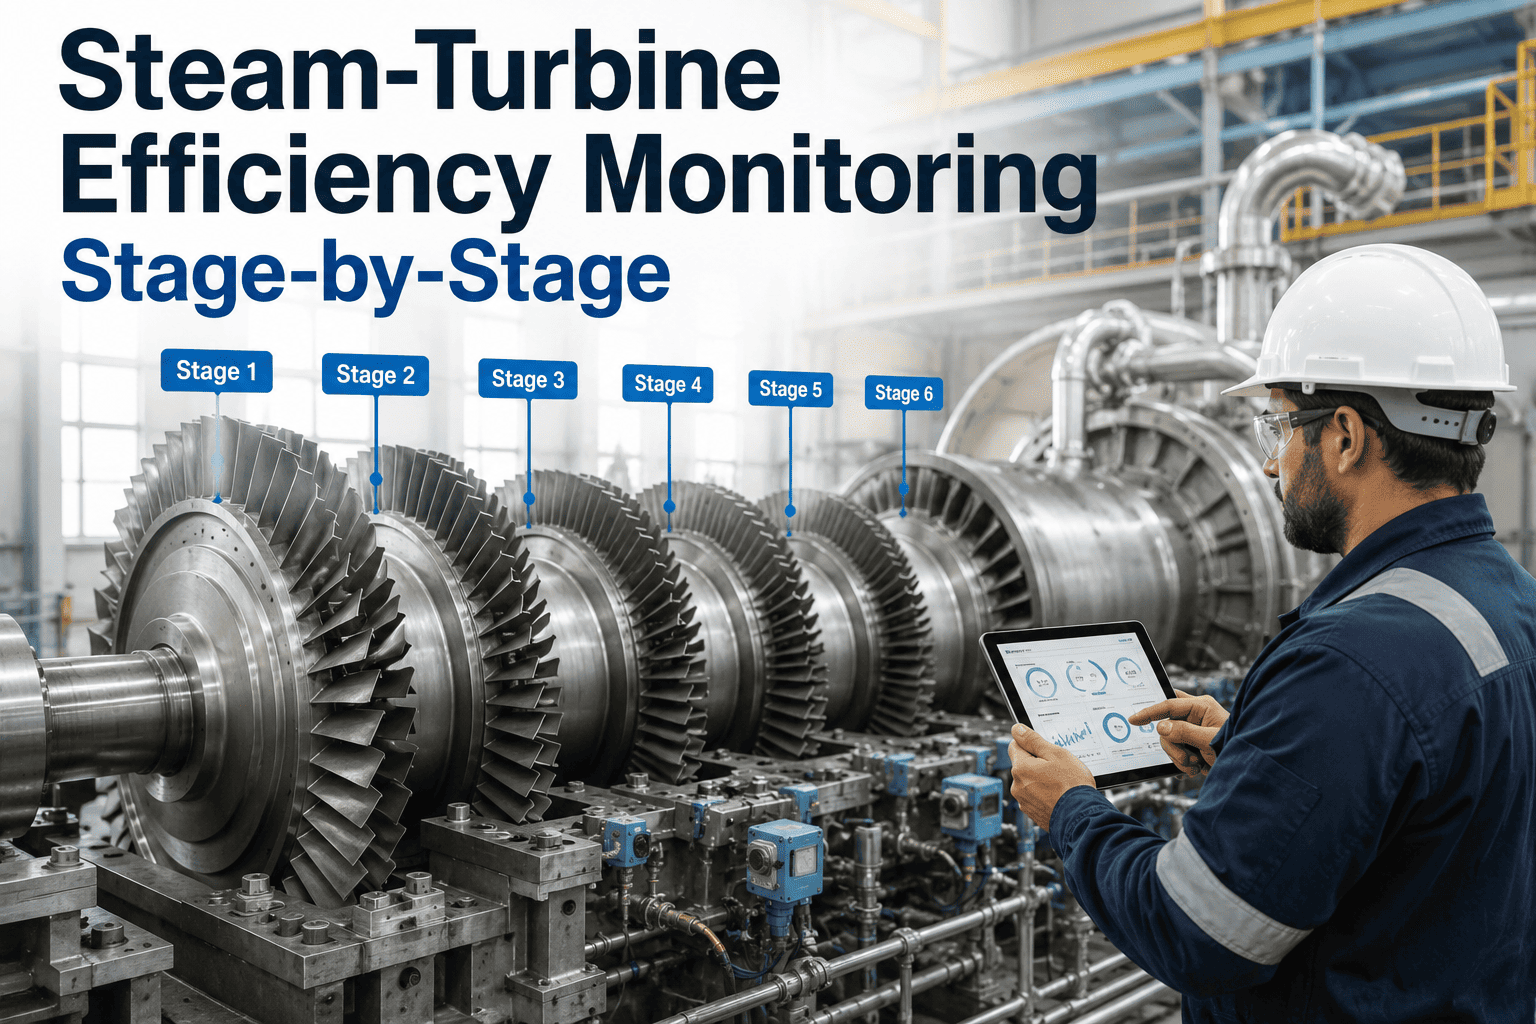
A single "turbine efficiency" number on a monthly performance report hides more than it reveals. A steam turbine's HP, IP, and LP sections each degrade for different reasons and at different rates, so a unit running at 96 percent HP section efficiency can still be bleeding several points of overall output from LP blade erosion or a leaking crossover seal that a blended average never flags. Averaging the sections together buries exactly the diagnosis a reliability team needs. See how iFactory tracks HP, IP, and LP efficiency independently and in real time with a Book a Demo.
One Efficiency Number Hides Three Different Problems
HP, IP, and LP sections fail for different reasons: erosion, leakage, and fouling each hit a different part of the steam path. iFactory trends each section's enthalpy drop efficiency separately so a drop in one section shows up immediately instead of being averaged away by the other two.
A Blended Average Can Sit Steady While A Section Quietly Fails
Overall turbine efficiency is a weighted average across three sections that respond to completely different degradation mechanisms. The HP section runs the hottest, driest steam and is most sensitive to nozzle and blade deposits. The LP section runs the wettest, lowest-pressure steam and is most sensitive to erosion and exhaust hood losses. When one section's efficiency drops by four or five points while the other two hold steady, the blended number can shift by less than a single point, which is easily lost in normal reporting noise even though a genuine mechanical problem is actively developing.
The Enthalpy Drop Test: How Section Efficiency Is Actually Calculated
Section efficiency is determined by comparing the actual enthalpy drop across a section to the ideal isentropic enthalpy drop for the same inlet and outlet conditions. The ratio of the two is the section's internal efficiency, and running this calculation independently for HP, IP, and LP is what separates a genuinely diagnostic monitoring program from a single blended heat rate figure.
Record Inlet Conditions
Capture pressure and temperature at the section inlet to establish the starting enthalpy state for the expansion being evaluated.
Record Outlet Conditions
Capture pressure and temperature, or pressure and quality for wet sections, at the section outlet to establish the actual end state.
Calculate Ideal Enthalpy Drop
Determine the isentropic outlet enthalpy at the same outlet pressure, representing the theoretical maximum energy extraction with no losses.
Compare Actual To Ideal
Divide the actual enthalpy drop by the ideal enthalpy drop to produce the section's internal efficiency, then trend that figure over time.
Stop Diagnosing Three Sections From One Number
iFactory calculates HP, IP, and LP section efficiency independently from live pressure and temperature data, so a degrading section shows up the week it starts, not the outage it gets discovered.
Four Points Where Internal Leakage Quietly Steals Section Efficiency
Internal leakage does not show up as a visible fault, an alarm, or a trip. It shows up only as a gradual, section-specific efficiency decline that is easy to attribute to normal wear unless it is trended and compared against the specific location most likely to be responsible.
HP-IP Crossover Seals
Worn labyrinth seals at the crossover allow high-pressure steam to bypass the IP section's early stages, reducing the IP section's effective enthalpy drop without affecting HP section readings at all.
Gland Seal Wear
Shaft end gland seals that wear beyond design clearance leak steam directly to atmosphere or the condenser, showing up as a mass balance discrepancy before it shows up as a clear efficiency number.
Extraction Valve Seats
A leaking extraction non-return valve allows steam to flow backward into a lower-pressure section during load changes, distorting that section's apparent efficiency during transient operation specifically.
Diaphragm And Interstage Seals
Interstage diaphragm seal wear lets steam bypass individual stages within a section, producing a slow efficiency decline that tends to accelerate once clearances open beyond a critical threshold.
Exhaust Moisture And Blade Erosion Concentrate In The LP Section
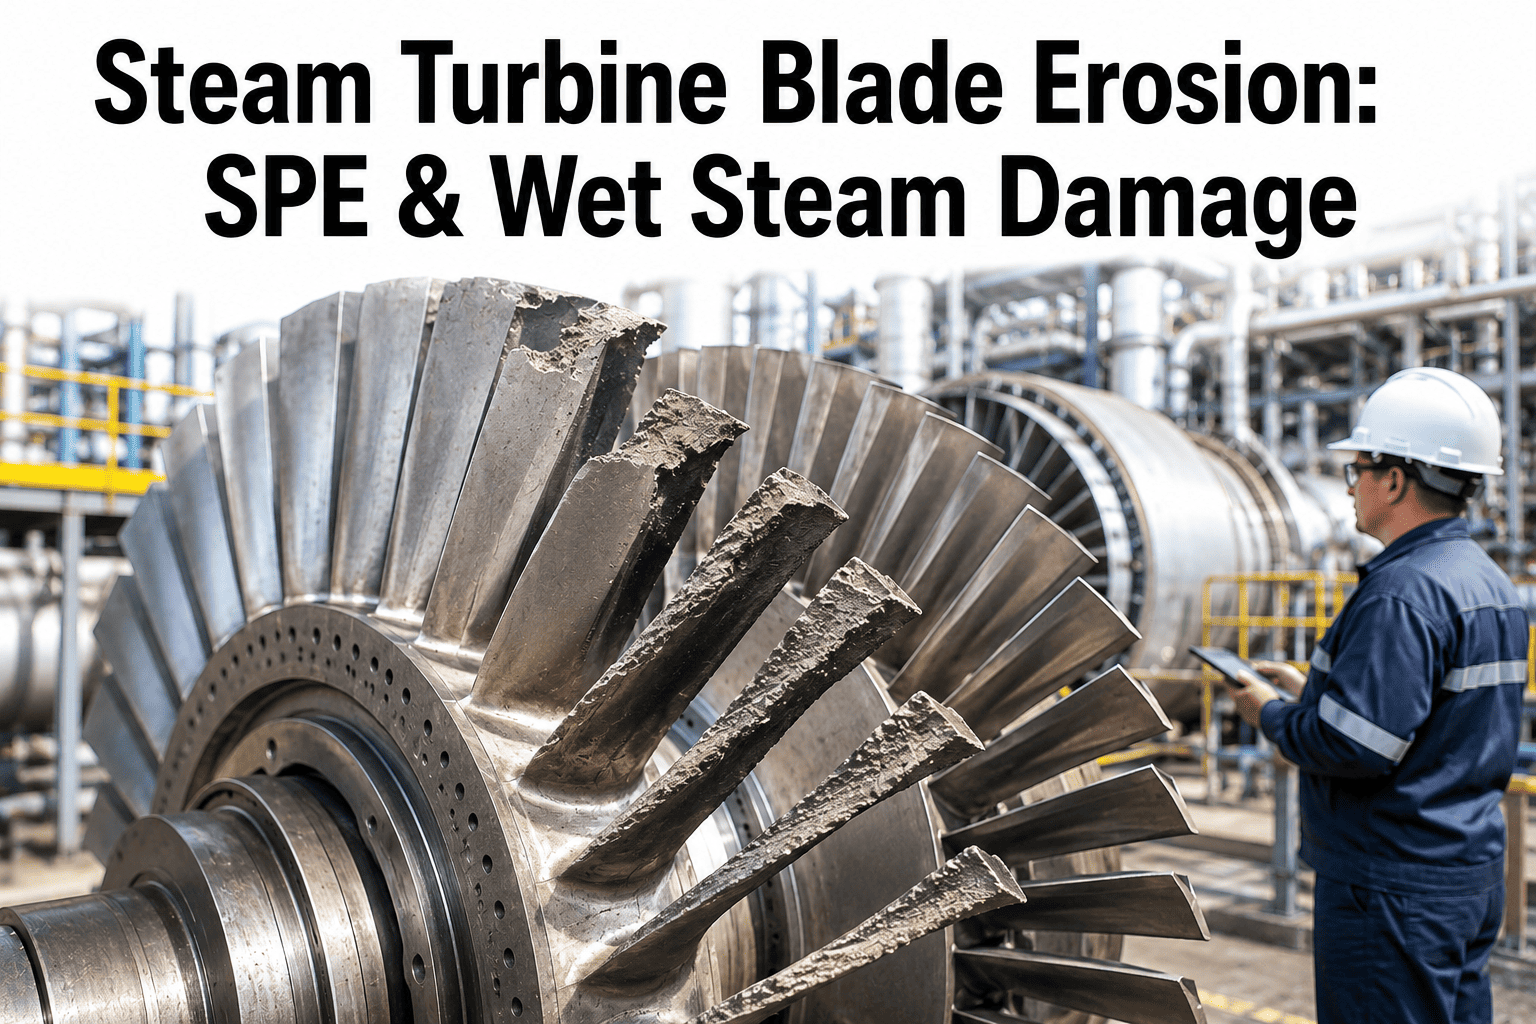
As steam expands through the LP section, it crosses the saturation line and begins condensing into fine water droplets. Those droplets, moving at high velocity relative to the last-stage blades, cause water droplet erosion concentrated specifically on the leading edges of the final rows, which is why LP efficiency typically degrades faster and more visibly than HP or IP efficiency over the same operating period.
| Stage Location | Typical Moisture Content | Erosion Risk |
|---|---|---|
| HP Section (throughout) | Dry to superheated | Low |
| IP Section (throughout) | Dry to slightly wet at exit | Low to Moderate |
| LP Section (mid stages) | 4–8% moisture | Moderate |
| LP Section (last stage) | 10–14% moisture | High |
Moisture content and erosion risk figures are typical ranges for condensing steam turbines and vary with unit design, exhaust pressure, and the presence of moisture separation features between stages.
Condenser Backpressure Sets The Ceiling On LP Section Efficiency
The LP section's efficiency calculation is only as reliable as the accuracy of the exhaust pressure measurement feeding it, and that exhaust pressure is set almost entirely by condenser backpressure rather than by anything happening inside the turbine itself. A rising backpressure trend, whether from tube fouling, air in-leakage, or reduced cooling water flow, changes the ideal enthalpy drop calculation and can make a perfectly healthy LP section appear to be degrading, or mask a genuinely degrading section behind a coincidentally improving backpressure.
How Often Each Diagnostic Should Actually Run
Section efficiency trending works best as a layered program rather than a single annual test, since the mechanisms driving each type of degradation move at different speeds.
Where Section-Level Monitoring Programs Go Wrong
Plants that attempt section-level efficiency tracking without addressing a few common gaps tend to end up with numbers that are technically calculated but not actually trustworthy enough to drive a decision.
Ignoring Instrument Calibration Drift
Enthalpy drop calculations are highly sensitive to small pressure and temperature errors, and an uncalibrated transmitter can produce an apparent efficiency trend that is really just instrument drift.
Not Correcting For Backpressure
Comparing LP section efficiency across different backpressure conditions without correction produces a trend that reflects condenser performance as much as turbine condition.
Treating Extraction Flows As Constant
Ignoring changing extraction flows to feedwater heaters when calculating IP and LP section mass flow introduces error that compounds over time into a misleading efficiency figure.
Reviewing Trends Only At Outage Planning
Waiting for the annual outage planning cycle to review section efficiency trends means a fast-developing leak can go unaddressed for months longer than necessary.
What Plants Typically See After Adding Section-Level Tracking
Splitting a blended efficiency number into three independently tracked sections tends to produce the same categories of improvement across plants, though the specific magnitude depends on how much internal leakage and erosion had already accumulated before monitoring began.
Frequently Asked Questions
Q: Why can't overall heat rate alone tell me which turbine section needs attention?
Overall heat rate is a single blended figure influenced by boiler performance, all three turbine sections, and condenser performance simultaneously, so a decline in any one of those areas can be offset by stability or improvement in another, leaving the blended number essentially flat. A degrading LP section losing several points of efficiency can be nearly invisible in an overall heat rate trend if HP and IP sections are performing normally, which is exactly why section-level enthalpy drop tracking exists as a separate diagnostic layer. Reach out through Support Contact to discuss what data your current instrumentation can already support.
Q: How much instrumentation is actually required to calculate section-level efficiency?
At minimum, pressure and temperature measurement at each section boundary, meaning HP inlet, HP exhaust and IP inlet, IP exhaust and LP inlet, and LP exhaust, along with accurate main steam flow. Many plants already have most of these points instrumented for control purposes, and the additional work is typically in verifying calibration accuracy and building the enthalpy calculation itself rather than installing entirely new instrumentation. A Book a Demo session can review what your existing point list already supports.
Q: Does condenser backpressure need to be corrected for before comparing LP efficiency over time?
Yes, and skipping this step is one of the most common sources of misleading LP section trends. Because condenser backpressure sets the LP section's exhaust pressure and therefore its ideal enthalpy drop, comparing raw LP efficiency across different backpressure conditions conflates condenser performance with turbine internal condition. Correcting the comparison to a reference backpressure, or trending LP efficiency alongside a separate backpressure trend, is necessary to isolate genuine turbine degradation from a condenser-driven shift.
Q: Can section-level monitoring detect internal leakage before a mass balance test would?
In most cases, yes. A developing leak at a crossover seal or extraction valve typically produces a gradual efficiency decline in the affected section before it becomes large enough to show up clearly in a periodic mass balance test, which is usually only run quarterly or during outage planning. Continuous section efficiency trending catches the earlier, smaller signal, and a subsequent mass balance check can then be used to confirm and quantify the leak once the trend flags a specific section as the likely source.
Q: Is blade erosion in the LP section preventable, or only manageable through monitoring?
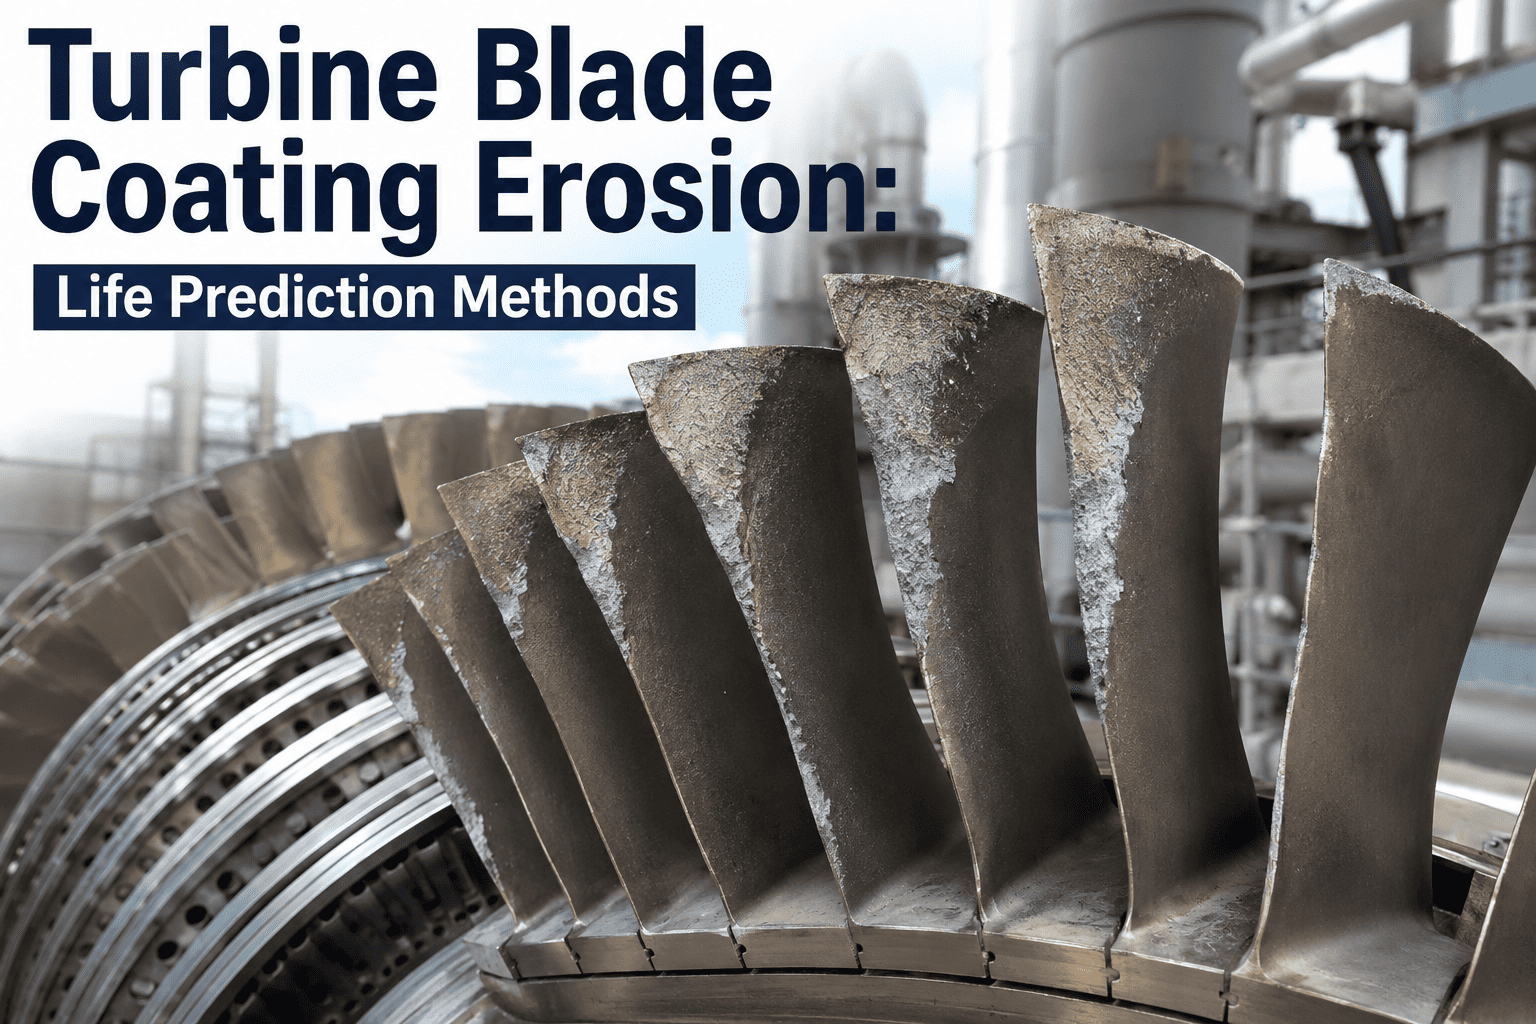
Erosion cannot be fully eliminated in a condensing LP section because some moisture formation in the final stages is inherent to the thermodynamic expansion process, but its rate and impact can be managed. Moisture separation features, erosion-resistant blade coatings, and operating strategies that avoid unnecessary time at high moisture conditions all reduce the rate of erosion. Monitoring does not prevent erosion directly, but it does convert an unknown, gradually worsening risk into a trended, quantifiable one that can be scheduled around rather than discovered during an outage.
See Which Section Is Actually Costing You Efficiency
iFactory turns HP, IP, and LP enthalpy drop data into a live, section-specific efficiency trend so degradation gets caught weeks earlier and diagnosed correctly the first time.