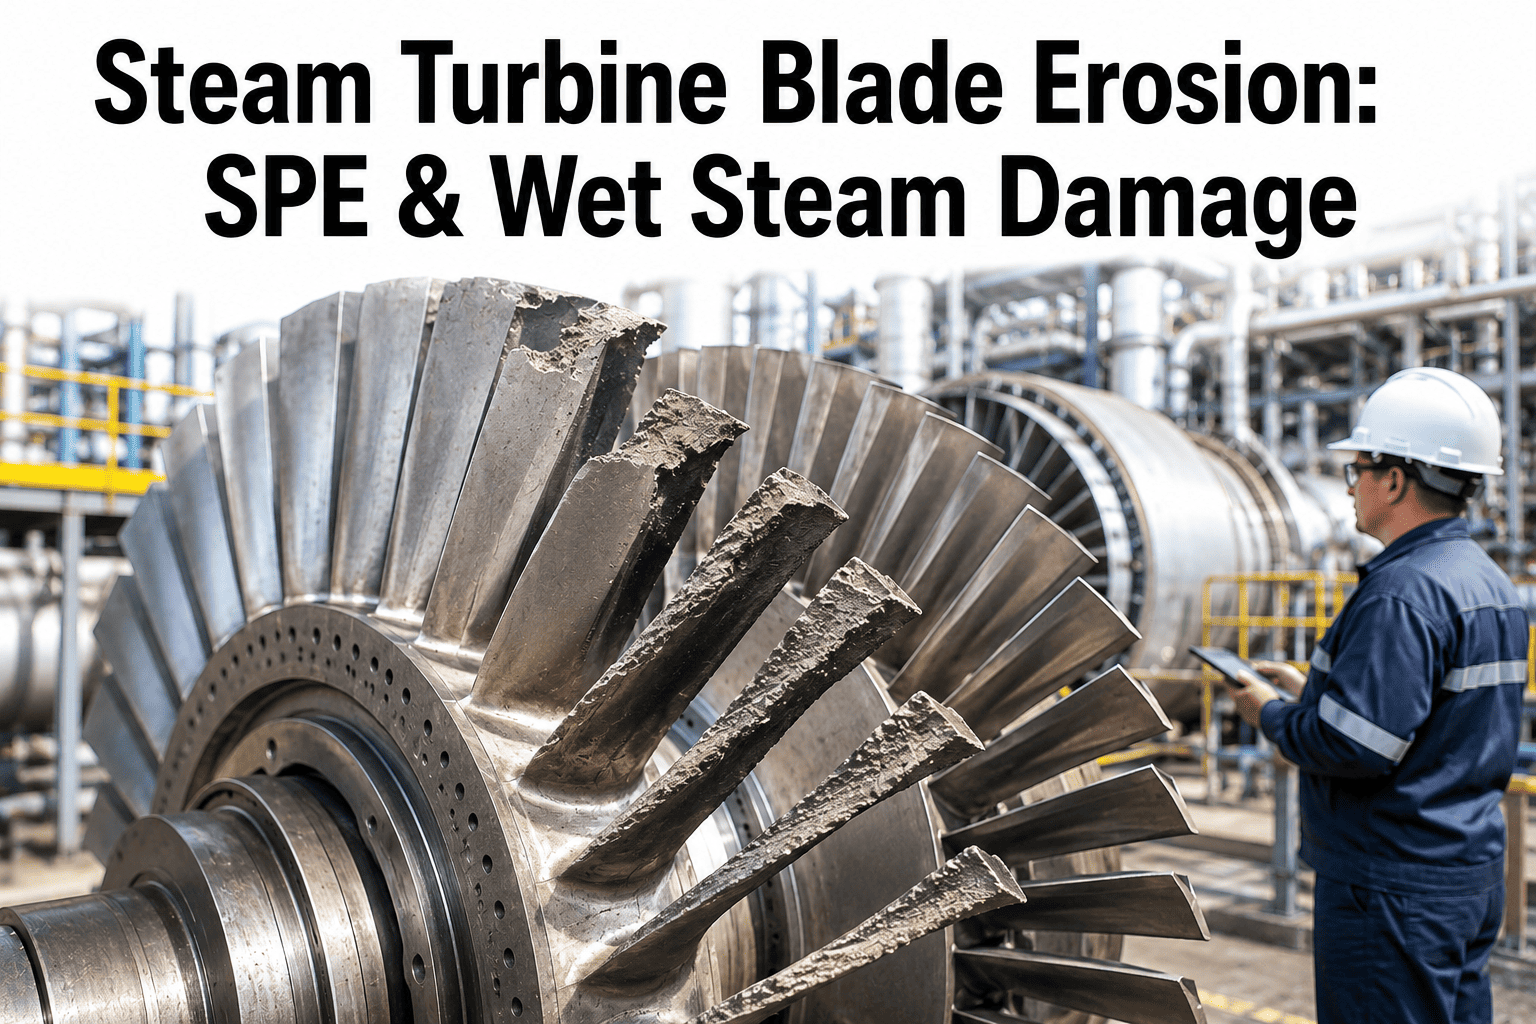
A blade that looks fine on a borescope inspection in March can be losing measurable output by the following outage, and by the time a technician spots the tell-tale roughened leading edge or the comb-like grooves near the tip, the turbine has usually been shedding efficiency for months. Two very different mechanisms cause almost all of this damage: solid particle erosion, driven by oxide scale flaking off boiler tubing and blasting through the high-pressure stages, and wet steam erosion, driven by moisture droplets striking low-pressure blades at near-sonic speed. They look different, they concentrate in different parts of the turbine, and they call for different fixes, which is exactly why so many plants misdiagnose one for the other. If you want a second opinion on a set of borescope images or a recent efficiency test, our engineers offer a free erosion pattern review to help you tell the two apart.
Solid Particle Erosion vs. Wet Steam Erosion, Side by Side
Both mechanisms show up as material loss on the blading, but the physics behind them, and the part of the turbine they attack, are almost opposite. Solid particle erosion is fundamentally a boiler and steam-purity problem that happens to show up on the turbine. Wet steam erosion is fundamentally a thermodynamic problem, the unavoidable result of steam crossing the saturation line as it expands and gives up energy. Separating the two starts with knowing where each one lives on the steam path.
Reading the Damage: A Field Diagnostic Table
Most experienced turbine engineers can narrow down the erosion type from photographs alone, because the visual signature is genuinely distinct once you know what to look for. The table below is the same checklist our field team uses when reviewing borescope footage before an outage.
| Observation | Likely Mechanism | Typical Location | Recommended Next Step |
|---|---|---|---|
| Rounded, sandblasted leading edges | Solid particle erosion | HP control stage, rows 1-3 | Boiler oxide scale survey |
| Comb-like grooves near blade tip | Wet steam erosion | Last two LP rows | Moisture separator inspection |
| Pitting on pressure side only | Solid particle erosion | Nozzle-facing HP rows | Startup ramp rate review |
| Thinned, undercut tip section | Advanced wet steam erosion | Final LP row | Shield or stellite check |
| Uniform dulling, no grooving | Fine particulate wear | Multiple HP rows | Steam purity sampling |
| Localized deep gouging | Foreign object damage | Any stage | Immediate visual inspection |
What's Actually Driving Solid Particle Erosion
Protecting HP Blading Against Solid Particle Erosion
Managing Moisture to Slow LP Erosion
Wet steam erosion can never be eliminated entirely, because it's a byproduct of the expansion process itself, but the rate at which it damages blading is very much manageable. The tools below are the ones plants reach for most often, roughly in order of how commonly they appear in an LP retrofit scope.
When to Replace Instead of Repair
Why the Two Mechanisms Get Confused So Often
Plant staff reviewing borescope footage for the first time often default to calling any surface roughening "erosion" without separating which type they're looking at, and it's an understandable mistake given how similar the two can look in a poorly lit image or a low-resolution photo taken quickly during a limited outage window. The distinction matters enormously downstream, though, because the corrective actions point in almost opposite directions. A plant that responds to solid particle erosion by chasing moisture removal fixes will spend money without addressing the actual source, and a plant that responds to wet steam erosion by tightening startup ramp rates will see no improvement at all on the LP rows where the real damage is occurring. Getting the diagnosis right the first time avoids an entire maintenance cycle of misallocated budget, and it's worth treating that initial classification step as seriously as the repair scope itself.
There's also a timing dimension that often gets missed. Solid particle erosion damage tends to appear in bursts correlated with startup events, meaning a unit that has just come off a stretch of frequent cycling can show a sudden jump in HP row pitting between two consecutive outages, even if the interval between those outages was unusually short. Wet steam erosion, by contrast, is closer to a continuous process tied to cumulative operating hours rather than discrete events, so its progression tends to look more linear when tracked outage over outage. Recognizing which growth pattern a unit is showing, sudden versus gradual, is itself a useful clue when the visual evidence alone is ambiguous.
Mapping Erosion Risk Across the Full Steam Path
It helps to think of the steam path as having three distinct erosion risk zones rather than treating the turbine as a single uniform system. The HP control stage and the rows immediately downstream of it carry the highest solid particle erosion risk, because that's where particles are still moving fast and haven't yet lost momentum to multiple stage passes. Moving further down the HP and into the IP section, particle-related risk drops off sharply since most fragments large enough to cause damage have already been filtered out or have lost enough velocity to do further harm, though fine particulate can still contribute to a slower, more uniform wear pattern across these middle stages. The LP section is where the story flips entirely: particle erosion risk is essentially zero here because the steam has been thoroughly cleaned of solids by the time it arrives, but wet steam erosion risk climbs steadily toward the final rows as the wetness fraction increases with each stage of expansion. A comprehensive erosion inspection plan should weight time and attention according to this risk map rather than treating every stage as equally likely to show damage, focusing borescope time on the first HP rows and the final LP rows where the two mechanisms actually concentrate.
This risk mapping also has implications for spare parts planning. Because the two erosion mechanisms are so geographically separated, a plant can reasonably stock erosion-resistant coated blades for the HP control stage and shielded blades for the final LP rows as two entirely separate inventory lines, sized according to each mechanism's independent progression rate rather than lumping all turbine blading into a single generic spares category. Plants that have made this separation report shorter outage durations, since the correct replacement blades are already staged rather than being sourced reactively once an inspection reveals unexpected wear.
Where AI-Based Monitoring Fits In
Erosion is a slow, cumulative process, which makes it a good candidate for trend-based monitoring rather than relying entirely on periodic borescope inspections. Efficiency data from stage pressure ratios, combined with periodic vibration signature changes as blade mass is lost unevenly, can flag a developing erosion problem well before it reaches a chord-loss threshold that forces an unplanned outage. Continuous stage-efficiency tracking against a clean-blade baseline lets a plant see the gradual output decline that erosion causes long before it becomes visible on a borescope, and correlating that decline against startup counts and steam chemistry logs helps confirm which mechanism is responsible before the outage scope is even written.
Building a Fleet-Wide Erosion Baseline
A single unit's erosion history tells you a lot, but the real value shows up once a plant starts comparing erosion progression across sister units of similar design and vintage. Two nominally identical turbines can show meaningfully different erosion rates over the same number of operating hours, and the gap usually traces back to differences in startup discipline, boiler chemistry control, or a chance difference in oxide scale history from before the units were commissioned. Documenting chord loss, pitting depth, and shield condition at every outage, then comparing that data across the fleet rather than looking at each unit in isolation, turns erosion management from a reactive inspection task into a proactive planning exercise. It also gives maintenance planners a much stronger basis for negotiating outage duration and parts lead time with OEM service providers, since a documented, unit-specific erosion trend carries more weight in that conversation than a generic industry average ever will. Plants that maintain this kind of baseline consistently find that outage planning meetings shift from arguing over whether an inspection is warranted to simply confirming the scope that the data already points to.
Fleet-wide baselines also make it far easier to justify capital spending on erosion-resistant upgrades. A coating or shield retrofit that looks like a marginal expense when evaluated against a single unit's efficiency loss can look very different once the avoided cost is calculated across every sister unit expected to follow the same degradation curve. That reframing, from a single-unit maintenance line item to a fleet-level efficiency investment, is often what moves an erosion mitigation project from the maintenance backlog onto the actual capital plan.