Two turbines that look identical on paper, same OEM, same rated output, same commissioning year, can be running three or four percentage points apart in actual efficiency, and neither the control room trends nor the annual budget review will tell you why. ASME PTC 6 exists precisely for this gap: it's the industry-standard test code for measuring steam turbine efficiency with enough rigor that the result holds up in a warranty dispute, an OEM performance guarantee, or a before-and-after overhaul comparison. Running it correctly means controlling for a long list of variables that casual heat-rate calculations from DCS trends simply ignore, which is also why so many plants get inconsistent results between test attempts. For help setting up an ASME PTC 6 compliant test on your unit, our team offers a free test-planning consultation.
The Testing Process, Start to Finish
A PTC 6 test isn't a single measurement, it's a sequence of preparation, execution, and calculation steps that all have to be done in order for the final number to be defensible. Skipping or shortcutting any one of these stages is the most common reason two tests on the same unit produce results that don't reconcile. The full process typically spans several weeks from initial planning to a finalized, reviewed report, even though the actual on-unit data collection window itself may only last a few hours once the load has stabilized.
The Enthalpy Drop Method, Explained Simply
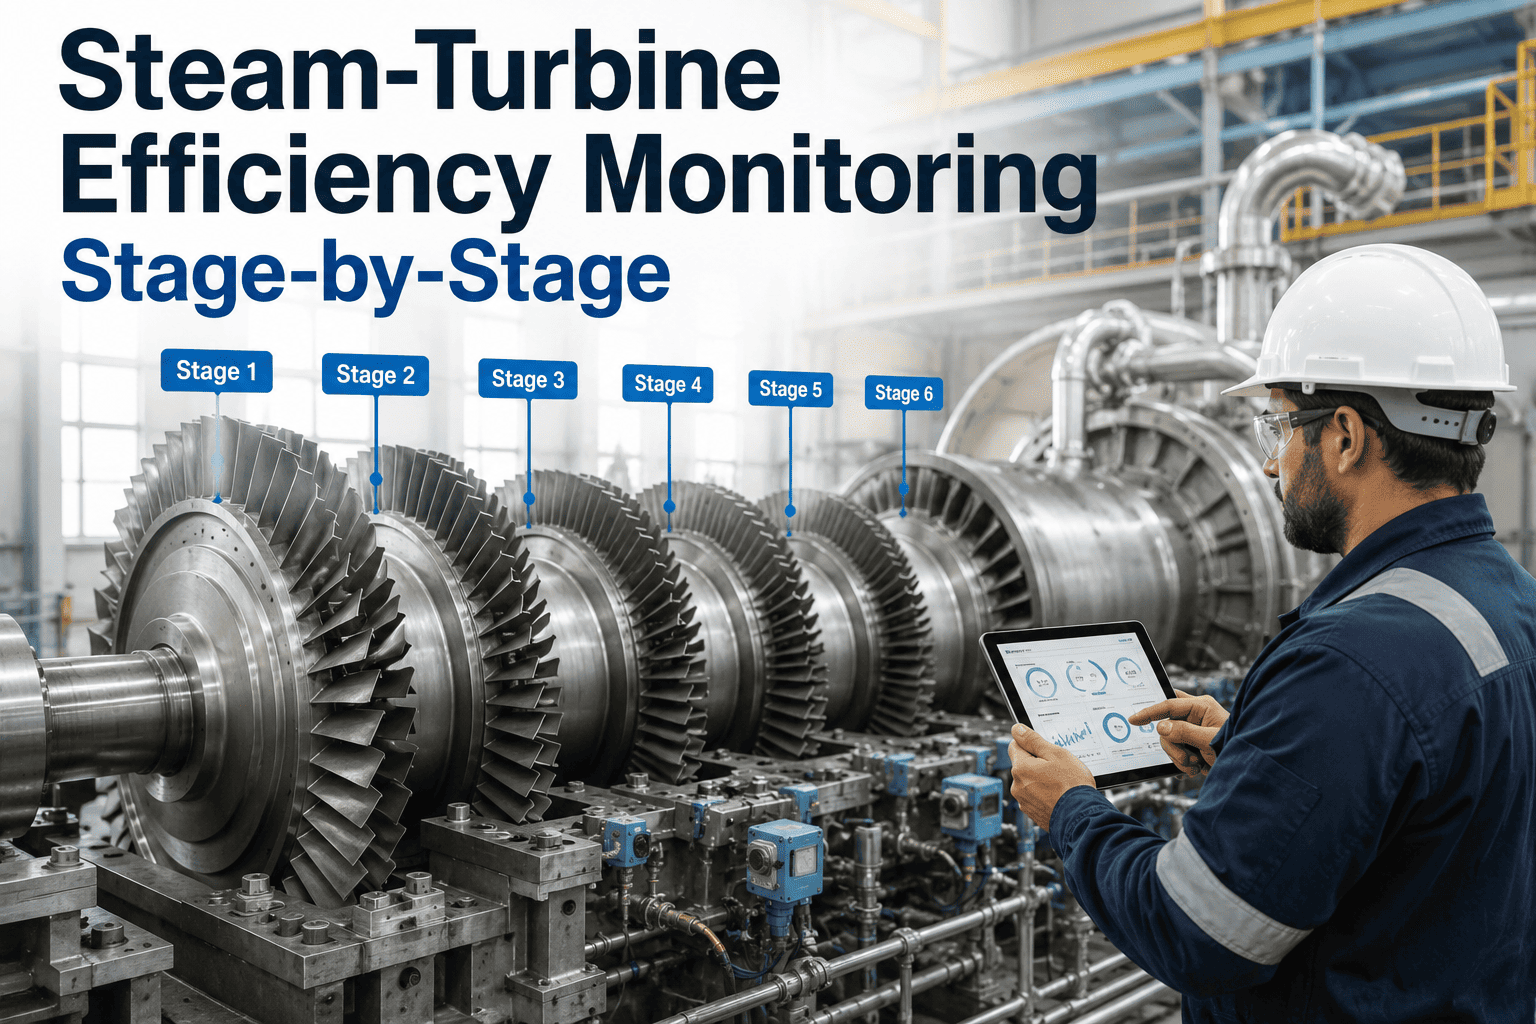
This is why the enthalpy drop method is so much more diagnostic than a simple heat rate calculation from fuel input and net output. A heat rate number tells you the whole plant lost efficiency somewhere, but it can't tell you whether that loss happened in the boiler, the turbine, or the condenser. Enthalpy drop testing, done stage group by stage group, isolates exactly which section of the turbine is underperforming, which is what actually lets a plant scope a targeted overhaul instead of an expensive blanket inspection of everything.
Class A vs. Class B Testing
Deciding which test class to pursue is itself a planning decision with real cost implications, and it's worth making deliberately rather than defaulting to whatever instrumentation happens to already be installed. The table below summarizes the practical differences a plant should weigh before committing to a testing approach.
| Factor | Class A Test | Class B Test |
|---|---|---|
| Instrumentation requirement | Precision test-grade transmitters | Standard plant instrumentation |
| Typical uncertainty | Under 0.5% on efficiency | 1-2% on efficiency |
| Common use case | OEM guarantee verification | Internal degradation tracking |
| Setup cost and time | Higher, dedicated test crew | Lower, uses existing DCS tags |
| Contractual weight | Suitable for dispute resolution | Not typically contract-binding |
Instruments That Make or Break the Result
Not every instrument on the turbine carries equal weight in the final efficiency calculation. A handful of measurement points disproportionately influence the result, and a pre-test audit that prioritizes checking these over lower-impact instruments makes the most efficient use of limited test preparation time.
Reading Degradation Between Two Test Dates
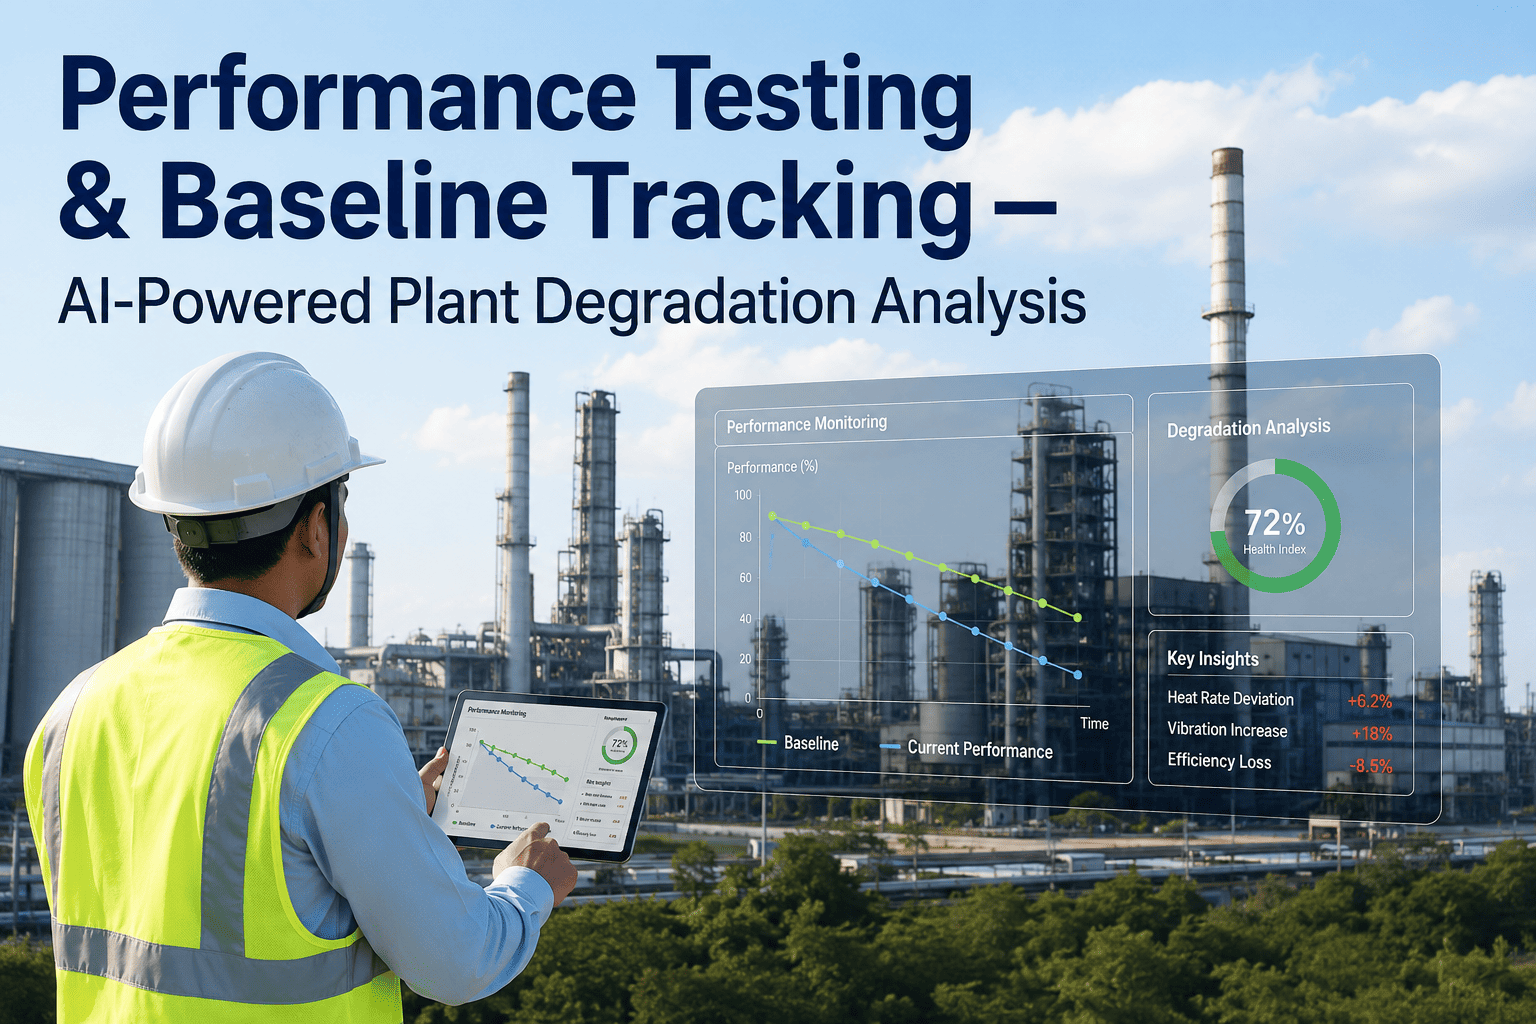
The real value of PTC 6 testing rarely comes from a single test in isolation, it comes from comparing two tests separated by a known interval, ideally bracketing a specific event like an overhaul, a chemical clean, or a full operating year. The comparison isolates how much efficiency was actually lost or recovered, correcting for any difference in ambient or load conditions between the two dates so the comparison reflects real turbine condition rather than test-day variability. A well-documented baseline test performed shortly after commissioning or immediately following a major overhaul becomes the reference point every future test gets measured against, and plants that skip this baseline step often find themselves unable to answer a simple question years later: how much has this turbine actually degraded since it was new. Establishing that reference point early is one of the highest-value, lowest-cost decisions a plant can make in its long-term performance monitoring program, and it costs far less to do proactively than to attempt reconstructing retroactively from incomplete historical records once the question finally comes up.
It's also worth noting that degradation doesn't progress at a constant rate across a turbine's operating life. The steepest efficiency losses often occur in the first year or two after an overhaul, as newly installed seals and clearances settle in under real operating conditions, followed by a longer, flatter period of slow gradual decline, and then potentially an accelerating decline as the unit approaches its next major service interval. Recognizing which phase of this curve a unit is currently in helps set realistic expectations for how much a given test-to-test comparison should actually show, and prevents a plant from either overreacting to a normal settling-in loss or underreacting to an accelerating decline that genuinely warrants earlier intervention.
Continuous Monitoring as a Complement to Periodic Testing
A full PTC 6 test is resource-intensive by design, requiring a stabilized load, dedicated instrumentation, and a trained test crew, which is exactly why most plants only run one once a year or around major maintenance events rather than continuously. That leaves a real gap: efficiency can start drifting the week after a clean test and nobody notices until the next scheduled test catches up to it months later. Continuous efficiency trending, built from the same DCS tags used for a Class B test but tracked automatically day over day, fills that gap by flagging a developing efficiency decline well before the next scheduled formal test, giving operations a chance to investigate the cause, whether it's fouling, a seal issue, or an instrument drift, while it's still a small problem. The two approaches complement each other well: continuous trending tells you something changed and roughly when, while a periodic Class A test tells you exactly how much and gives you a number precise enough to act on financially.
There's a practical scheduling benefit here too. Rather than running a full Class A test on a fixed annual calendar regardless of actual turbine condition, a plant with reliable continuous trending can time its next formal test to coincide with an actual detected change, concentrating the expensive precision testing effort where it delivers the most diagnostic value. This event-triggered testing approach has become increasingly common at plants that have invested in continuous digital monitoring, since it makes better use of a limited testing budget than a purely calendar-based schedule ever could, and it also gives maintenance planners a stronger data-backed justification when requesting the outage window a formal Class A test typically requires. It also means that when a formal test is eventually run, the trending data leading up to it already provides useful context for interpreting the result, rather than the test standing entirely on its own.
Common Reasons Tests Get Rejected or Repeated
Even experienced test crews run into avoidable problems that force a retest, and most of them trace back to a handful of recurring issues rather than anything exotic. Knowing what typically goes wrong ahead of time is the cheapest form of insurance against losing an entire test day to a preventable mistake.
The common thread across all four of these failure modes is that they're essentially invisible in the raw data until someone goes looking for them specifically, which is exactly why an experienced third-party review of the test plan before execution, and a careful audit of the results afterward, consistently pays for itself. A rejected test doesn't just cost the retest itself, it typically costs a full outage or load-hold window that has to be rescheduled around an already tight generation dispatch calendar, which can push the actual retest out by weeks or months depending on grid conditions.
Documenting Results for OEM and Warranty Purposes
When a PTC 6 test result is going to be used to support an OEM performance guarantee claim or a warranty dispute, the documentation standard rises considerably above what's needed for internal tracking purposes. Every instrument's calibration certificate, the raw data log with timestamps, the correction methodology applied, and the final uncertainty analysis all need to be assembled into a package that can withstand scrutiny from the counterparty's own engineering team. This is different from simply reporting a final efficiency number; it's building an audit trail that shows exactly how that number was derived and why it should be trusted, and it should be assembled with the same rigor a plant would apply to any other formal contractual submission. Plants that have been through a contentious performance dispute know this documentation burden well, but plants heading into their first major overhaul under an OEM guarantee often underestimate it, only realizing partway through the process how much supporting material the test actually requires. Planning for this documentation requirement from the start of the test planning process, rather than trying to reconstruct it after the fact, is one of the most consistently underrated steps in the entire testing exercise.