A boiler tube rupture rarely announces itself in advance to a plant walking a normal shift, yet the tube wall behind that rupture has usually been thinning for months before it finally lets go. Fireside corrosion, waterside hydrogen damage, caustic gouging, creep, fatigue, and ash-related erosion each leave a distinct metallurgical signature that a failure analyst can identify after the fact during a post-mortem, but by then thousands of operating hours of accumulated damage have already propagated past the point where planned intervention was possible. Boiler tube failures account for roughly 60 percent of forced outages across coal and biomass power plants, making tube leaks the single largest source of unplanned generation loss in thermal power. Reliability engineers who track wall thickness trends, tube metal temperature, and creep life calculations continuously catch the same degradation weeks or months earlier than a quarterly ultrasonic testing round ever could, and seeing how that trending works on your own tube map takes about twenty minutes.
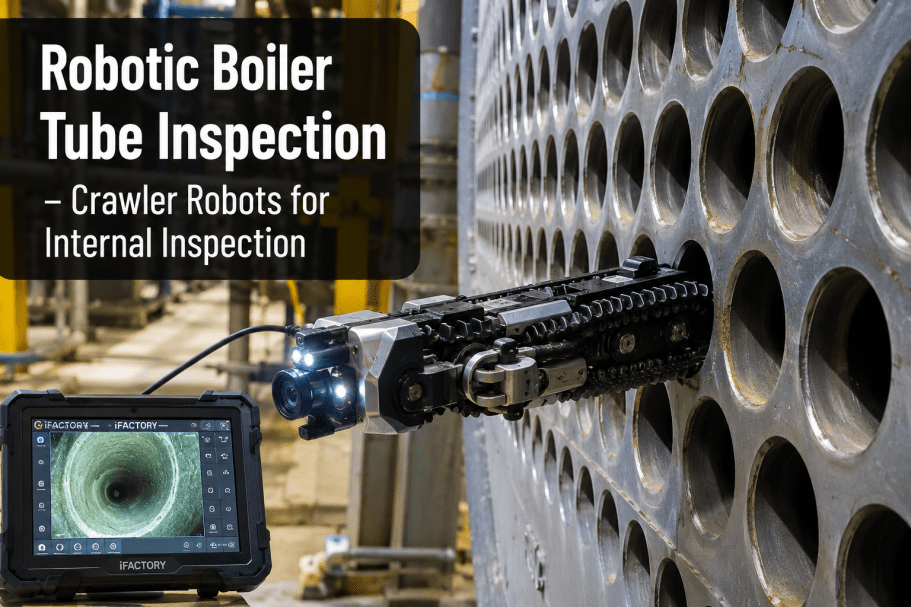
Catch Tube Wall Loss Before It Becomes a Rupture
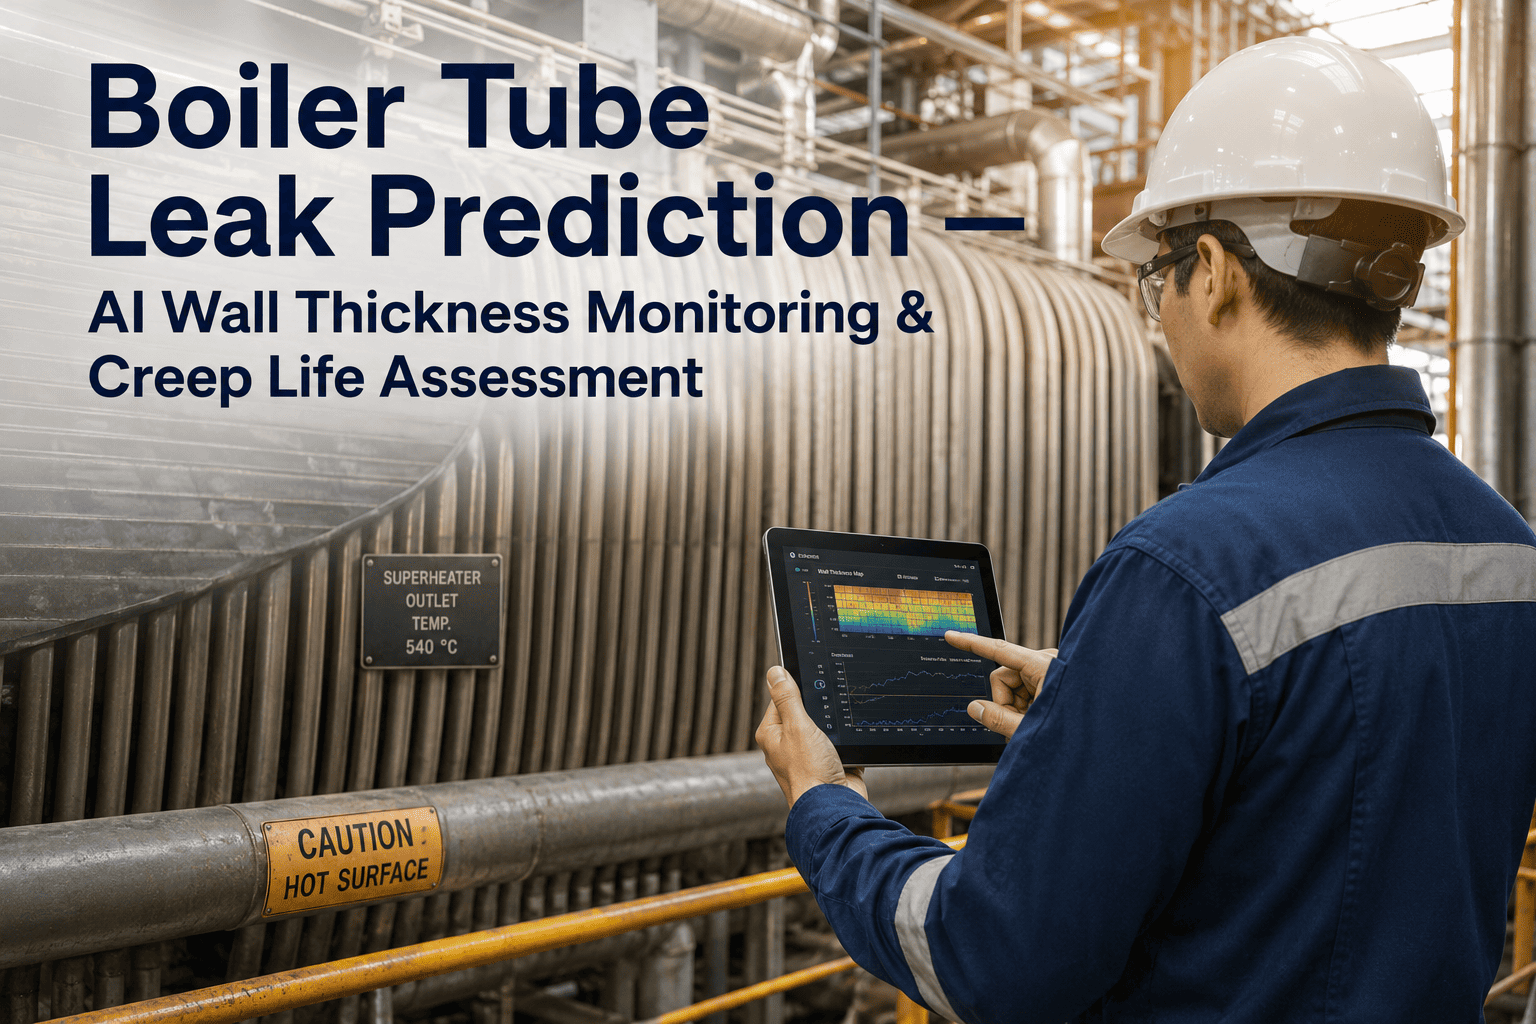
iFactory's Boiler AI module trends wall thickness readings, tube metal temperature, and creep life calculations against ASME minimum wall limits, flagging high-risk tubes before the next scheduled outage.
What One Undetected Tube Failure Actually Costs
Wall thickness had already been declining for weeks before one documented industrial boiler tube failure finally ruptured on a Saturday night shift. Nobody had been trending the inspection data. The bill that followed shows exactly why reliability teams are moving from periodic checks to continuous trending.
Six Damage Mechanisms, Six Distinct Warning Signatures
Each tube failure mechanism produces its own precursor pattern in wall thickness, temperature, and chemistry data weeks to months before rupture. A reliability engineer trending all six at once catches the specific mechanism, not just a generic alarm.
How a Tube Goes From Healthy to Ruptured
Regardless of which mechanism is driving it, tube degradation follows a recognizable sequence in the data long before the failure becomes visible on the boiler room floor.
Map Your Tube Wall Thickness Trends
Bring a recent UT inspection report and our team will show how the same thickness readings look once they are trended continuously against ASME minimum wall and creep life limits.
Inspection Techniques Feeding the Wall Thickness Model
Continuous trending is only as good as the inspection data feeding it. These are the methods most reliability programs already run, now trended automatically instead of reviewed in isolated reports.
| Method | Best For | Accuracy | Typical Cost per Point |
|---|---|---|---|
| Ultrasonic Testing | Corrosion, erosion thinning | Plus or minus 0.001 in | $50-$150 |
| Magnetic Particle | Surface fatigue and stress cracks | Fast, orientation-visible | $25-$75 |
| Phased Array UT | Hydrogen damage, creep, cross-section imaging | Higher sensitivity than standard UT | $200-$500 |
| Online Acoustic Leak Detection | Active leak location, crack propagation | No shutdown required | $5,000-$15,000 system |
Reading Creep Life the Way Reliability Engineers Actually Use It
Creep is different from corrosion-driven wall loss because it does not always show up as thinning. In ferritic steel tubes, high-temperature creep can instead produce diameter growth while wall thickness stays nearly flat, which is exactly why temperature trending has to run alongside thickness trending rather than instead of it.
Frequently Asked Questions
Does this replace our ASME-based UT inspection program?
No, it extends it. Your ultrasonic testing protocol, tube maps, and ASME minimum wall calculations remain exactly as they are today. What changes is how often that data gets reviewed and how it gets correlated with tube metal temperature and operating history between scheduled outages. Instead of reviewing thickness at each inspection window in isolation, the trend line runs continuously, so a tube approaching its 110-120 percent replacement threshold gets flagged before the next planned outage rather than discovered during it. The support team can walk through how your current tube map data feeds into that trend.
Can this distinguish between creep, corrosion, and erosion as the cause of wall loss?
Yes, largely because each mechanism produces a different combination of signals rather than just a single thinning trend. Creep shows up primarily through sustained tube metal temperature above the material's creep threshold, sometimes with diameter growth rather than wall loss. Corrosion and hydrogen damage show up through feedwater chemistry deviations alongside thinning. Erosion correlates with localized velocity changes and sootblower alignment issues. Trending all of these together, rather than wall thickness alone, is what lets the model point to a likely mechanism instead of a generic low-thickness alert.
How much warning does continuous trending actually provide versus a quarterly UT survey?
Wall thickness and thermal stress patterns typically show detectable anomalies weeks to months before a rupture, but a quarterly inspection only captures the tube's condition at the moment of the check. In one documented case, wall thickness had been declining for weeks and thermal stress anomalies were present for over two months before the tube failed, and none of it had been reviewed because the readings sat in separate reports. Continuous trending closes exactly that gap by comparing every new reading against the tube's own historical baseline as soon as it comes in.
What data do we need before this can start flagging high-risk tubes?
The starting point is whatever UT thickness history, tube maps, and feedwater chemistry logs your program already keeps. Most reliability teams already have this data, just spread across inspection reports, spreadsheets, and a chemistry logbook rather than trended together. Tube metal temperature from existing thermocouples, where available, adds a meaningful second signal for creep-driven tubes. A short review of your current data sources on a call is usually enough to scope what can be connected immediately versus what needs a sensor gap filled.
Which tubes are the highest priority to start trending first?
Superheater and reheater tubes are usually the highest priority because creep damage in these locations is cumulative and irreversible once it begins, and replacement lead times for these tube sets tend to run longest. Waterwall tubes with a history of caustic gouging or hydrogen damage, and any tube location with previous unplanned outages, are the next tier. Reliability teams generally start with the tubes that have the worst combination of consequence and lead time rather than trying to instrument the entire boiler at once, and the support team can help prioritize based on your outage history.
Stop Reviewing Tube Data After the Rupture
iFactory's Boiler AI module turns your existing UT reports, tube maps, and chemistry logs into a continuous early-warning trend built for reliability engineers, not just outage reports.