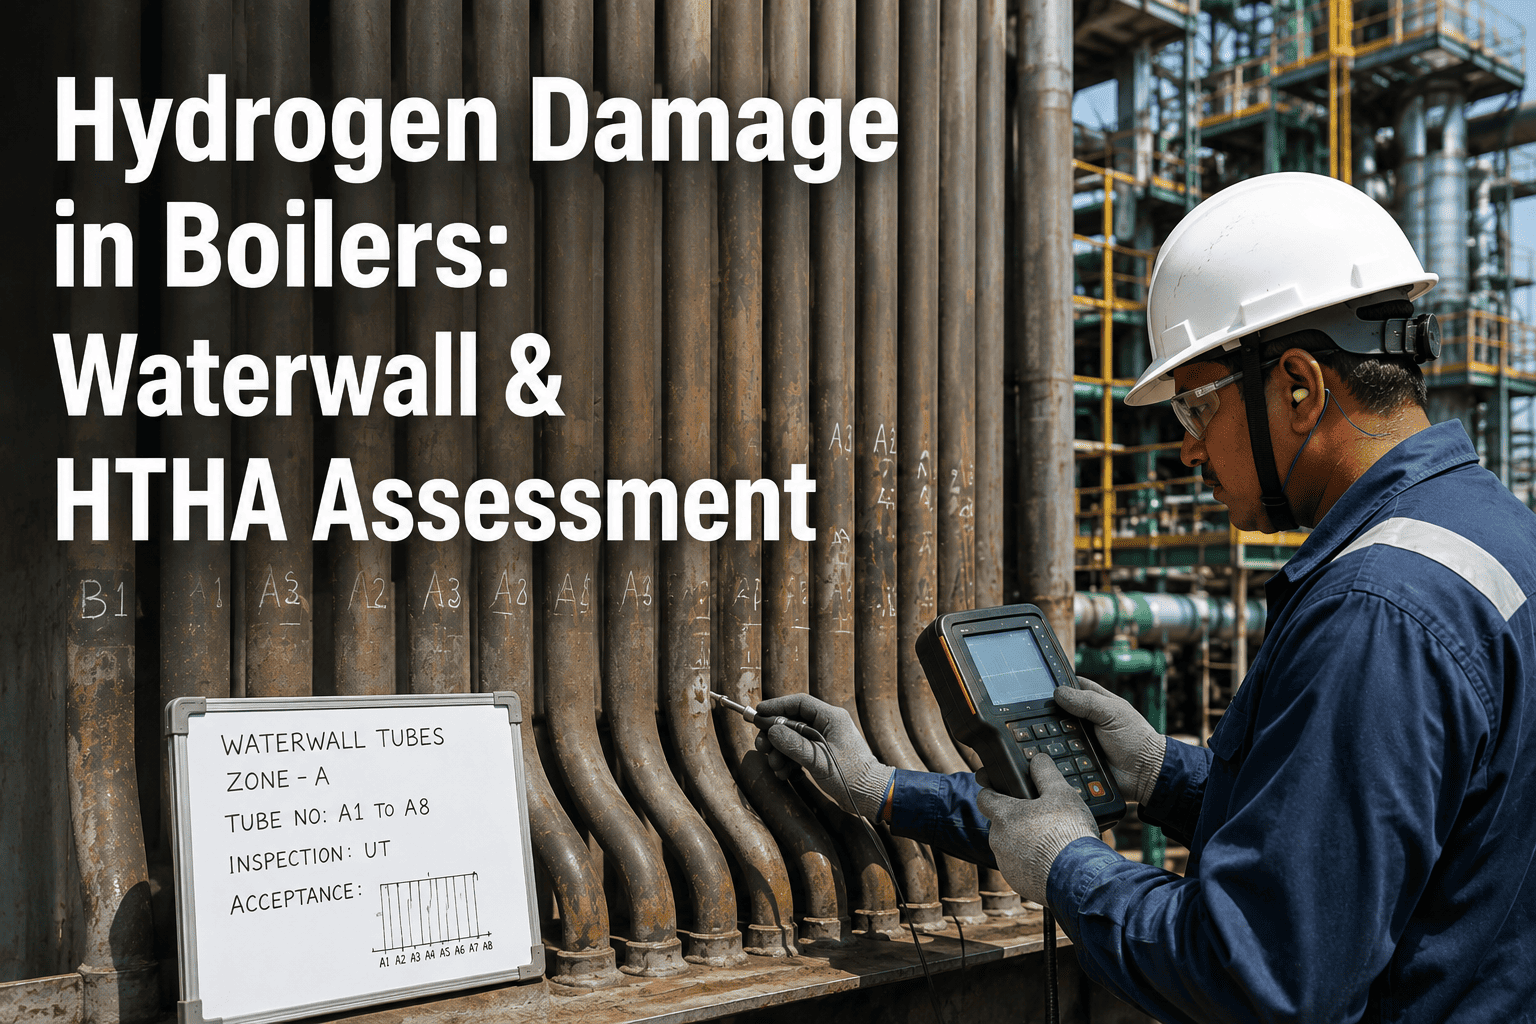
A superheater header that has been running at 540°C for 150,000 hours does not look different from the outside than one installed last year. The steel surface appears intact, insulation is in place, and pressure readings hold steady. But inside the grain structure, microscopic cavities have been nucleating along grain boundaries for years, slowly linking into chains that will one day become a through-wall crack. By the time that crack is detected, the component is already in a forced-outage scenario with no time for planned replacement. Understanding where a component sits on the creep damage curve separates a managed replacement from an emergency shutdown. Book a demo to see how iFactory tracks creep life consumption across your high-temperature fleet.
Creep Damage Is Silent Until It Is Not
High-temperature components degrade from the inside out. Without systematic creep damage assessment, you are guessing when to replace parts that cost millions and take months to fabricate.
The Scale of Creep-Related Failure in Power and Process Plants
Creep accounts for the largest share of long-term failures in high-temperature pressure parts. These numbers reflect industry-wide experience across fossil-fired power stations, petrochemical units, and combined-cycle plants.
of all high-temperature component failures in fossil plants are directly attributed to creep rupture or creep-fatigue interaction
average extension of component service life achieved through systematic creep damage assessment and remaining life estimation
reduction in unplanned forced outages reported by plants that implemented periodic replica metallography programs
temperature threshold above which creep becomes the dominant degradation mechanism for Cr-Mo steel pressure components
What Happens Inside the Steel During Creep Exposure
At temperatures above roughly 40 percent of the absolute melting point, steel under sustained stress begins to deform plastically at a rate that depends on both stress and temperature. The microstructural changes that drive this deformation are invisible to every instrument except a metallurgical one.
- Grain boundary cavities nucleate undetected after 40-60% of creep life consumed
- Cavity chains form and link into microcracks with no operational warning
- Hardness loss progresses without being correlated to service exposure time
- Component runs to failure because no remaining life creep data exists
- Forced outage triggers emergency replacement at maximum cost and lead time
- Replica metallography detects isolated cavities at 30-40% life fraction
- Cavity density and linkage are graded against established damage categories
- Hardness trending confirms microstructural coarsening trajectory
- Larson Miller parameter projects remaining life with quantified uncertainty
- Replacement is scheduled months ahead with proper procurement and outage window
Three Stages of Creep: From First Strain to Rupture
Every component that fails by creep passes through the same three stages. The goal of assessment is to locate the component on this curve before it enters the third stage, where damage becomes irreversible and acceleration is rapid.
Primary Creep
Rapid initial strain occurs as dislocations rearrange under load. The deformation rate decreases as work hardening builds resistance. No grain boundary cavities are present at this stage, and the component is fully serviceable. This stage is short and often completes within the first few thousand hours of operation at temperature.
Secondary Creep
A steady-state balance forms between work hardening and thermal recovery. The strain rate reaches its minimum and stays nearly constant for the majority of service life. Grain boundary cavities begin to nucleate around the midpoint of this stage, typically at triple points and inclusions. This is the critical detection window for replica metallography and the stage where most remaining life creep calculations are anchored.
Tertiary Creep
Cavity coalescence produces microcracks that link into macroscopic cracks. Internal oxide penetration accelerates along crack paths. The strain rate increases exponentially as the effective load-bearing area reduces. Creep rupture follows with little additional warning. Components in this stage cannot be returned to service and must be replaced during the next available outage.
Six Core Techniques for Creep Damage Assessment
No single technique gives a complete picture of creep damage. Reliable assessment combines field metallurgical methods with analytical calculations to build a defensible remaining life estimate.
Replica Metallography
A field-acetate replica is taken from the prepared surface and examined under a microscope in a lab. Cavities, microcracks, and microstructural changes are graded against standards like ASTM E1351 to determine the creep damage category and estimate the creep life fraction consumed.
Portable Hardness Testing
A portable Brinell or Vickers tester measures surface hardness, which decreases as carbides coarsen and the microstructure degrades during prolonged high-temperature exposure. Trending hardness loss over multiple inspections provides a quantitative service exposure assessment correlated to remaining strength.
Oxide Scale Measurement
Internal oxide scale grows predictably with time and temperature. Measuring oxide thickness on a removed sample or through ultrasonic methods allows back-calculation of effective operating temperature history, revealing whether the component has been exposed above its design limit during transients.
Ultrasonic Shear Wave Testing
Focused ultrasonic beams detect creep cracks that have grown beyond the cavity stage, typically in weld heat-affected zones and bend locations. This technique complements replica metallography by catching damage that has already progressed to the macrocrack level where life fraction is critically high.
Wall Thickness Trending
Systematic ultrasonic thickness measurements taken at fixed locations over multiple outages reveal the creep strain rate directly. When plotted against time, the slope change from secondary to tertiary creep is detectable before rupture, providing an independent remaining life input alongside metallurgical findings.
Larson Miller Parameter Analysis
The Larson Miller parameter correlates stress, temperature, and time to rupture for a given material. By plotting known rupture data and extrapolating to the actual operating conditions of the component, engineers can estimate the total creep life and subtract consumed life to derive the remaining life with a defined safety margin.
See Your Component Creep Life Mapped in Real Time
iFactory ingests your operating temperature, pressure, and hour data, applies Larson Miller calculations, and correlates field inspection results to show exactly where each high-temperature component sits on its creep curve.
Creep Assessment Parameters by Component Type
Each high-temperature component type demands a tailored assessment approach based on its operating conditions, geometry, and known failure modes. These parameters represent typical industry practice for fossil and combined-cycle plants.
Remaining Life Estimation: The Step-by-Step Process
Remaining life estimation is not a single calculation. It is a structured process that combines operating data, field measurements, laboratory analysis, and engineering judgment to produce a defensible number that procurement and outage planning teams can act on.
Service History Compilation
Gather complete operating hour logs, temperature records at each zone, pressure histories, and any documented excursion events. The quality of the remaining life estimate is directly proportional to the quality of this input data.
Operating Parameter Review
Compare actual operating conditions against original design parameters. Components that have run hotter or at higher stress than designed will have consumed creep life faster than their nominal hour count suggests.
Field Metallurgical Examination
Surface preparation, acetate replica extraction, and in-situ hardness testing at predetermined locations including welds, bends, and straight sections. This is the single most informative step in the entire assessment.
Replica Analysis and Damage Grading
Laboratory examination of replicas under optical and scanning electron microscopy. Cavities are counted, measured, and classified by linkage state to assign a damage category that maps to a creep life fraction range.
Creep Life Fraction Calculation
Combine the metallurgical damage grade with Larson Miller parameter analysis using actual operating temperatures to calculate the fraction of total creep life consumed. Cross-check against hardness trend data and wall thickness measurements for consistency.
Remaining Life Estimation and Recommendation
Apply a safety margin to the calculated remaining life, recommend the next inspection interval, and flag any component that should be replaced at the next planned outage. The output is a prioritized replacement schedule tied to actual material condition rather than calendar age alone.
What Changes After Systematic Creep Assessment
Data from power plants that implemented structured creep damage assessment programs over two to three inspection cycles, compared against their prior approach of time-based replacement.
Five Reasons Creep Damage Goes Undetected Until Failure
Most plants do not ignore creep deliberately. They miss it because the detection gap between microstructural damage and visible failure is wide, and the tools to bridge that gap are not integrated into routine maintenance.
No Systematic Inspection Program
Creep assessment is treated as a one-time study rather than a recurring inspection discipline. Without scheduled replica intervals, damage accumulates between outages with zero visibility into the creep life fraction being consumed.
Incomplete Service History Records
Temperature excursion logs are missing or inaccurate, operating hour counts are aggregated rather than zone-specific, and the actual stress-temperature history of each component cannot be reconstructed for Larson Miller calculations.
Reliance on Design Life Without Condition Data
Components are replaced based on original design hours rather than actual metallurgical condition. A header that has run 50,000 hours below design temperature may have decades of life left, while one that experienced repeated over-temperature events may be near end of life at half the design hours.
Access Constraints on Insulated Components
Removing insulation, preparing surfaces, and taking replicas at elevation on live or recently shut down piping is logistically difficult. The effort is deferred until a major outage, by which point the damage may have advanced beyond the stage where remaining life estimation is reliable.
No Correlation Between Transients and Material State
Start-up shutdown cycles, load swings, and temperature excursions each consume a portion of creep and fatigue life. Without a system that correlates these events to cumulative damage, the impact of operational decisions on component aging remains invisible to both operators and engineers.
Pre-Assessment Readiness: What to Confirm Before the Outage
A successful creep damage assessment is determined before the first piece of insulation is removed. These are the preparatory steps that separate a thorough metallurgical assessment from a surface-level inspection that produces an unusable report.
Complete operating hour and temperature log compiled for each targeted component since last assessment or commissioning
All previous replica metallography reports and damage grades gathered and reviewed for trending analysis
Access scaffold plan prepared covering all weld joints, bends, and straight sections scheduled for examination
Replica metallography equipment calibrated and field technicians briefed on component-specific preparation requirements
Portable hardness tester verified against a certified reference block and correlated to previous readings at the same locations
Acceptance criteria and damage grading thresholds aligned with applicable code such as API 579 or BS 7910 before field work begins
Risk-based inspection ranking updated to reflect the latest operating data so the highest-risk locations are examined first
Oxide scale measurement procedure documented if internal oxide data is needed for temperature history back-calculation
Frequently Asked Questions
At what temperature does creep become a concern for pressure vessel components?
For common power plant materials like 2.25Cr-1Mo and 1Cr-0.5Mo steels, creep becomes the dominant degradation mechanism above approximately 425°C. Below this threshold, the creep strain rate is negligible and other mechanisms like fatigue or corrosion govern component life. However, the exact threshold depends on the specific alloy, applied stress level, and required service life, so each component should be evaluated against its material-specific creep data rather than a single universal temperature cutoff. Book a demo to see how iFactory applies material-specific thresholds to your fleet.
How does replica metallography work for field creep assessment?
A small area of the component surface is ground and polished to a mirror finish using portable equipment. Acetate film softened with acetone is pressed onto the prepared surface and allowed to harden, capturing an exact negative replica of the microstructure. This replica is removed without damaging the component, taken to a laboratory, and examined under optical and scanning electron microscopes. The examiner identifies grain boundary cavities, measures their size and density, and classifies the damage according to established categories that correlate to the creep life fraction consumed by the material at that location.
Can a component with detected creep cavities continue in service safely?
Yes, in most cases. The presence of isolated cavities in the early stages of creep does not mean immediate failure is imminent. The critical question is what damage category the cavities represent and how much remaining life exists before they progress to linked microcracks. Components with damage in the lower categories can often run for years with reduced inspection intervals, while those in the higher categories require replacement at the next planned outage. The decision is always based on a combination of replica findings, operating conditions, and calculated remaining life with an appropriate safety margin applied. Talk to a specialist about interpreting your damage grades.
What is the Larson Miller parameter and how is it used in remaining life estimation?
The Larson Miller parameter is a time-temperature relationship defined as P = T(C + log t), where T is absolute temperature, t is time, and C is a material constant typically around 20 for steels. It allows creep rupture data generated at different temperatures to be collapsed onto a single master curve. In practice, engineers plot known rupture data for the component material, calculate the Larson Miller parameter for the actual operating conditions and hours accumulated, and determine where the component falls on that master curve. The remaining life is then estimated by finding the additional hours needed to reach the rupture line at the same stress level, with a safety factor applied to account for material scatter and data uncertainty.
How frequently should high-temperature components be assessed for creep damage?
Inspection intervals depend on the component type, operating conditions, and findings from previous assessments. Superheater and reheater headers are typically assessed every 40,000 to 60,000 operating hours, while main steam and hot reheat piping may be assessed at 60,000 to 80,000 hour intervals initially. If early-stage creep damage is detected, the interval is shortened to track the rate of damage progression and refine the remaining life estimate. If no damage is found, the interval may be extended cautiously. The key principle is that the interval should be short enough to detect the transition from secondary to tertiary creep before the component reaches a critical damage state. Book a demo to see how iFactory automates interval scheduling based on your fleet data.
The Bottom Line on Creep Damage Assessment
Creep does not announce itself with a pressure alarm or a vibration spike. It progresses silently inside the grain structure of every header, pipe, and drum that operates above the creep threshold, consuming life with every hour at temperature. The plants that avoid catastrophic creep failures are not the ones with better steel. They are the ones that look at the steel often enough, with the right techniques, to know where each component stands on its damage curve before that curve turns vertical. Systematic creep damage assessment using replica metallography, hardness testing, and Larson Miller analysis is the only way to replace components on your schedule instead of on their schedule.
Map Your High-Temperature Fleet Against the Creep Curve
Book a 30-minute scoping call and bring your component list with operating hours. iFactory applies Larson Miller calculations and correlates your inspection data to show exactly where each component sits on its creep life curve.