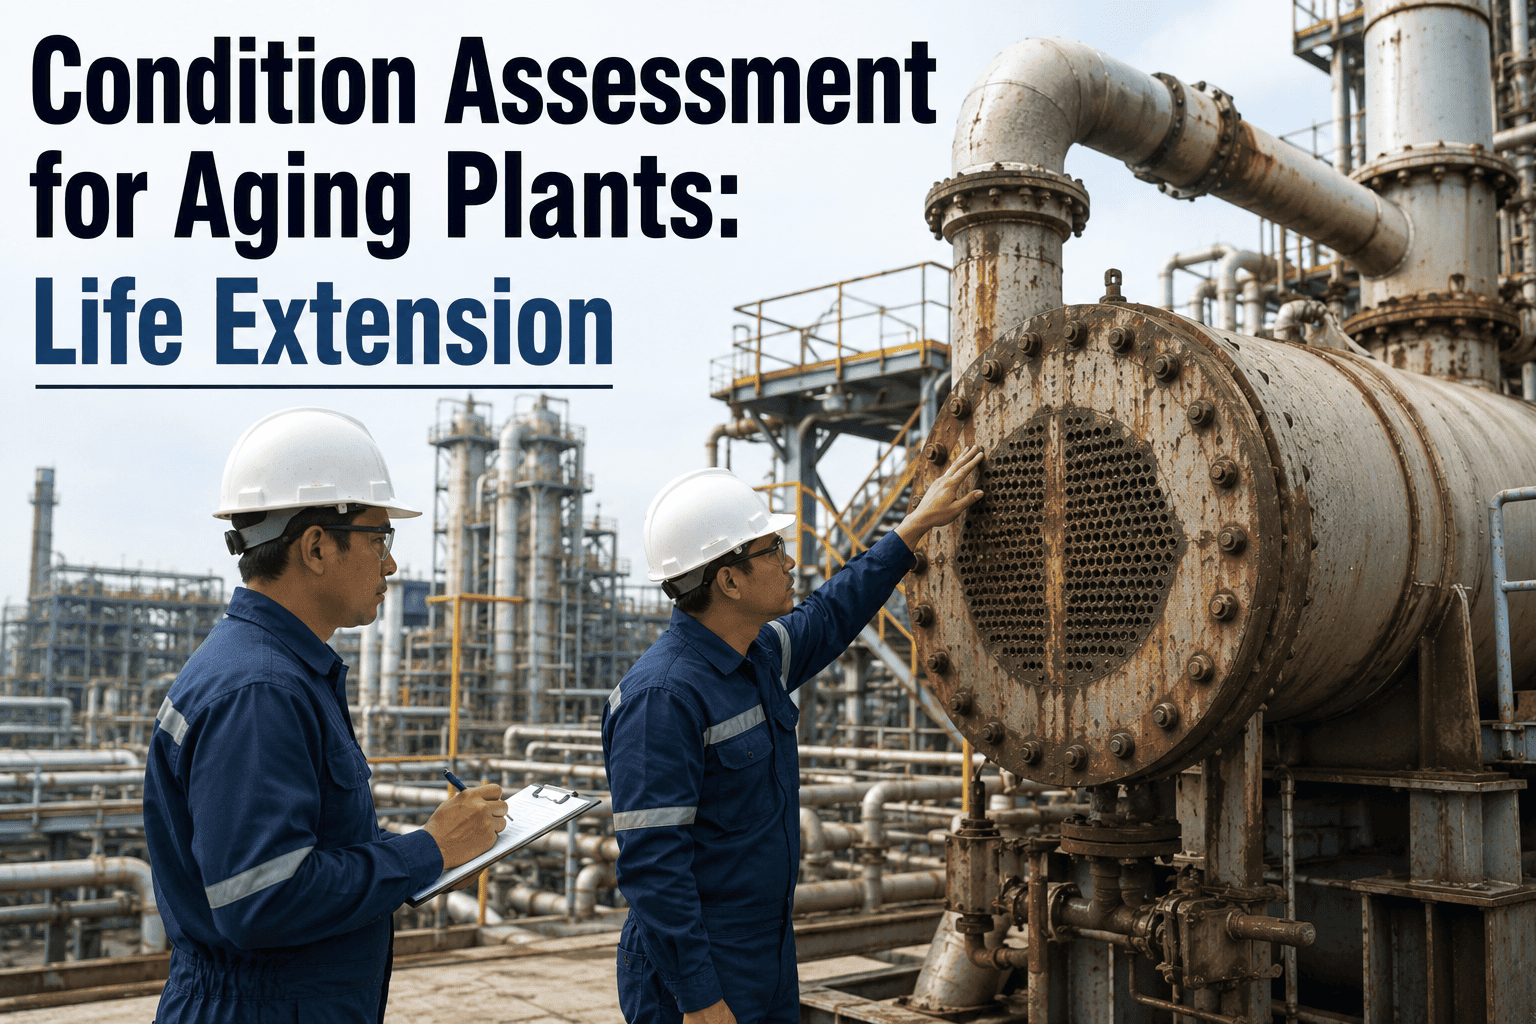
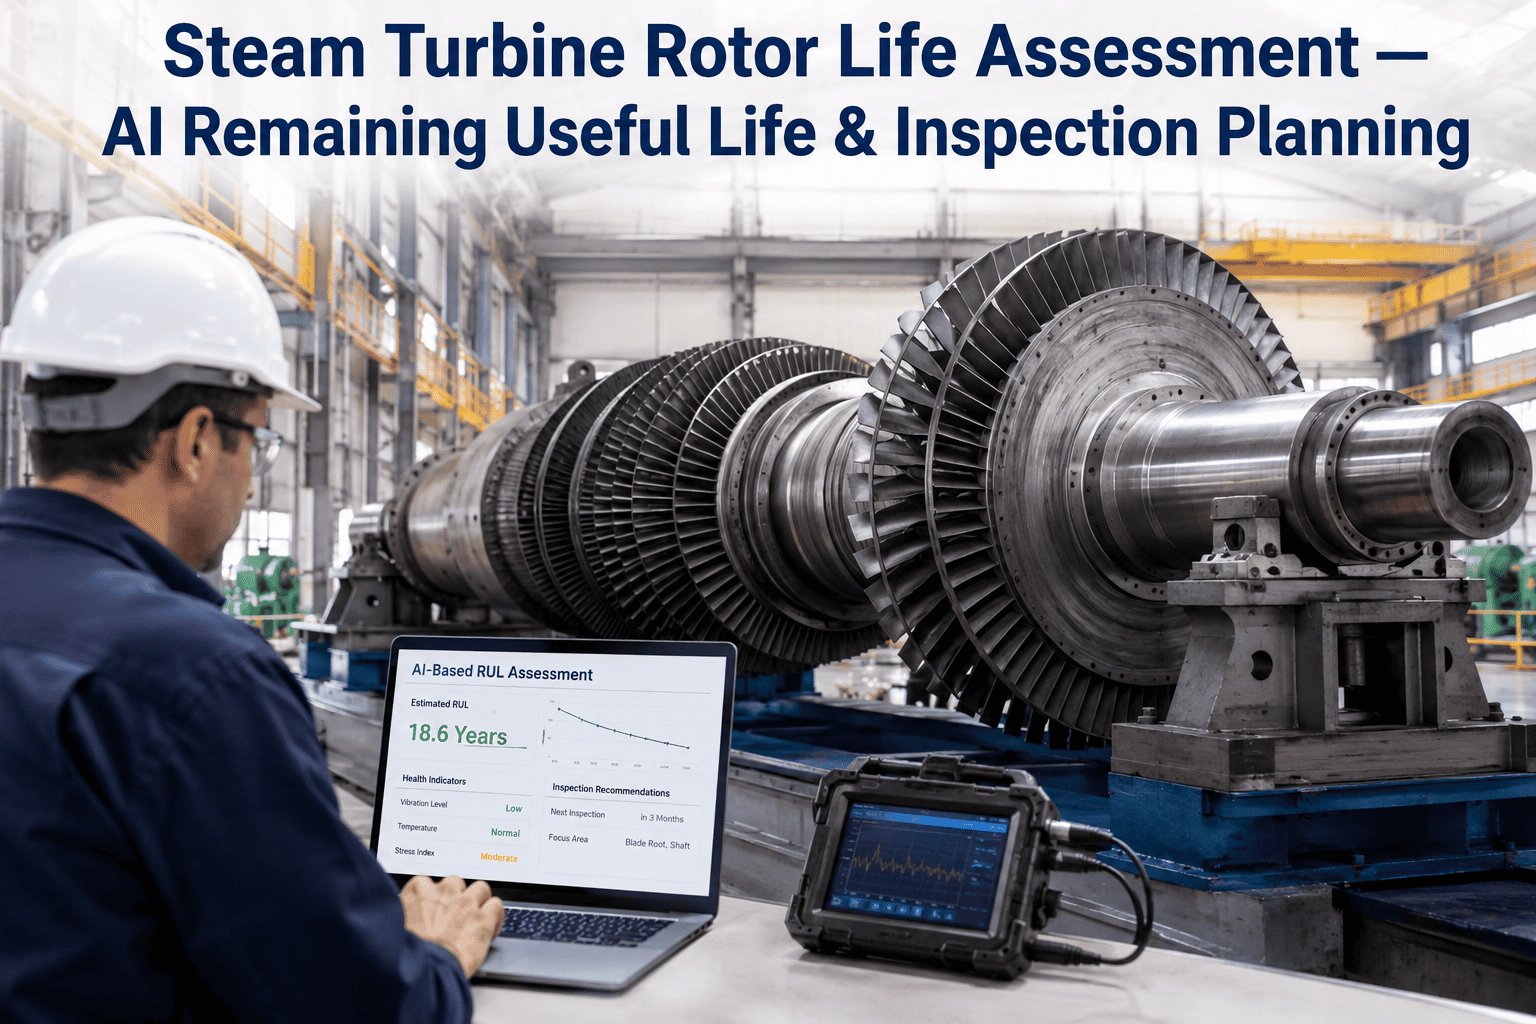
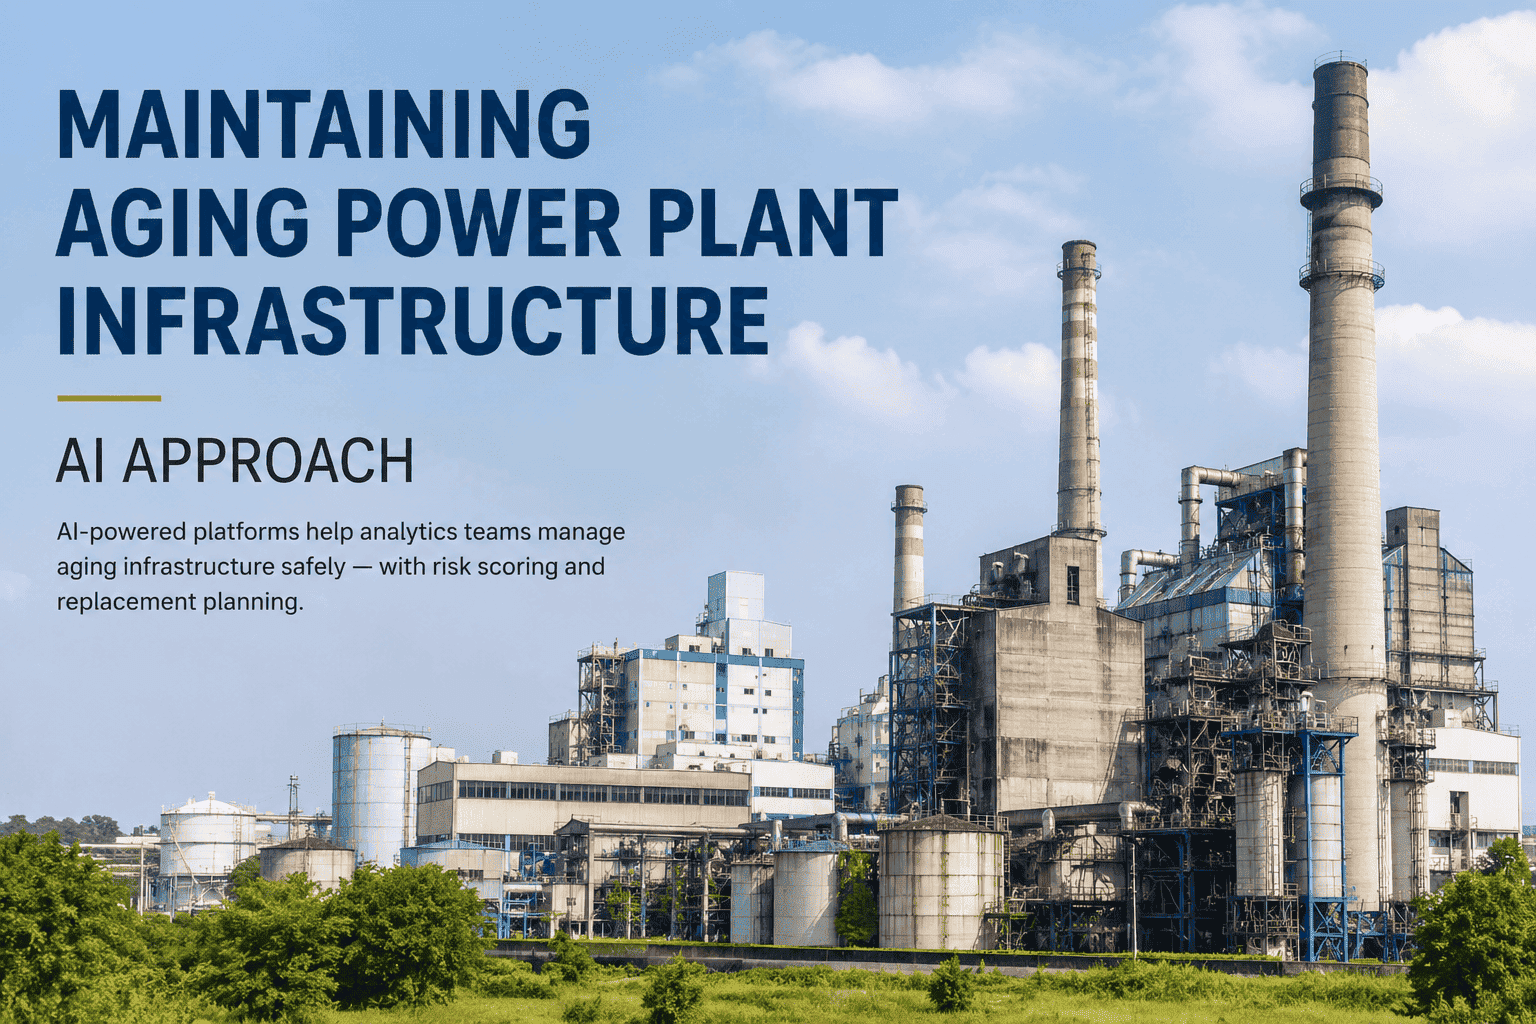
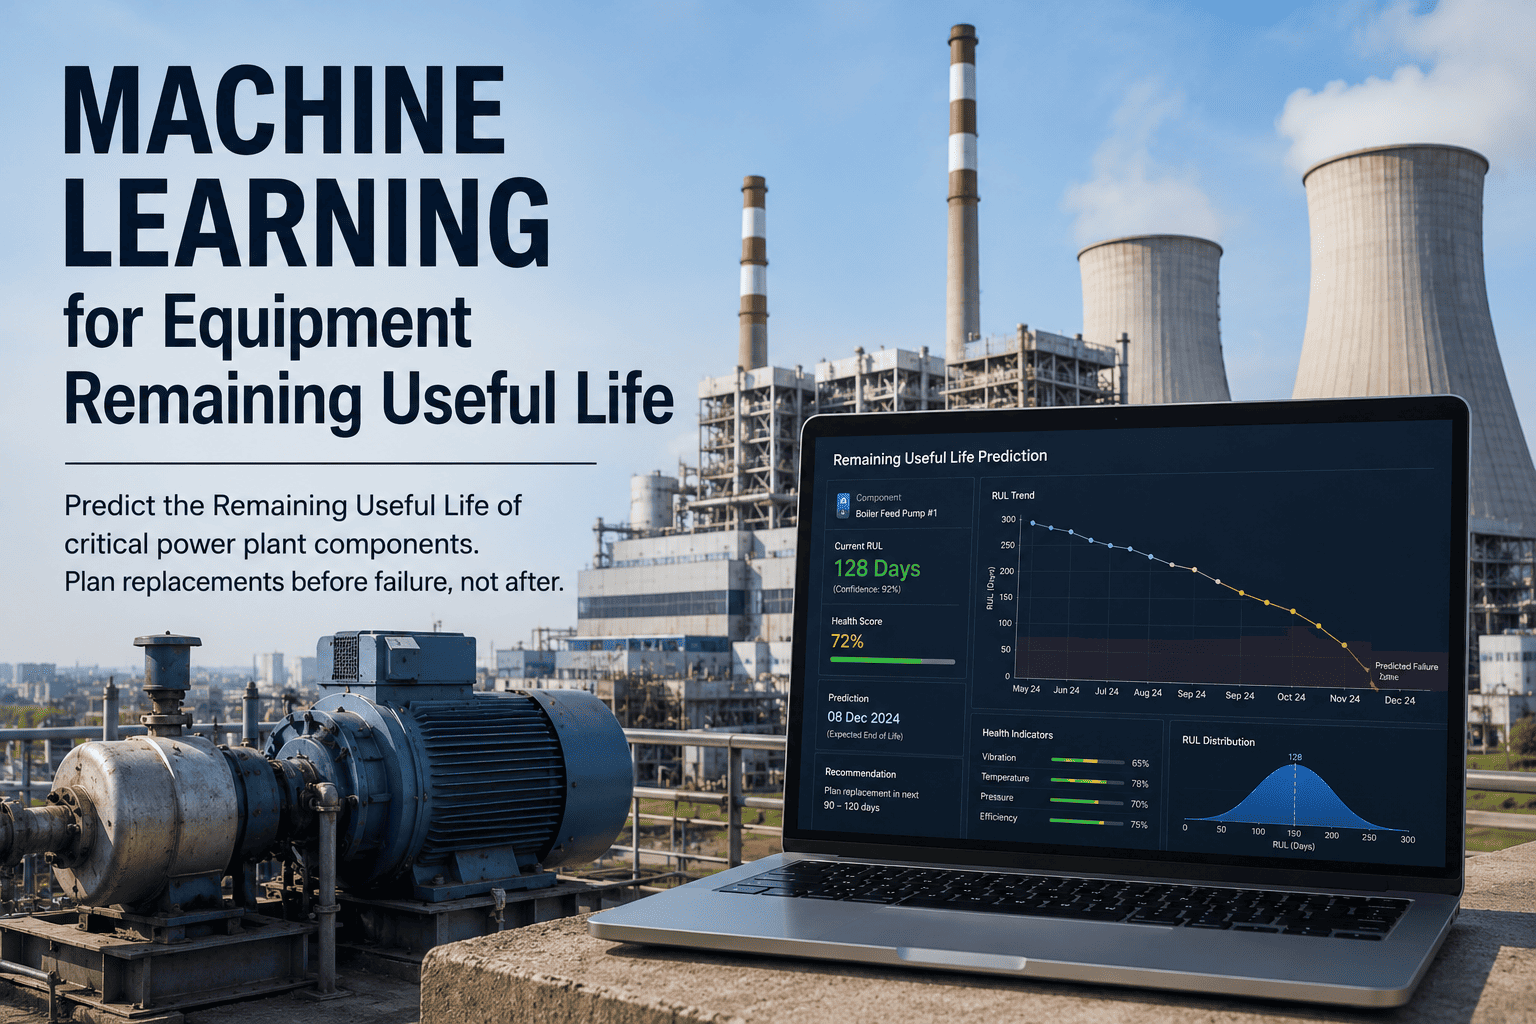
A coal-fired unit commissioned in 1982 does not fail on a birthday. It fails because a specific superheater tube's oxide scale reached a specific thickness, a specific header ligament accumulated its final creep cycle, or a specific turbine rotor's crack initiated in a bore no one had inspected in eleven years. The question every operator of an aging power plant faces — and it is a capex question with hundreds of millions of dollars attached — is not "when will this plant fail?" but "which components are actually driving the retirement date, and what would extend it?" That question is what condition assessment and remaining life analysis exist to answer, and the plants that get it right buy themselves twenty to thirty years of additional service instead of writing a check for a new build. If you are staring at that decision on your own fleet, the fastest way to see how continuous AI-supported condition assessment would inform your specific units is to book a demo.
CONDITION ASSESSMENT · AGING PLANT LIFE EXTENSION
Twenty More Years, or a New Build. The Assessment Decides.
iFactory brings continuous AI-supported condition monitoring together with structured remaining-life analysis — turning the retire-or-refurbish question from a judgment call into a defensible engineering decision.
20–30 yr
Additional service life achievable through accurate life assessment on aging fossil plants
+1%
Availability improvement documented in life-extension programs applying structured RLA
1000°F+
Steam temperatures at which piping and tubing dominate the aging plant risk profile
First
Boiler tubes are typically the first components in a unit to reach end of useful life
The Decision at Stake
Retire, Refurbish, or Run — the Three Doors an Aging Plant Faces
Every aging thermal power plant eventually arrives at the same three-door decision, usually forced by a specific triggering event — a header crack found on outage, a turbine trip that reveals rotor damage, a boiler tube leak sequence that stops looking random. The three doors carry wildly different price tags and wildly different consequences, and the condition assessment is what tells you which door is actually open.
DOOR 1
Retire the Unit
Decommission and replace with new generation. Highest capital outlay, longest lead time, and often the answer when structural components (superheater headers, main steam piping, turbine rotors) have accumulated damage past defensible repair.
Capex: $$$$$ · Lead time: 4–7 years
DOOR 2
Refurbish and Extend
Targeted replacement of end-of-life components combined with life-extension work on the rest of the unit. The right answer when the assessment shows a small number of critical components driving the retirement date, with the rest of the plant having 15–25 years of usable life remaining.
Capex: $$ · Lead time: 12–24 months
DOOR 3
Run to Fail (Managed)
Continue operation with intensified monitoring and reactive replacement, accepting shorter cycles between outages. The right answer only when the assessment shows aging in components that are practical to swap on outage and no structural risk that would drive a catastrophic failure.
Capex: $ · Ongoing outage cost: Rising
Which door is open for your plant is not a judgment call — it is what a structured condition assessment tells you. The rest of this page walks through how that assessment is built.
Damage Mechanisms
What Actually Ages a Power Plant — the Seven Mechanisms That Set the Clock
Aging is not one process. It is seven distinct damage mechanisms operating simultaneously on different components at different rates, each with its own inspection method, measurement technique, and life-extension response. Any condition assessment worth reading identifies which mechanism is dominant on which component — because the answer determines what you do about it.
M-01
Creep
Slow deformation under sustained high temperature and stress. Primary aging mechanism on superheater and reheater tubing, headers, and main steam piping above ~950°F. Measured through oxide scale thickness, dimensional change, and microstructural evaluation.
Primary on: SH/RH tubing, headers, HP steam piping
M-02
Low-Cycle Fatigue
Damage from thermal strain during unit startup, shutdown, and load transients. Dominant on thick-walled components in units that have shifted from base-load to cycling duty — headers, drums, turbine rotors, and heavy-wall piping.
Primary on: Headers, drums, turbine rotors
M-03
High-Cycle Fatigue
Damage from vibration or high-frequency stress cycles. Common on blades, piping supports, small-bore connections, and any component seeing sustained flow-induced vibration or resonance excitation over decades of operation.
Primary on: Turbine blades, small-bore piping
M-04
Thermal Fatigue
Cracking from repeated temperature gradients across a component. Waterwalls, attemperator downstream piping, and steam-water mixing sections are prime candidates, especially in units that see load-following operation.
Primary on: Waterwalls, mixing tees, attemperator lines
M-05
Corrosion
Wall loss from waterside or fireside chemical attack. Waterside corrosion on economizer tubes, fireside corrosion and erosion on superheater tubes, and flow-accelerated corrosion on carbon-steel piping in wet-steam service.
Primary on: Economizer, waterwalls, condensate piping
M-06
Erosion
Wall loss from mechanical impact by particulates, droplets, or flow. Fly ash erosion on backpass tubing, soot-blower erosion patterns, and moisture droplet erosion on last-stage LP turbine blades. Predictable in location but variable in rate by fuel and operation.
Primary on: Backpass tubing, LP blades
M-07
Thermal Aging & Embrittlement
Progressive change in material properties from long-term high-temperature exposure. Reduces toughness and shifts fracture behavior, especially in ferritic pressure-vessel steels. Not visible without material sampling — often the mechanism that hides in the assessment.
Primary on: Thick-wall pressure vessels, HP casings
The Three-Phase Methodology
How a Defensible Condition Assessment Is Actually Built
The industry-standard approach to aging plant condition assessment is a three-phase methodology, and it exists in that shape because each phase feeds the next — you cannot skip Phase I and get a useful Phase III number. What follows is the structure that OEMs, third-party assessors, and utility engineering groups all use as the backbone, with the AI-supported continuous monitoring layer sitting alongside as the source of trend data that used to require destructive sampling.
PHASE I
Pre-Outage Component Screening
Before you open a single access door, you screen. Operating history — temperature excursions, load cycles, fuel quality variations, prior outage findings — identifies which components are the highest-probability aging candidates. Maintenance records surface prior repair welds, prior tube replacements, and prior operating anomalies. The output is a ranked inspection and test plan for the upcoming outage.
Ranked component criticality matrix
Outage inspection scope document
Required NDT and sampling plan
PHASE II
During-Outage Inspection and Testing
The outage window is when the physical evidence gets collected. Ultrasonic wall thickness and oxide scale measurements on tubing, replication for microstructural evaluation, hardness testing, dimensional measurements on rotors and blades, dye-penetrant and eddy-current inspection on stress concentration areas — everything the Phase I plan called for, executed against a documented test procedure with traceable results.
UT wall thickness maps
Oxide scale measurements
Microstructural replicas and hardness data
PHASE III
Post-Outage Remaining Life Analysis
The inspection data goes into life-consumption calculations — creep damage integration, low-cycle fatigue accumulation, corrosion and erosion trending, and material-specific rupture curves. The output is a component-by-component remaining useful life estimate with a confidence interval, feeding directly into the retire/refurbish/run decision and into the next outage's Phase I plan.
Component RUL with confidence bands
Refurbishment scope and cost model
Recommended next-outage inspection interval
SEE WHERE YOUR PLANT ACTUALLY IS ON THE CURVE
Run Your Last Two Outage Reports Through the Analysis
Most engineering teams discover more from measuring their own historical inspection data against a structured RLA framework than from any new inspection round.
Component Aging Priority
Which Components Set the Retirement Clock — and in What Order
Not every component ages at the same rate, and not every component drives the retirement decision. The list below reflects the industry-observed order of end-of-life arrival in most fossil units — with boiler tubes almost universally reaching their limit first, and heavy-wall pressure components typically outlasting the tubing they are connected to by decades.
Where AI-Supported Monitoring Fits
The New Layer That Sits Alongside the Classical Assessment
Classical condition assessment is fundamentally outage-driven — a plant produces new data every two to four years when the unit is off, and the analysis in between rests on operating history and calculation. AI-supported continuous monitoring does not replace that framework; it fills the gap between outages with the trend data that used to require another outage to collect.
CLASSICAL RLA ONLY
Data collected every 2–4 years on outage
Trend estimated from operating log integration
Damage inferred from indirect indicators
New surprise findings at every major outage
Remaining life estimated with wide confidence bands
CLASSICAL + AI CONTINUOUS MONITORING
Thermal, visual, and process data trended daily
Component-level damage rate computed continuously
Anomalies flagged in the shift they emerge
Outages start with a known scope, not surprises
Remaining life estimated with tighter confidence bands
The value shows up in three places: the outage scope becomes predictable weeks ahead of the outage itself, the RLA analysis has real-time operating data instead of averaged log integration, and the retire-or-refurbish decision rests on a continuous evidence stream rather than a two-year-old snapshot.
The Capex Framework
How the Assessment Actually Flows Into the Capital Decision
The condition assessment is not an academic exercise — it exists to inform a very expensive decision. Every step below feeds directly into what leadership signs off on, and the credibility of the final number depends on the discipline of the steps that came before it.
STEP A
Component RUL Ranking
Every critical component gets a remaining useful life estimate with a confidence interval. Components are ranked shortest-to-longest, and the unit's driving components — the ones that would force retirement — become visible.
→
STEP B
Refurbishment Scope Model
For each driving component, the model estimates cost and outage time to replace or repair, plus the RUL that intervention would restore. This produces a menu of interventions with cost and life-extension impact for each.
→
STEP C
Retire vs Refurbish Comparison
The refurbishment scenario is compared against the replacement scenario across full life-cycle cost — capex, opex, availability, fuel efficiency, regulatory risk. The comparison is done in NPV terms with sensitivity ranges, not point estimates.
→
STEP D
Board-Ready Decision Package
The output is a decision document with the recommended path, the assumptions behind it, the risk factors, and the audit trail back to the underlying inspection data — the kind of package a utility board or an IPP investment committee can actually approve against.
Plant Engineer Perspective
Field Perspective
R
Rajesh N.
Chief Engineer, 2×210 MW Thermal Station, 38 Years in Service
The board was ready to write off Unit 1 and start a replacement study. When we ran the structured RLA, we found the retirement clock was being set by exactly two headers and a section of hot reheat piping — everything else on the unit had fifteen to twenty years of clean life left. We spent one refurbishment outage on those three items and pulled the retirement date out by two decades. That is not a small number when you are looking at a new-build price tag.
Common Questions
Aging Plant Condition Assessment — Questions Engineering Teams Ask
How accurate can a remaining life estimate actually be on a 40-year-old unit?
Remaining life estimates on well-characterized aging plants are typically presented with a confidence interval rather than a single number, and the width of that interval shrinks meaningfully as more inspection data is added to the analysis. On a first-time assessment of a plant with limited historical data, RUL estimates on the driving components carry uncertainty of roughly ±30–40% and are used mainly to rank criticality. On plants with two or more prior structured assessments and continuous monitoring in between, the confidence bands can tighten to ±10–15% on the same components, which is enough to make a capex decision defensible. The key point is that the analysis is a decision-support tool with quantified uncertainty, not a single date on a calendar, and it improves with every additional data point you feed it.
Do we have to shut down for an extended outage to do a first assessment?
Phase I of the assessment is entirely a records-and-analysis exercise that happens with the unit running, so there is no outage impact to get started — operating history review, prior inspection findings review, and criticality ranking can be completed and used to plan the next scheduled outage rather than triggering an extra one. Phase II inspection work is then executed within your next planned outage window using the ranked scope, which means the assessment adds inspection intensity to an outage that was going to happen anyway rather than creating a new one. This is one of the reasons the structured methodology works in real operating fleets — it is designed to overlay on top of the existing outage rhythm rather than disrupt it, and the first useful outputs come well before the first outage.
Our unit has switched from base-load to cycling — does that change the assessment?
It changes the assessment significantly, because the damage mechanism mix shifts sharply when a unit moves from base-load to cycling duty. Creep damage — the dominant mechanism on base-loaded high-temperature components — accumulates more slowly on a cycling unit that spends time at lower load, but low-cycle fatigue damage on thick-walled components accelerates because every startup and shutdown adds a full thermal strain cycle. Headers, drums, and turbine rotors become the critical population instead of superheater tubes, and the inspection priority shifts to match. This is exactly the kind of operating-mode change that structured RLA is built to capture — the historical operating profile feeds directly into the damage-mechanism weighting, and the recommended inspection scope adjusts accordingly.
How does AI-supported continuous monitoring change the analysis?
Continuous monitoring changes two specific things — the outage scope prediction and the RUL confidence bands. Instead of arriving at an outage with a general inspection plan and discovering the actual damage state only after opening the unit, you arrive with component-level trend data covering the entire interval since the last outage, and the outage becomes a verification-and-repair exercise rather than a discovery exercise. The RUL analysis then rests on real-time temperature histories, thermal transient counts, and component-level anomaly patterns rather than on log integration and averaging, which tightens the confidence bands on the remaining life estimate. Neither of those changes replaces the classical inspection and testing — they make the classical work faster to plan and more accurate to interpret. If you want to see how this would look layered onto your specific unit's history, the fastest path is to walk through it during a scheduled
demo.
What is the shortest useful engagement — can we start with one critical component?
Yes, and this is a common way that structured assessments start on fleets that have not run a full RLA before. A single high-consequence component — typically a main steam header, a superheater outlet header, or a hot reheat piping section — is chosen for the initial assessment, and the results serve two purposes at once: they give engineering a defensible answer on that specific component, and they give leadership a proof of what the full-fleet assessment methodology looks like in practice. From that foundation the assessment scope expands to the rest of the unit, and eventually to sister units. This is the pragmatic entry point, and for scoping which component would give your fleet the strongest first data set, the implementation team can walk through the options through
support.
RETIRE · REFURBISH · RUN — DECIDED BY EVIDENCE
The Retirement Date Is a Choice. Structured Assessment Is How You Make It.
iFactory brings continuous AI-supported monitoring together with the three-phase RLA methodology — turning aging plant capital decisions from a judgment call at the boardroom into a documented engineering position built on evidence.
3 PhasesStructured Methodology
7 MechanismsDamage Analysis
±10–15%RUL Confidence Achievable
20–30 yrExtension Potential