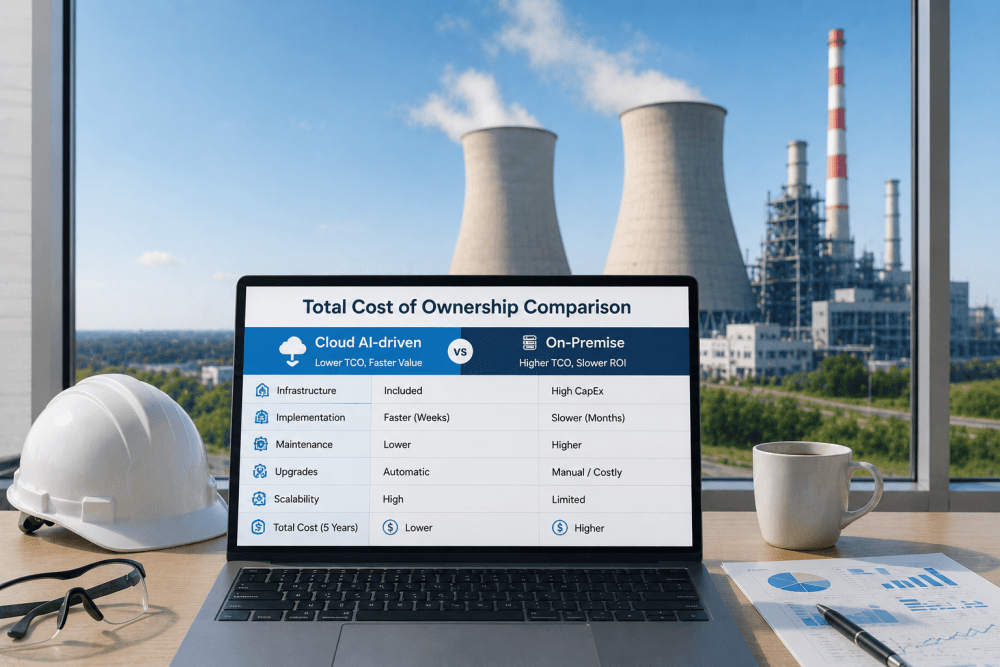
A plant engineer comparing two turbine motors on a procurement spreadsheet sees a $12,000 gap between them and picks the cheaper one — a decision that looks obviously correct until eighteen months later, when the maintenance log shows the "value" motor has already cost $97,000 in repairs, logged 340 hours of unplanned downtime, and quietly dragged its own line's efficiency down from 87% to 61%. Nobody had put the sticker price next to the actual operating history until a reliability review forced the comparison, and by then the plant had been absorbing the difference for two years without anyone officially deciding to accept it. Purchase price is consistently only 20 to 40 percent of what an industrial asset actually costs across its life — the remaining 60 to 80 percent lives in installation, energy consumption, maintenance and repairs, downtime losses, and eventual disposal, all of it invisible on a procurement comparison that stops at the invoice. Total cost of ownership is the framework that forces those hidden costs into daylight before the purchase decision gets made, and iFactory brings maintenance, energy, and downtime data together into a single live TCO view instead of leaving that math to a spreadsheet nobody updates.
Total Cost of Ownership for Power Plant Asset Lifecycle
Acquisition, operation, maintenance, and disposal costs — modeled across the full asset lifecycle so investment and retirement decisions get made on real numbers, not just the sticker price on a purchase order.
Purchase Price Is the Tip, Not the Total
Every procurement comparison naturally gravitates toward the number that's easiest to compare: the price on the quote. That number is real, but it typically represents somewhere between a fifth and two-fifths of what the asset will actually cost across a standard operating life — the rest accumulates quietly, spread across years of energy bills, maintenance invoices, spare parts orders, and downtime that never shows up on the same spreadsheet as the original purchase decision.
~20–40% of lifetime cost
Over a standard ten-year industrial lifecycle, this hidden portion typically adds up to three to five times the original sticker price. Two assets with identical purchase prices can diverge enormously in total cost once maintenance frequency, energy efficiency, and reliability differences compound over thousands of annual operating hours — which is exactly the comparison a purchase-price-only decision structurally cannot make.
A Working TCO Formula for Industrial Assets
There is no single universal TCO formula, but the standard framework sums every cost category across the asset's useful life, discounting future costs to present value where the analysis spans multiple years. The version below is the practical starting point most plants adapt for their own equipment classes.
Each term deserves its own line item rather than a rough estimate, because the categories that get glossed over — spare parts inventory carrying cost, training refreshers when staff turn over, the compounding effect of a few extra percentage points of energy inefficiency across thousands of run-hours a year — are frequently where the real difference between two competing assets actually lives.
What Actually Sits Inside Each Cost Bucket
Treating TCO as a single number hides where the real leverage is. Breaking it into its component categories shows which levers a maintenance or engineering team can actually pull, versus which costs are effectively locked in the moment the purchase order is signed.
Downtime and maintenance are usually where a reliability program has the most influence, because unlike the fixed acquisition cost, both respond directly to how well an asset is monitored, how early failures are caught, and how consistently preventive work actually happens rather than getting deferred under production pressure.
Repair, Rebuild, or Replace — Where the Threshold Sits
The most common practical use of a TCO model isn't a new-equipment purchase comparison — it's the ongoing decision about whether an aging asset is still worth repairing. Without a running TCO view, that decision defaults to whatever the next repair estimate happens to cost in isolation, without ever stepping back to see the accumulated pattern across the asset's recent history.
The replace threshold isn't a fixed percentage that applies everywhere — it depends on the specific asset class, its criticality to production, and how much residual value remains. What matters is having the running cost history to actually see the threshold approaching, rather than discovering it retroactively after a plant has been quietly subsidizing a failing asset for two years, the way the motor example at the start of this article was.
Turn Repair-vs-Replace Into a Ten-Minute Decision
With maintenance history, downtime logs, and efficiency trends already connected, iFactory lets your team see exactly where an asset sits against its replace threshold — not just what the next repair quote costs in isolation.
Why Identical Sticker Prices Can Hide a Very Different Total Cost
The clearest way to see TCO in action is a direct side-by-side of two assets that looked comparable at purchase time and diverged sharply once real operating data accumulated.
A ten percent efficiency difference between two motors compounding across roughly 8,000 annual operating hours can produce a six-figure gap over a decade on its own, before maintenance and downtime differences are even factored in. The purchase-price comparison that favored Asset B never had a chance to catch this, because the entire signal lived in data that only accumulates after the purchase decision is already made.
Why Most TCO Analyses Get Done Once and Never Updated
The traditional way TCO analysis happens is as a one-off consulting exercise or a spreadsheet built for a specific purchase decision, then abandoned the moment the decision is made. That approach captures a snapshot but misses the entire point of ongoing asset management — costs keep accumulating after the purchase, and a model that isn't updated with real maintenance and downtime data stops reflecting reality within months.
Frequently Asked Questions
Make Every Asset Investment and Retirement Decision on Real Numbers
iFactory connects maintenance, energy, and downtime data into a live total cost of ownership view for every major asset — so the next purchase or replace decision isn't a guess.