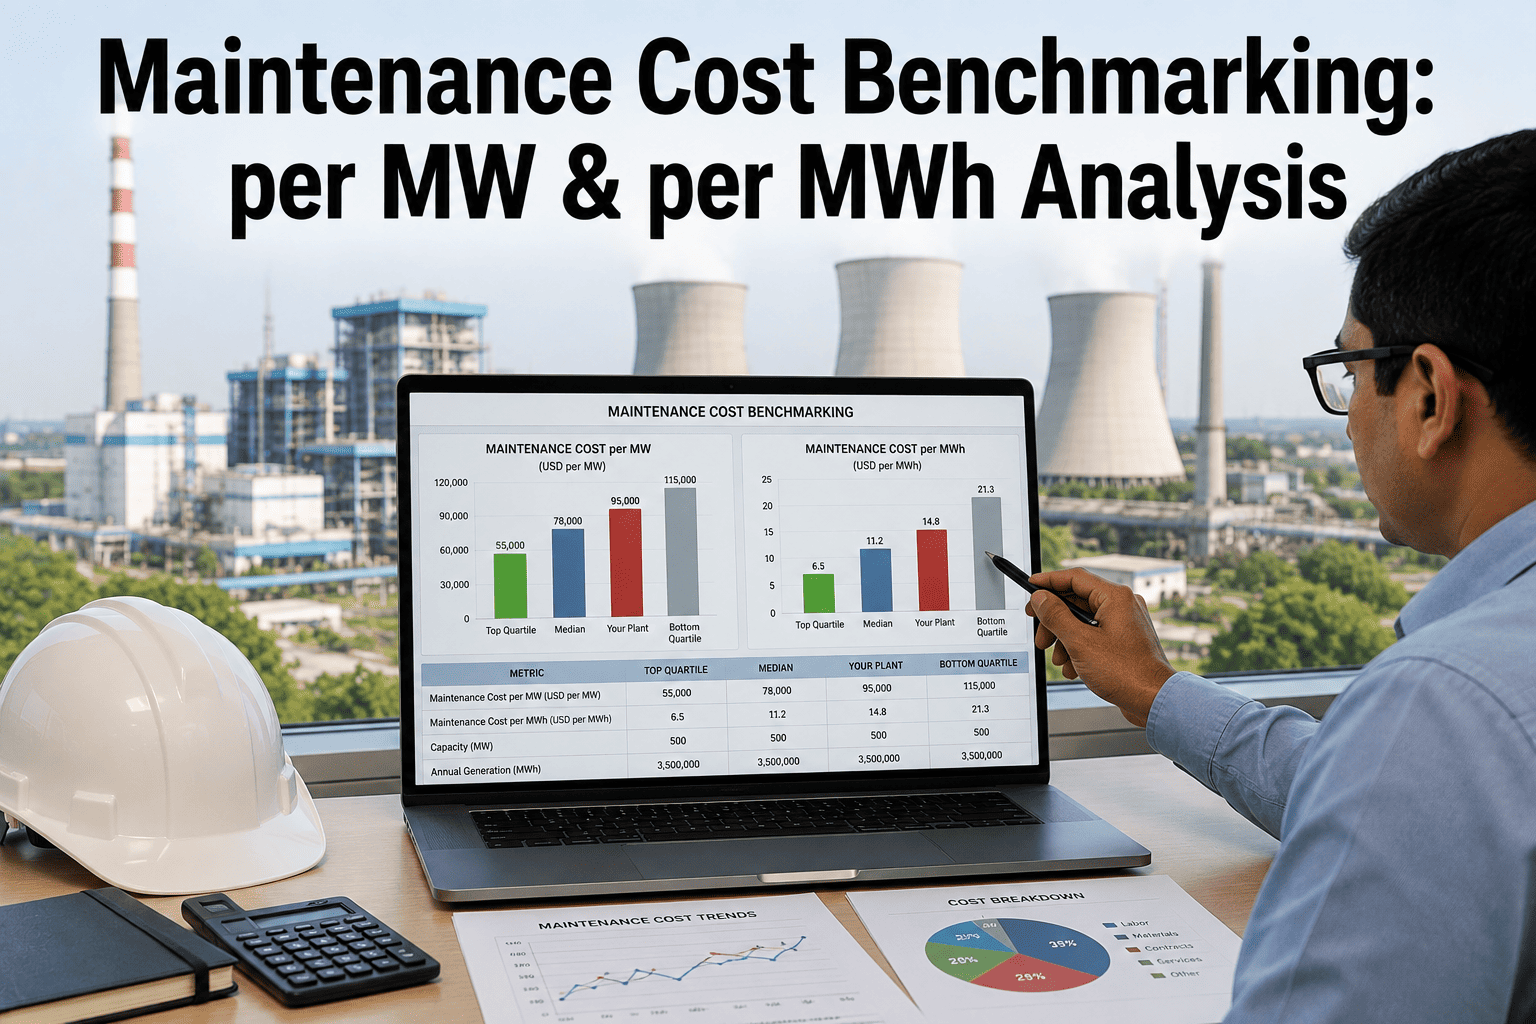
"Is our maintenance spend too high?" is a question most plant managers get asked every budget cycle and can rarely answer with real confidence, because comparing a maintenance budget in isolation tells you almost nothing without a normalized reference point. Cost per MW of installed capacity and cost per MWh generated are the two benchmarks that let a plant compare itself meaningfully against industry averages and its own history, rather than defending a number that has no context attached to it. iFactory tracks both figures continuously against your operating data, and the methodology behind them is worth reviewing in a Book a Demo.
A Maintenance Budget Number Means Nothing Without A Normalized Comparison
Total maintenance spend on its own can't tell you whether a plant is running lean or overspending, because it doesn't account for capacity or actual generation. Cost per MW and cost per MWh turn a raw budget figure into something that can be benchmarked against industry data and tracked meaningfully over time.
Cost Per MW And Cost Per MWh Answer Different Things
Cost per MW of installed capacity is a useful benchmark for comparing maintenance intensity across similarly sized assets regardless of how much they actually ran during the period, which makes it well suited for comparing a plant against industry-wide capacity-based averages. Cost per MWh generated tells a different story, since it captures maintenance cost relative to actual output, and a plant that ran fewer hours in a given year will show a higher cost-per-MWh figure even if its cost-per-MW figure stayed flat. Tracking both together, rather than picking one, avoids drawing the wrong conclusion from a single number that only tells half the story.
Cost Per MW Installed
Reflects maintenance intensity relative to asset size, useful for comparing against industry capacity-based benchmarks independent of how much the plant actually generated in the period.
Cost Per MWh Generated
Reflects maintenance cost relative to actual output, which rises when a plant runs fewer hours even without any change in underlying maintenance intensity or spend discipline.
Why Comparing Against Industry Averages Isn't As Simple As It Sounds
Industry-published maintenance cost benchmarks are useful reference points, but applying them without adjustment can produce a misleading conclusion. Plant age, technology type, fuel source, and dispatch pattern all shift what a reasonable cost-per-MW or cost-per-MWh figure looks like, and comparing a peaking plant that cycles frequently against a baseload plant that runs continuously, or comparing an aging asset against a recently commissioned one, without adjusting for those differences tends to produce a comparison that looks alarming or reassuring for the wrong reasons.
Plant Age And Technology
Older units and certain technology types carry structurally higher maintenance intensity, so comparing across mismatched asset ages without adjustment inflates or deflates the apparent gap versus benchmark.
Dispatch And Cycling Pattern
Frequent start-stop cycling drives higher maintenance cost per MWh than steady baseload operation, independent of maintenance program quality, so cycling frequency needs to be part of any fair comparison.
Fuel And Fleet Type
Maintenance cost structures differ meaningfully across gas, coal, and renewable generation, so a benchmark drawn from the wrong fleet type as a reference produces a comparison that isn't actually apples-to-apples.
Knowing Where You Stand Is Only Step One
A properly adjusted benchmark tells a plant where it stands, but the more useful application is setting an internal cost target that accounts for a realistic improvement trajectory rather than an industry median that may not even be achievable given a specific plant's age and dispatch pattern. Plants that treat the benchmark as a starting reference point, then set year-over-year internal targets against their own trend line, tend to get more sustained value from the exercise than those that chase a single external number and lose momentum once it's reached or found to be unrealistic.
Realistic Internal Targets
A target set against a plant's own historical trend, informed by but not chained to an external benchmark, tends to sustain improvement momentum better than chasing a possibly unrealistic industry median.
Category-Level Accountability
Breaking a plant-wide cost target down by maintenance category or system gives individual teams a number they can actually influence, rather than one shared, diffuse plant-wide figure.
What Changes When Comparisons Are Adjusted For Context
| Aspect | Unadjusted Benchmark | Context-Adjusted Benchmark |
|---|---|---|
| Comparability across plant ages | Distorted by age differences | Adjusted for asset age and technology |
| Cycling plant fairness | Appears overspent versus baseload | Compared against similarly cycled fleet |
| Trend reliability year over year | Sensitive to output swings | Tracked on both MW and MWh basis |
| Usefulness in budget defense | Easily challenged | Grounded in a like-for-like comparison |
Know Where Your Maintenance Spend Actually Stands
iFactory tracks cost per MW and cost per MWh continuously so budget conversations start from a defensible number.
A Single Cost Figure Hides Whether The Driver Is People Or Parts
Cost per MW and cost per MWh are useful top-line figures, but neither one distinguishes between a plant that's spending on labor because of overtime-heavy reactive work and one that's spending on materials because of expensive emergency parts procurement. Splitting the normalized figure into labor and materials components usually reveals a more actionable story, since a labor-heavy cost profile often points toward a staffing or planning problem, while a materials-heavy profile often points toward a reliability or parts-sourcing problem, and the two call for very different corrective action even when the total normalized cost looks similar.
Labor-Heavy Cost Profile
A rising labor share of normalized cost often signals overtime-driven reactive work or understaffed planned maintenance, both of which point toward a scheduling or workforce planning fix rather than a parts issue.
Materials-Heavy Cost Profile
A rising materials share often points toward emergency procurement premiums or a reliability problem driving repeat part replacement, which calls for a root-cause or sourcing fix rather than a staffing change.
Every budget cycle we'd get asked why our maintenance cost per MWh looked high compared to a published industry figure, and we didn't have a good way to explain that our plant cycles far more than the baseload fleet that number was probably drawn from. Now that we track both cost per MW and cost per MWh against a peer group that actually matches our dispatch pattern, those budget conversations go a lot faster and with a lot less friction.
What Plants Report After Adopting Normalized Cost Benchmarking
Frequently Asked Questions
Q: Where do the industry benchmark figures come from?
Benchmark comparisons draw from published industry maintenance cost data segmented by generation technology, fuel type, and typical dispatch pattern, so the comparison group can be matched as closely as possible to a specific plant's actual operating profile rather than relying on a single blended industry average. Reach out through Support Contact to discuss the specific benchmark segment relevant to your fleet.
Q: How often should these figures be recalculated?
Both metrics are tracked continuously and typically reviewed on a monthly or quarterly cadence aligned with budget reporting cycles, though trend reliability improves with a full year or more of data since seasonal generation patterns and planned outage timing can otherwise distort a shorter-window comparison.
Q: Can this be broken down by maintenance category, not just plant-wide?
Yes, cost per MW and cost per MWh can be segmented by maintenance category such as planned versus unplanned, or by major system such as turbine, boiler, and balance of plant, which is often more actionable for budget planning than a single plant-wide figure alone.
Q: Does this account for major planned outage years differently?
Yes, a major overhaul or planned outage year naturally produces a spike in both metrics, so the tracking distinguishes routine maintenance spend from major outage spend to avoid a single unusually high year distorting the ongoing trend line. Discuss your outage cycle during a Book a Demo session.
Q: How does this help justify a predictive maintenance investment?
A defensible cost baseline makes it possible to show a measurable before-and-after change in cost per MW or cost per MWh following a predictive maintenance initiative, which is generally a stronger argument for continued investment than an anecdotal claim of improved reliability without a normalized cost figure attached to it.
Walk Into Your Next Budget Review With A Number You Can Defend
iFactory tracks maintenance cost per MW and per MWh against a peer group matched to your plant's actual operating profile.