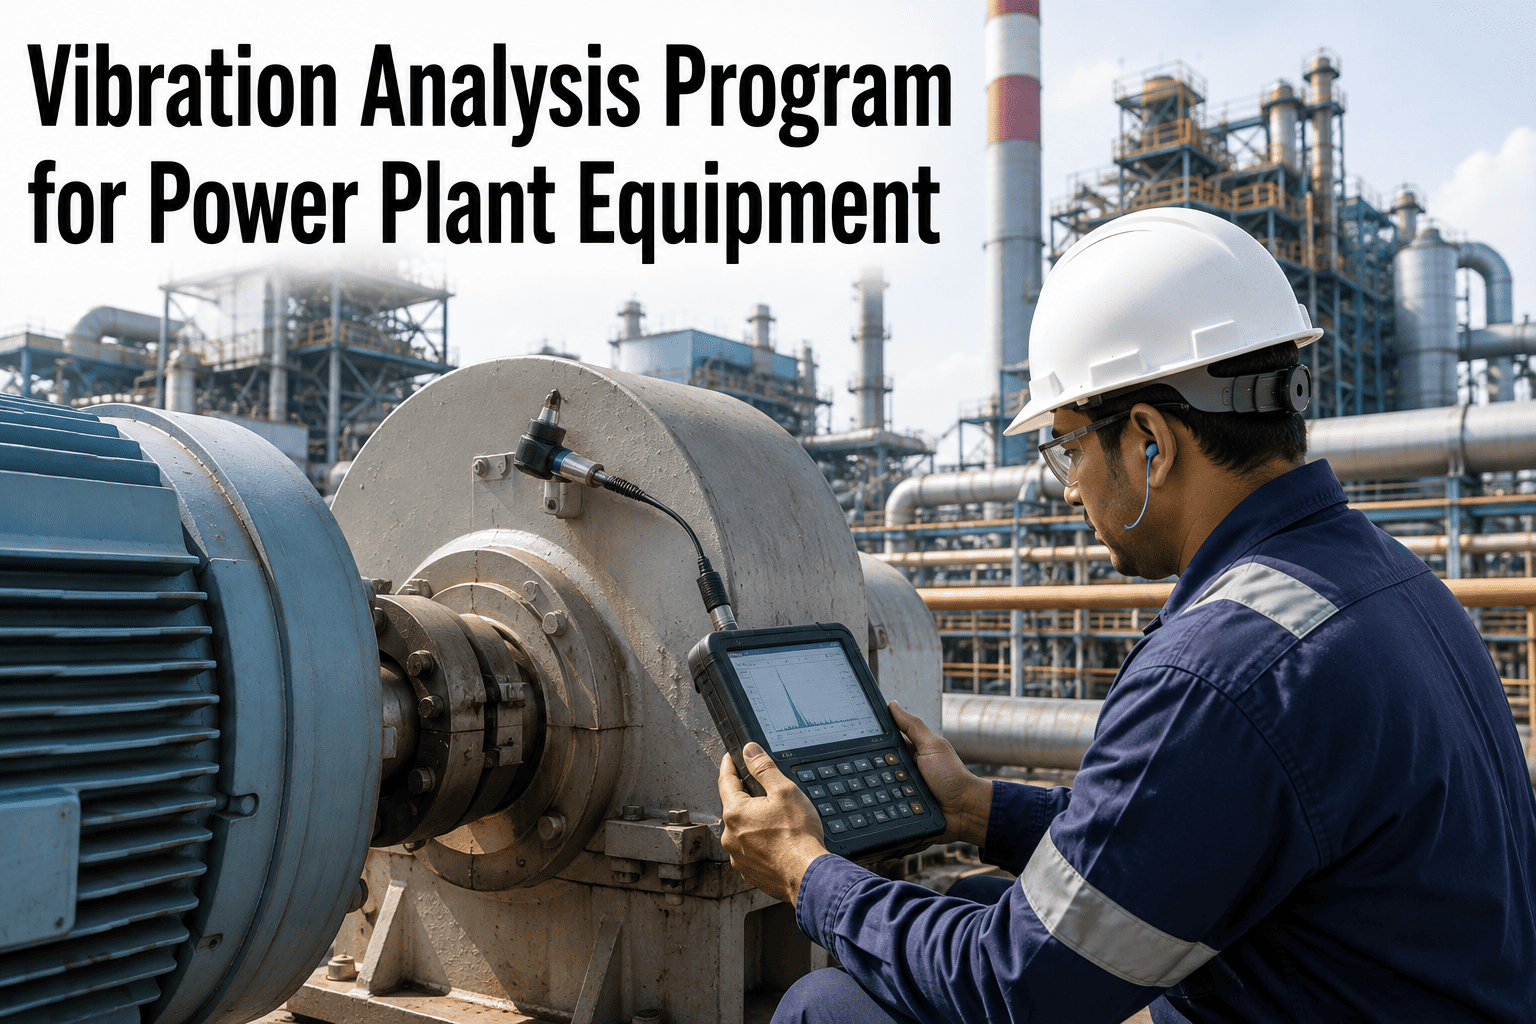
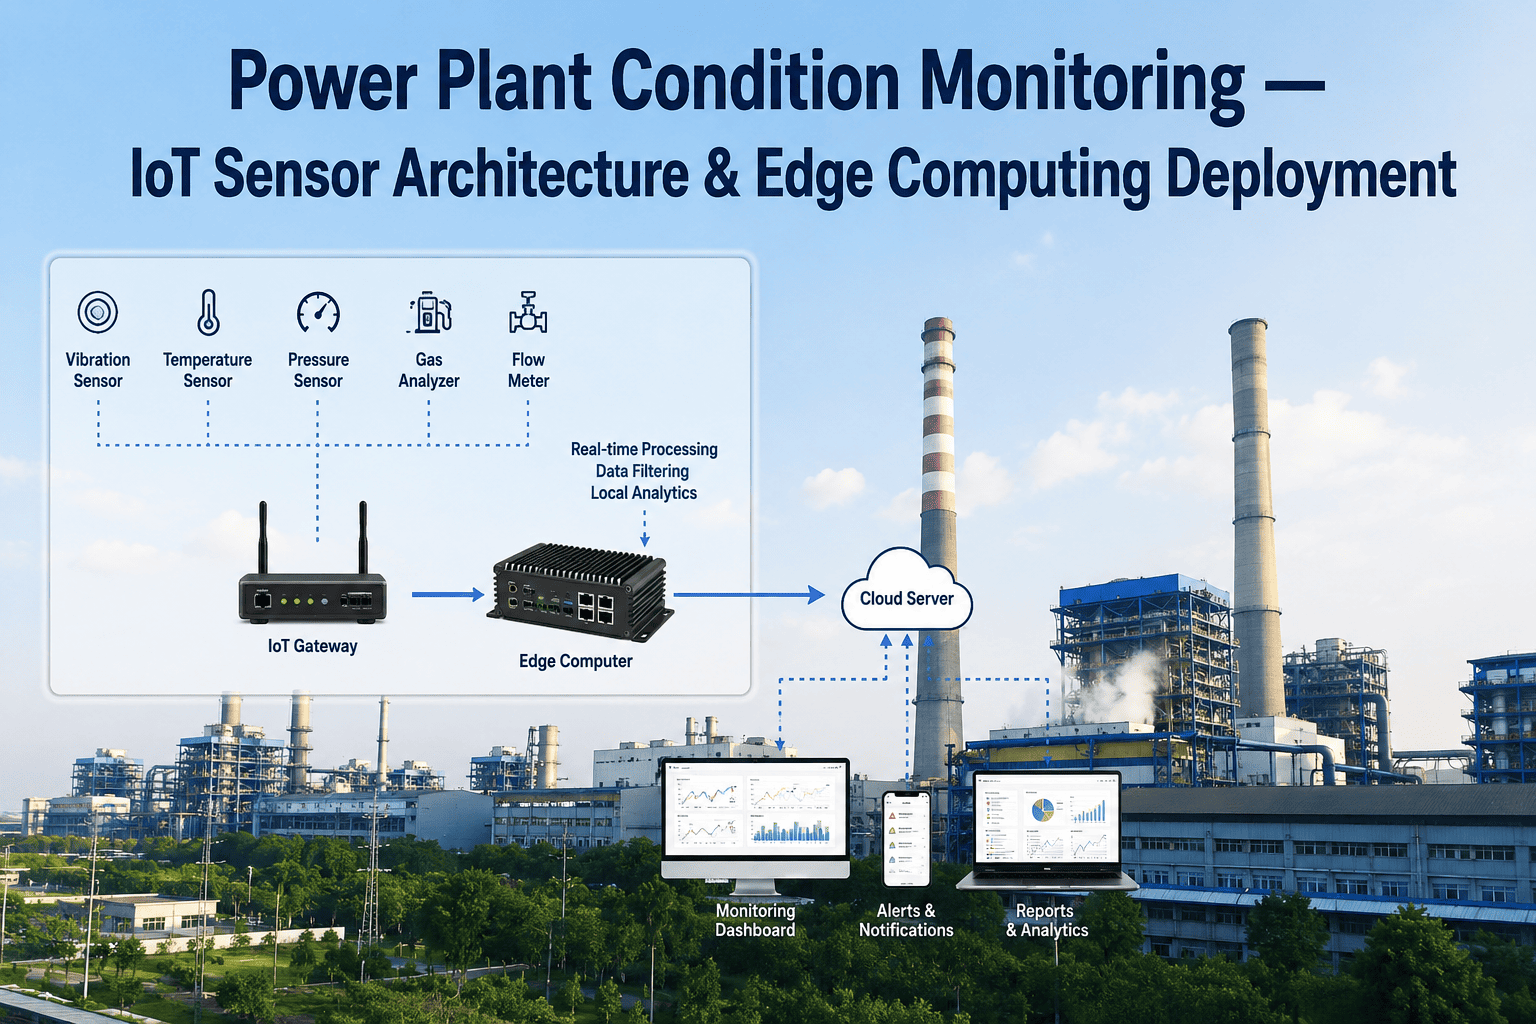
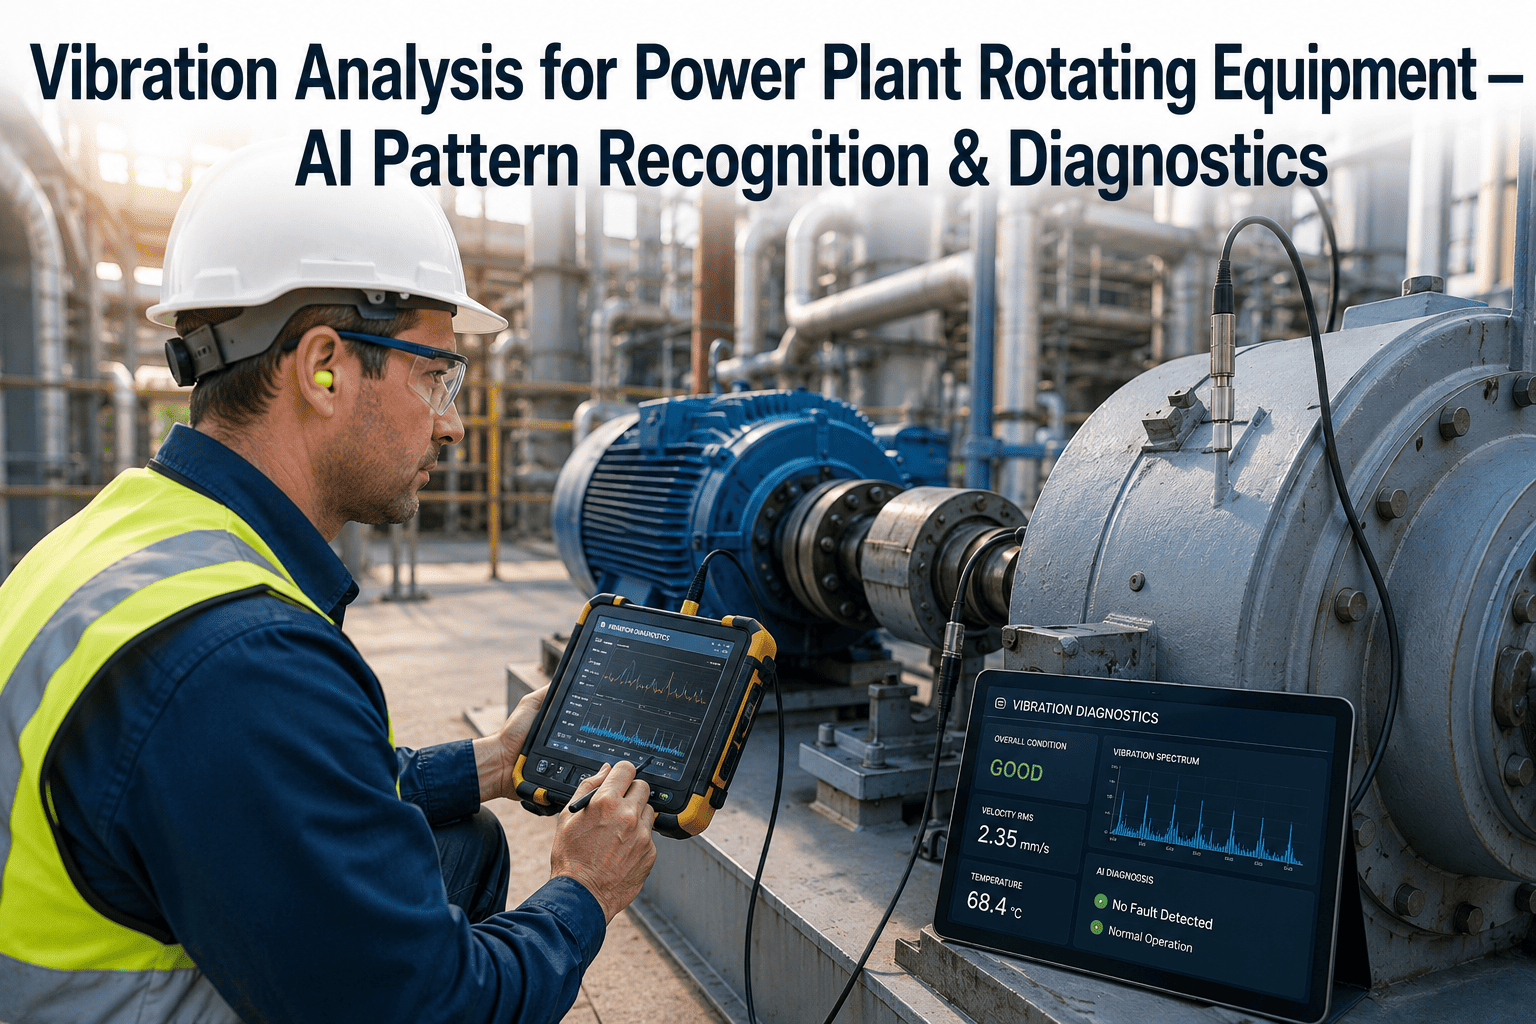
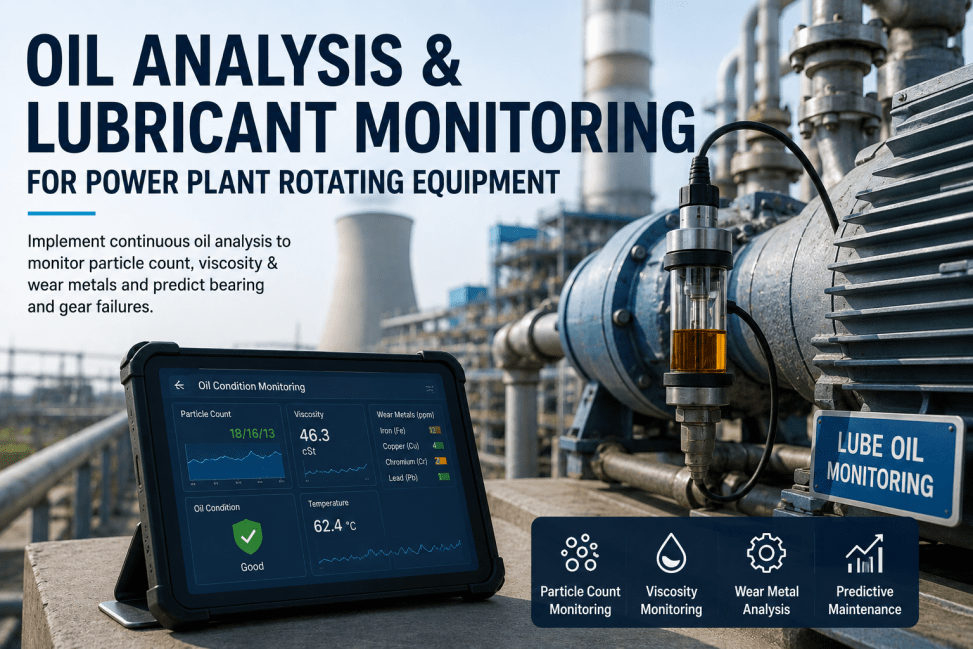
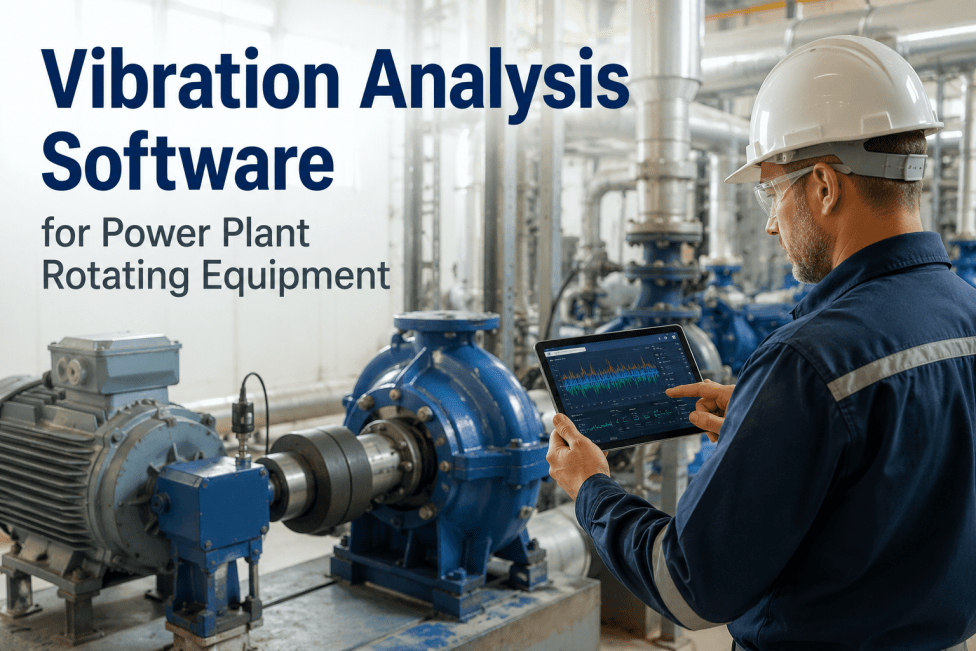
A vibration analysis program is not a set of sensors — it is a set of decisions. Which machines get measured. How often. Where on the machine the accelerometer sits. What alarm level triggers investigation. What frequency signature the analyst is looking for. Which analyst has the skill to distinguish a bearing defect from a misalignment when the two produce overlapping spectra. Get those decisions right and vibration monitoring becomes the earliest warning system a power plant has for rotating equipment failures; get them wrong and it becomes an expensive stream of false alarms that operations learns to ignore. Building the decisions correctly the first time is what separates programs that catch the boiler feed pump bearing three weeks before failure from programs that just document it after the fact. Reliability teams building or refreshing a program can Book a Demo to see how iFactory tracks routes, alarm thresholds, spectra, and analyst findings against every rotating asset in one system.
VIBRATION ANALYSIS · POWER PLANT ROTATING EQUIPMENT · ISO 10816 / 20816
Vibration Analysis Program for Power Plant Rotating Equipment
A working guide to building the program from scratch — route design for fans, pumps, motors, and turbines; alarm thresholds per ISO standard; analyst skill development; and the audit trail that proves the program is finding faults early.
4
ISO severity zones from Good to Damaging
7+
Fault signatures detectable from FFT spectrum
3–6
Weeks of typical early-warning lead time
The ISO 10816 / 20816 Severity Framework — Zones A Through D
Every vibration program on rotating equipment above 15 kW references the ISO 10816 severity zone framework (now superseded by ISO 20816-3:2022 for industrial machines, with ISO 20816-2 covering steam and gas turbines above 40 MW at synchronous speeds). The framework groups measured vibration velocity into four condition zones — A, B, C, and D — with numerical boundaries that vary by machine class and foundation type. What matters for program design is not memorizing the numbers, but understanding what each zone means operationally and what action each triggers.
New or newly commissioned machinery condition. No action required. Continue baseline monitoring cadence — typically monthly readings for critical assets, quarterly for less critical.
ACTION
Baseline monitoring only
Suitable for unrestricted long-term operation. Not "great" but not concerning. Trend the readings — the direction of change matters more than the absolute level within this zone.
ACTION
Continue trending closely
Unsuitable for continuous long-term operation. Machine can run for a limited period while corrective action is planned. Frequency-domain analysis is now required to identify fault mode.
ACTION
Diagnose and schedule repair
Vibration high enough to cause active damage. Continued operation risks failure of the machine, damage to connected equipment, and secondary consequences. Immediate intervention required.
ACTION
Stop or protect immediately
The Alarm and Trip setpoints most programs actually configure map directly to these zone boundaries: Alarm is typically set at the B/C boundary, and Trip at the C/D boundary. The exact numerical values depend on which ISO subpart applies to the machine class — ISO 20816-3 for general industrial machines above 15 kW, ISO 20816-5 for hydro power plant machine sets, ISO 20816-2 for large steam and gas turbines. Getting the correct subpart mapped to each asset class before configuring thresholds is one of the highest-leverage decisions in program setup. A boiler feed pump configured against turbine thresholds will alarm too late; a small motor configured against ISO 20816-2 turbine limits will never alarm at all because those limits allow vibration levels the small motor would never survive. The mapping from asset to standard is done once during program build and referenced against every threshold decision that follows.
Route Design: What Actually Goes on the Data Collector's Schedule
A vibration route is the sequence of measurement points the analyst walks with the data collector, in the order they walk them, on the frequency they walk them. Route design is where most programs either scale efficiently or bog down in unmaintainable spreadsheets. The design decisions below are what determine whether a two-technician program can cover a 500 MW plant on a defensible cadence or gets buried in the first six months.
DESIGN 01
Criticality-Based Asset Inclusion
Not every rotating asset makes it onto a vibration route. Include equipment where failure produces safety, environmental, or major availability impact — main and reserve feedwater pumps, forced-draft and induced-draft fans, coolant pumps, main lube-oil pumps, cooling-tower fans, critical motors above 15 kW driving those loads. Non-critical small motors get abbreviated coverage or run-to-failure strategy.
DESIGN 02
Measurement Points Per Asset
Standard convention: three orthogonal axes (horizontal, vertical, axial) at every accessible bearing housing. A driver-driven pair typically produces 12 measurement points — four bearing housings across the coupling, three axes each. Miss the axial reading and thrust-related faults go undetected; miss the coupling-side bearings and misalignment shows up late.
DESIGN 03
Route Grouping Logic
Group measurement points by physical proximity, not by asset type. A route that walks the analyst through one turbine hall in a coherent sequence takes half the time of a route that jumps geographically to keep all pumps together. Program efficiency at scale comes from route logistics, not from measurement speed.
DESIGN 04
Measurement Interval Selection
Monthly readings for Zone A/B assets on baseline monitoring; weekly for Zone C assets under diagnosis; daily or continuous online for Zone D or Zone C assets awaiting repair. Continuous online systems supplement route-based collection on the highest-criticality assets — main turbines, main generators, and any asset where a mid-month change would go undetected on route cadence.
DESIGN 05
Operating Condition Standardization
Every measurement is only valid at a consistent operating condition. Route records the load, speed, temperature, and process state at each collection. Variable-speed drives require multi-point measurement across the operating range because vibration signature shifts with speed. Missing operating context turns comparable readings into apparent trend noise.
Route design is not a one-time exercise. The best programs review route structure quarterly and modify it based on what the last quarter's data revealed — assets that consistently sat in Zone A get their cadence extended; assets that keep drifting into Zone B get shortened intervals; new equipment installations get added; decommissioned equipment gets removed. A route that never changes is a route that stopped tracking the actual plant condition. Programs that maintain routes as static documents also lose the ability to justify route decisions during audit — reliability leadership and regulators both ask why specific assets are on the cadence they are on, and a program that cannot answer that question from documented review cycles has a governance gap that shows up when it matters.
ROUTE MANAGEMENT · ALARM THRESHOLDS · TREND ANALYSIS
Hold the Whole Program in One System, Not Six Spreadsheets
iFactory ties every measurement point to the asset it belongs to, the ISO threshold that applies, the last reading trend, the analyst notes on file, and the work orders any Zone C or D finding has generated — one live record replacing the file-share sprawl every vibration program eventually accumulates.
Fault Signatures: What the FFT Spectrum Actually Tells the Analyst
Overall vibration velocity tells the analyst the severity of a problem. Frequency-domain analysis — the FFT spectrum — tells the analyst what the problem is. A machine at 0.3 in/s peak overall vibration could be running with unbalance, misalignment, bearing degradation, mechanical looseness, or several of these in combination. Distinguishing between them is what turns a vibration reading into a specific work order. The table below summarizes the frequency signatures that experienced analysts learn to recognize in the spectrum, with the practical caveat that most real machinery presents multiple signatures simultaneously rather than the clean textbook single-fault case.
The step that trips up new analysts is not identifying any single one of these signatures — most can be recognized after a few months of practice. The difficulty is distinguishing between fault modes that produce overlapping frequency content, or between real faults and measurement artifacts. A 1× RPM peak from unbalance and a 1× RPM peak from a bent shaft look similar in the spectrum; distinguishing them requires phase analysis, additional measurement points, or context from operating history. That interpretation gap is where analyst experience and mentorship structures matter more than the diagnostic tool. Programs that make the leap from Category II to Category III capability typically do so by pairing developing analysts with senior analysts on real plant findings, not by adding more training courses — pattern recognition on actual machinery is what builds the diagnostic instinct that turns a spectrum into a specific work order.
The Analyst Skill Ladder: How the Program's Diagnostic Capability Actually Grows
The equipment side of a vibration program is finite — buy the collectors, install the sensors, license the software. The analyst side is where the program either compounds capability over years or stays stuck at basic overall-level monitoring. The ISO 18436-2 certification framework recognizes four analyst categories, each with defined capability and typical training requirements. Understanding the ladder is what lets reliability leadership sequence the hiring, training, and mentorship investment that turns a monitoring program into a diagnostic program.
CAT IV
Advanced Diagnostic & Program Leadership
Runs complex root-cause analyses on machinery failures. Sets alarm thresholds for the plant. Trains and mentors lower categories. Handles modal analysis, ODS studies, and torsional vibration problems that require specialized instrumentation.
CAT III
Advanced Fault Diagnosis & Corrective Action
Reads and interprets time waveforms, phase measurements, and orbit plots. Recommends specific corrective actions. Handles bearing defect analysis, resonance identification, and multi-fault machinery diagnostics.
CAT II
Basic Fault Diagnosis & Spectrum Analysis
Reads FFT spectra and identifies common fault modes — unbalance, misalignment, looseness, basic bearing issues. Confirms Zone C findings and diagnoses fault type. Can execute simple field balancing on straightforward machinery.
CAT I
Data Collection & Overall-Level Monitoring
Collects vibration measurements along assigned routes, uploads to database, flags overall-level exceedances against pre-configured thresholds. Recognizes when a reading falls outside acceptable zones and escalates to Category II or above.
Programs that plateau typically do so because they have Category I collection capacity but no path to Category II diagnostic capability — either because no in-house analyst was ever trained above Category I or because the Category II analyst who existed left and was not replaced. The most common recovery pattern is contracting Category III or IV consulting time for specific findings while investing in growing internal Category II capacity, and treating the analyst ladder as a career development framework rather than a certification checkbox. Programs that get analyst development right consistently outperform programs with better instruments and worse people, because the diagnostic gap is where value gets created — a Category I collector with a perfect data set who cannot interpret it produces less operational value than a Category II analyst with less data who can convert it into specific work orders.
Common Rotating Assets: What the Program Actually Watches
Power plants share a similar rotating asset base regardless of fuel type — the specific equipment changes but the vibration monitoring priorities are consistent. The list below is the reference asset population most utility-scale programs cover, with the typical failure modes vibration monitoring is meant to catch. Sequencing the initial program build across these asset classes is where most programs succeed or fail: starting with the highest-criticality and best-instrumented equipment establishes early wins that justify continued program investment, while starting with hard-to-access low-value assets produces early frustration that stalls the buildout before it reaches the assets that would have produced the ROI. Reliability leadership sequencing decisions during the first six months typically determine whether the program reaches steady-state coverage inside two years or drifts indefinitely.
01
Steam & Gas Turbines
Blade fatigue, bearing distress, rotor rub, misalignment, thermal bow. Large turbines above 40 MW require ISO 20816-2 evaluation with tighter thresholds than ISO 20816-3 general limits, plus proximity-probe shaft vibration monitoring in addition to bearing-housing readings.
02
Boiler Feed Pumps
High-pressure, high-speed multistage pumps where failure produces immediate unit derate. Cavitation damage, seal degradation, bearing wear, and hydraulic instability all produce characteristic vibration signatures detectable weeks before mechanical failure.
03
Forced & Induced Draft Fans
Large fans where blade fouling, erosion, and imbalance are dominant issues. Blade-pass frequency analysis catches localized damage; overall-level trending catches accumulating imbalance from fly-ash buildup on ID fan blades over months.
04
Main & Auxiliary Motors
Electrical faults — broken rotor bars, stator issues, eccentricity — plus mechanical bearing and misalignment issues on the driven load side. Line-frequency analysis distinguishes electrical from mechanical fault origins on the same motor.
05
Cooling Water Pumps
Large vertical or horizontal pumps in cooling loops. Cavitation, impeller wear, and shaft alignment issues drive most detected faults. ISO 10816-7 provides the specific rotodynamic-pump evaluation framework for this class.
06
Cooling Tower Fans
Slow-speed, large-diameter fans where gearbox condition dominates failure risk. Gear-mesh frequency analysis and bearing-defect frequency monitoring in the gearbox are typically higher-value than the fan-shaft measurements themselves.
Frequently Asked Questions: Building the Vibration Analysis Program
Should our alarm thresholds come from ISO 10816 or ISO 20816?
ISO 20816-3 (2022) is the current standard and supersedes ISO 10816-3 for general industrial rotating equipment above 15 kW. New program builds should reference ISO 20816-3, ISO 20816-5 for hydro plant machine sets, ISO 20816-2 for large steam and gas turbines above 40 MW, and ISO 10816-7 for rotodynamic pumps until its ISO 20816 replacement is issued. Programs currently configured to ISO 10816 thresholds should plan a controlled transition to ISO 20816 rather than a sudden switch, because some threshold values differ and revised limits may retrigger alarms on assets that had been sitting stable. Teams planning that transition can
Book a Demo to see how iFactory handles the threshold migration.
How much lead time should we realistically expect before a bearing failure?
Rolling-element bearing degradation typically progresses through distinguishable stages visible in the FFT spectrum, giving vibration programs measurable lead time before mechanical failure. Early-stage defects appear as low-amplitude peaks at bearing-specific defect frequencies (BPFO, BPFI, BSF, FTF), progressing through modulation sideband development and eventual rise in overall vibration level. The practical lead time from earliest reliable detection to failure ranges from several weeks to several months depending on operating load, lubrication condition, and defect location — long enough to plan a controlled outage rather than react to an unplanned one. Programs measuring monthly should capture that window; programs measuring quarterly on high-criticality assets may miss the earliest stages.
Do we need continuous online monitoring, or is route-based collection sufficient?
Both, applied to different asset classes. Route-based portable collection covers the broad rotating asset population where monthly or quarterly sampling captures degradation trends adequately — most fans, motors, and secondary pumps fall here. Continuous online monitoring is warranted on the highest-criticality assets where a mid-interval failure would cause major loss — main turbines, main generators, main boiler feed pumps, and any asset where regulatory or availability requirements demand continuous protection. The right architecture combines both, with online systems providing 24/7 protection on the top-tier assets and route-based collection extending coverage across the broader population.
How do we set alarm thresholds when ISO tables do not exactly match our machine?
ISO thresholds are starting points, not final answers. The recommended practice is to use ISO values as the initial alarm and trip setpoints, then refine them based on statistical analysis of your specific asset's baseline vibration history. If a healthy asset consistently reads well below the ISO Zone B/C boundary, tightening the alarm to reflect actual baseline plus a defined margin catches drift earlier than the ISO threshold would. Machines that operate above ISO limits due to design or installation constraints — some large boiler ID fans, certain cooling tower fans — need customized thresholds documented against manufacturer guidance and OEM acceptance criteria rather than being forced into ISO categories they were never designed for.
What is the fastest way to build analyst capability internally?
Combine formal training against the ISO 18436-2 category framework with structured mentorship on the plant's actual machinery. Category I certification typically requires around 40 hours of training and demonstrated field competency; Category II adds spectrum analysis and diagnostic skills built on top of the Category I foundation. The mentorship layer is what differentiates programs that produce genuinely diagnostic analysts from programs that produce certificate holders — pairing developing analysts with a Category III or IV mentor on real plant findings for at least the first year builds pattern recognition that classroom training cannot deliver. Teams planning a training and mentorship structure can contact
iFactory Support for program design guidance.
VIBRATION PROGRAM · ROUTE MANAGEMENT · ANALYST DIAGNOSTICS
Turn Vibration Data Collection Into Vibration-Driven Maintenance Strategy
iFactory holds route schedules, ISO-based thresholds, trend history, analyst findings, and derived work orders in one connected record — so every reading collected feeds a maintenance decision rather than filling a spreadsheet nobody opens after collection day.