In the high-stakes environment of modern power generation, unplanned downtime is not merely an inconvenience but a catastrophic financial and operational event. The transition from reactive maintenance to a proactive, data-driven paradigm hinges on the strategic deployment of an IoT sensor architecture coupled with robust edge computing capabilities. This comprehensive guide serves as an enterprise blueprint for maintenance managers and plant engineers seeking to design a condition monitoring system that delivers real-time, actionable intelligence on turbines, generators, and balance-of-plant (BOP) equipment. We delve into the technical nuances of sensor selection, network topology, edge analytics, and system integration, ensuring your power plant achieves unparalleled operational reliability. By the end of this deep-dive, you will possess the knowledge to architect a monitoring solution that not only predicts failures but optimizes overall equipment effectiveness (OEE). For a personalized consultation on implementing these strategies at your facility, Book a Demo with our industry experts.
Transform Your Maintenance Strategy Today
Unlock the power of predictive analytics and reduce downtime by up to 40%. Our experts will design a custom IoT sensor architecture for your plant.
Real-Time Vibration Analysis
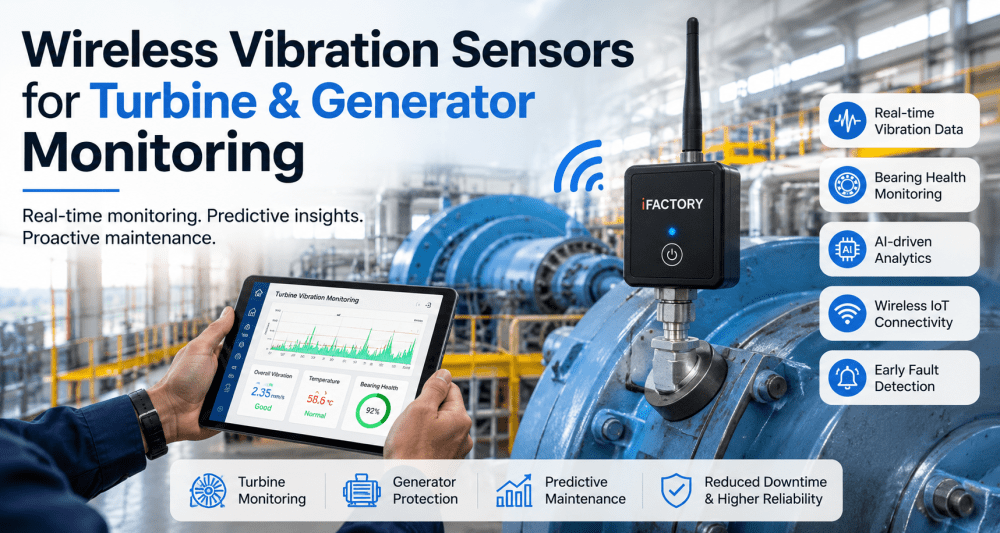
Deploy high-frequency accelerometers on turbine bearings and generator shafts to capture early signs of imbalance, misalignment, or bearing degradation. Edge processors apply FFT algorithms to reduce data volume while preserving critical fault signatures.
Thermal Imaging Integration
Infrared thermography sensors monitor electrical connections, transformer hotspots, and boiler tube temperatures. Combined with ambient temperature data, these inputs feed thermal models that predict insulation failure or refractory wear.
Acoustic Emission Monitoring
Ultrasonic microphones detect high-frequency stress waves from crack propagation in pressure vessels and steam lines. Edge-based pattern recognition distinguishes between benign operational noise and critical structural anomalies.
Architecting the Sensor Network: From Physical Layer to Edge Node
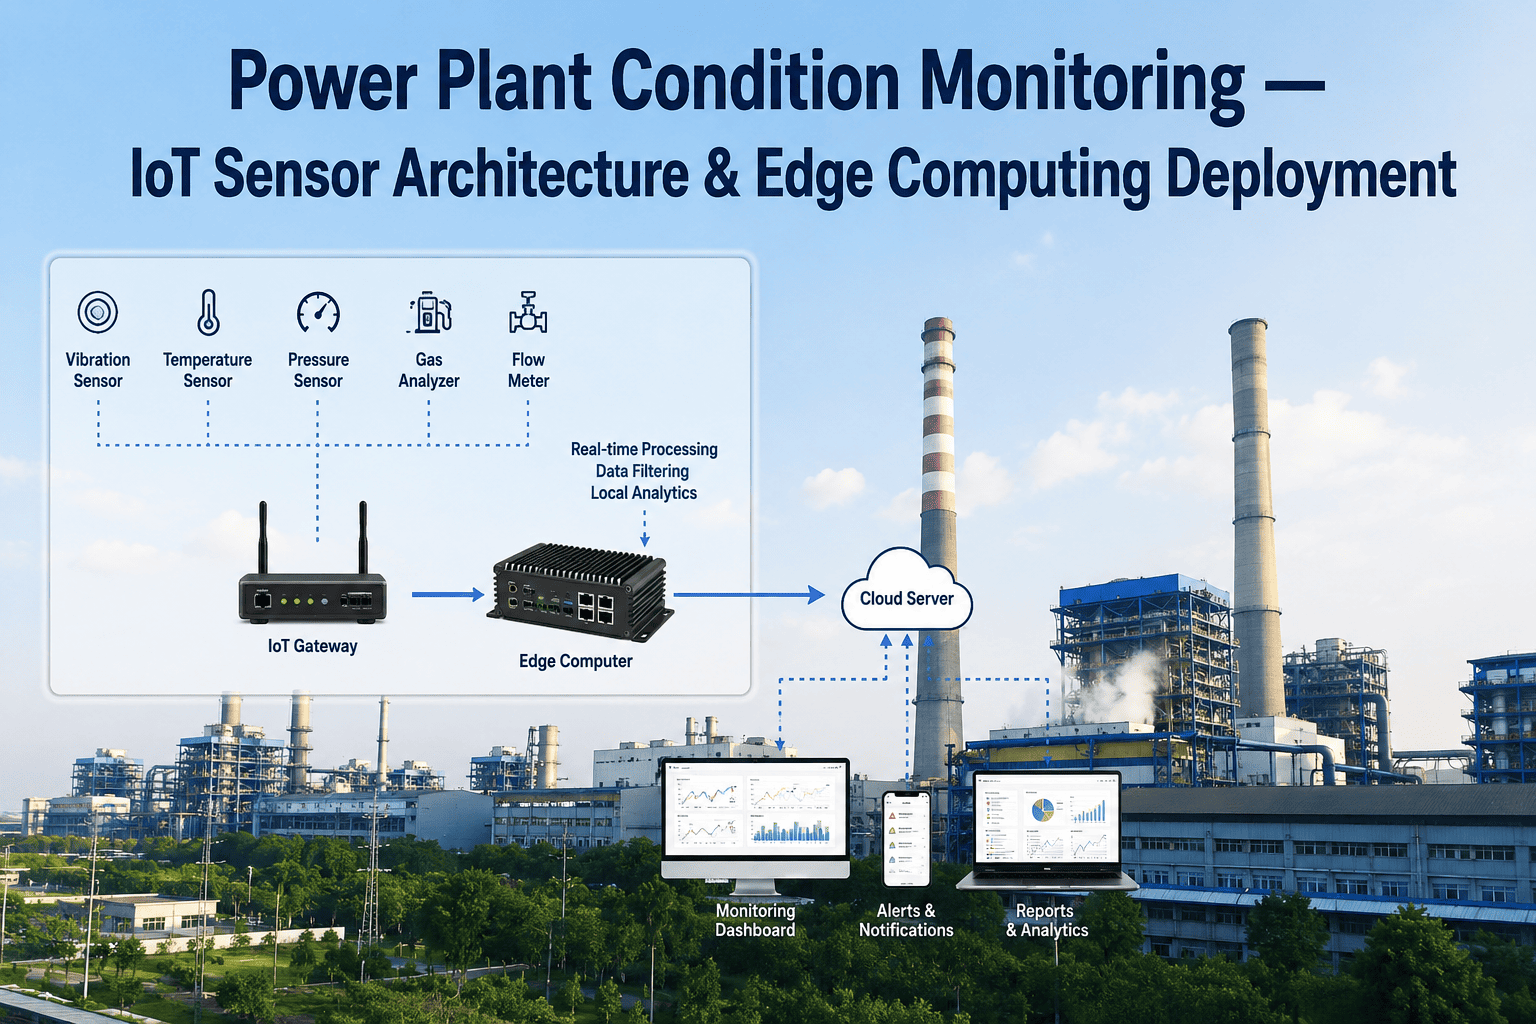
The foundation of any condition monitoring system is the physical deployment of sensors. For a typical combined-cycle gas turbine (CCGT) plant, a minimum of 200 to 500 sensors are required to cover critical assets. Vibration sensors should be placed on each bearing housing (radial and thrust), with tri-axial accelerometers preferred for capturing multi-directional vibration data. Temperature sensors (RTDs and thermocouples) must be installed at lube oil return lines, cooling water inlets, and generator stator windings. Pressure transducers are essential for monitoring hydraulic systems, fuel gas supply, and steam turbine extraction points.
Edge computing nodes, typically industrial-grade gateways with local processing capabilities, aggregate data from a cluster of sensors (e.g., one gateway per turbine). These nodes perform initial data validation, time-stamping, and compression before transmitting only relevant features to the central analytics platform. This hierarchical architecture minimizes bandwidth usage and ensures that even if the central server is unreachable, local anomaly detection continues uninterrupted. The edge nodes must be ruggedized to withstand ambient temperatures up to 70°C and high electromagnetic interference (EMI) common in turbine halls.
Sensor Selection Matrix for Power Plant Assets
| Asset Type | Vibration Sensor | Temperature Sensor | Pressure Sensor | Acoustic Sensor |
|---|---|---|---|---|
| Gas Turbine | Tri-axial IEPE accelerometer, 10 kHz bandwidth | Type K thermocouple, 0-1200°C | Strain-gauge, 0-500 bar | Ultrasonic microphone, 20-100 kHz |
| Steam Turbine | Eddy-current proximity probe, 0-5 mm range | RTD PT100, -50-600°C | Piezoresistive, 0-300 bar | High-temp acoustic emission, 50-500 kHz |
| Generator | Low-frequency accelerometer, 0.5 Hz-1 kHz | Thermistor, 0-200°C (winding) | Differential pressure, 0-10 bar (H2) | Partial discharge ultrasonic, 40-300 kHz |
| Boiler | High-temp accelerometer, 0-500°C | Thermocouple array, 0-1600°C | Draft pressure, ±500 Pa | Acoustic leak detector, 1-10 kHz |
| BOP (Pumps, Fans) | Single-axis accelerometer, 0-5 kHz | RTD PT100, -50-250°C | Gauge pressure, 0-50 bar | Not typically required |
Step-by-Step Deployment Timeline for a 500 MW Plant
Site Survey & Criticality Assessment (Week 1-2)
Conduct a physical walkdown to identify all rotating equipment, electrical cabinets, and pressure vessels. Use a risk-based matrix to prioritize assets based on failure impact and historical MTBF. Define sensor count and types for each zone.
Network Infrastructure Design (Week 3-4)
Plan the cabling routes for power and data, ensuring separation from high-voltage lines. Specify industrial Ethernet switches with ring topology for redundancy. Determine edge gateway locations, typically one per major asset island (turbine hall, boiler house, cooling tower).
Sensor Installation & Calibration (Week 5-8)
Mount vibration sensors using studs or magnetic bases on bearing housings. Install thermocouples in thermowells for temperature measurement. Calibrate each sensor using NIST-traceable standards and record baseline readings during normal operation.
Edge Node Configuration & Analytics (Week 9-10)
Program edge gateways with data acquisition rates (e.g., 10 kHz for vibration, 1 Hz for temperature). Implement local FFT and statistical feature extraction (RMS, crest factor, kurtosis). Set up communication protocols (MQTT, OPC UA) to stream features to the central server.
System Integration & Dashboard Deployment (Week 11-12)
Connect edge nodes to the iFactory platform for unified visualization. Configure alarm thresholds based on ISO 10816 vibration severity charts. Train operators on dashboard interpretation and response workflows. Go-live with a 30-day parallel run against existing systems.
Ready to Deploy Your Sensor Architecture?
Get a customized deployment plan tailored to your plant's assets and budget. Our engineers will guide you from site survey to full operational readiness.
Edge Analytics: Transforming Raw Data into Predictive Insights
Edge nodes compute velocity spectra (mm/s) for each bearing. The system tracks ISO zones: Good (0-1.8 mm/s), Satisfactory (1.8-4.5 mm/s), Unsatisfactory (4.5-11.2 mm/s), and Unacceptable (>11.2 mm/s). Alarms trigger when trends cross thresholds over 3 consecutive readings.
Rate-of-change calculations for boiler tube temperatures. A gradient exceeding 5°C per minute indicates potential slag buildup or tube blockage. The edge gateway generates an immediate alert, allowing operators to adjust sootblowers or fuel mix before a tube rupture occurs.
Machine learning models at the edge classify acoustic signatures into normal operation, steam leak, valve chatter, or crack propagation. The model is trained on historical failure data and updated periodically via over-the-air updates from the central server.
High-speed pressure sampling (1 kHz) captures water hammer events in feedwater lines. The edge node calculates pressure spike magnitude and duration, comparing against pipe material limits. Early detection prevents catastrophic pipe bursts and reduces repair costs.
Implementation Checklist for Maintenance Managers
- Define criticality matrix for all plant assets based on failure impact and repair cost.
- Select sensor types and quantities using the sensor selection matrix above.
- Design network topology with redundant edge gateways and failover paths.
- Install sensors with proper mounting techniques (stud, magnetic, adhesive) per manufacturer specs.
- Calibrate all sensors and establish baseline operating signatures.
- Configure edge analytics algorithms for vibration, temperature, pressure, and acoustics.
- Set alarm thresholds using industry standards (ISO 10816, API 670).
- Integrate edge nodes with central platform via OPC UA or MQTT.
- Train maintenance team on dashboard interpretation and response procedures.
- Run parallel operation for 30 days to validate system accuracy.
- Establish a continuous improvement cycle for model retraining and sensor recalibration.
Frequently Asked Questions
What is the typical ROI timeline for a condition monitoring system in a power plant?
The return on investment for a comprehensive IoT sensor architecture and edge computing deployment is typically realized within 12 to 18 months. This is driven by a 30-40% reduction in unplanned downtime, optimized maintenance scheduling, and extended asset life. For example, a 500 MW coal plant can save over $2 million annually by avoiding just one major forced outage. The initial capital expenditure for sensors, gateways, and installation is often offset by insurance premium reductions and improved plant efficiency. To calculate the exact ROI for your facility, Book a Demo with our financial analysts who will provide a detailed cost-benefit analysis.
How does edge computing improve the reliability of condition monitoring compared to cloud-only solutions?
Edge computing ensures that critical analytics continue to function even when the internet connection is lost, which is common in remote or harsh plant environments. By processing data locally, edge nodes can detect anomalies and trigger alarms within milliseconds, whereas cloud-only systems suffer from latency due to data transmission. Furthermore, edge computing reduces bandwidth costs by transmitting only 1-5% of the raw sensor data (i.e., extracted features) to the cloud. This architecture also enhances data security by keeping sensitive operational data on-premises. For a deeper technical discussion on edge vs. cloud trade-offs, contact our support team for a whitepaper on hybrid architectures.
What are the most common mistakes when deploying vibration sensors on turbines?
The most frequent errors include improper mounting (e.g., using adhesive on a curved surface instead of a stud), incorrect sensor orientation (single-axis sensor aligned with the wrong axis), and insufficient sampling frequency. For gas turbines, tri-axial accelerometers with a bandwidth of at least 10 kHz are essential to capture high-frequency blade pass tones. Another common mistake is placing sensors too far from the bearing housing, which attenuates the vibration signal. Additionally, failing to calibrate sensors after installation leads to baseline drift. To avoid these pitfalls, follow the guidelines in our sensor installation best practices guide.
How many edge gateways are needed for a typical combined-cycle power plant?
For a 2x1 combined-cycle plant (two gas turbines, one steam turbine, one generator), we recommend a minimum of 4 edge gateways: one per gas turbine, one for the steam turbine and generator, and one for the balance-of-plant (cooling towers, pumps, compressors). Each gateway can handle up to 100 sensor inputs, depending on the sampling rate. For example, a gateway monitoring a gas turbine with 80 sensors (vibration, temperature, pressure) sampling at 10 kHz will require a processor with at least 4 cores and 8 GB RAM. Our Book a Demo includes a free network topology consultation to determine the optimal number of gateways for your plant.
Can the system integrate with existing DCS or SCADA platforms?
Yes, the iFactory condition monitoring platform supports standard industrial protocols such as OPC UA, Modbus TCP, and MQTT for seamless integration with existing Distributed Control Systems (DCS) and SCADA. The edge gateways can be configured to output data in a format compatible with your current historian (e.g., OSIsoft PI, GE Proficy). This allows operators to view condition monitoring alarms directly on their existing HMI screens. For a step-by-step integration guide, contact our integration team who will provide a compatibility checklist and API documentation.
Begin Your Predictive Maintenance Journey Now
Take the first step toward zero unplanned downtime with a tailored IoT sensor architecture. Our experts are ready to design, deploy, and support your system from day one.