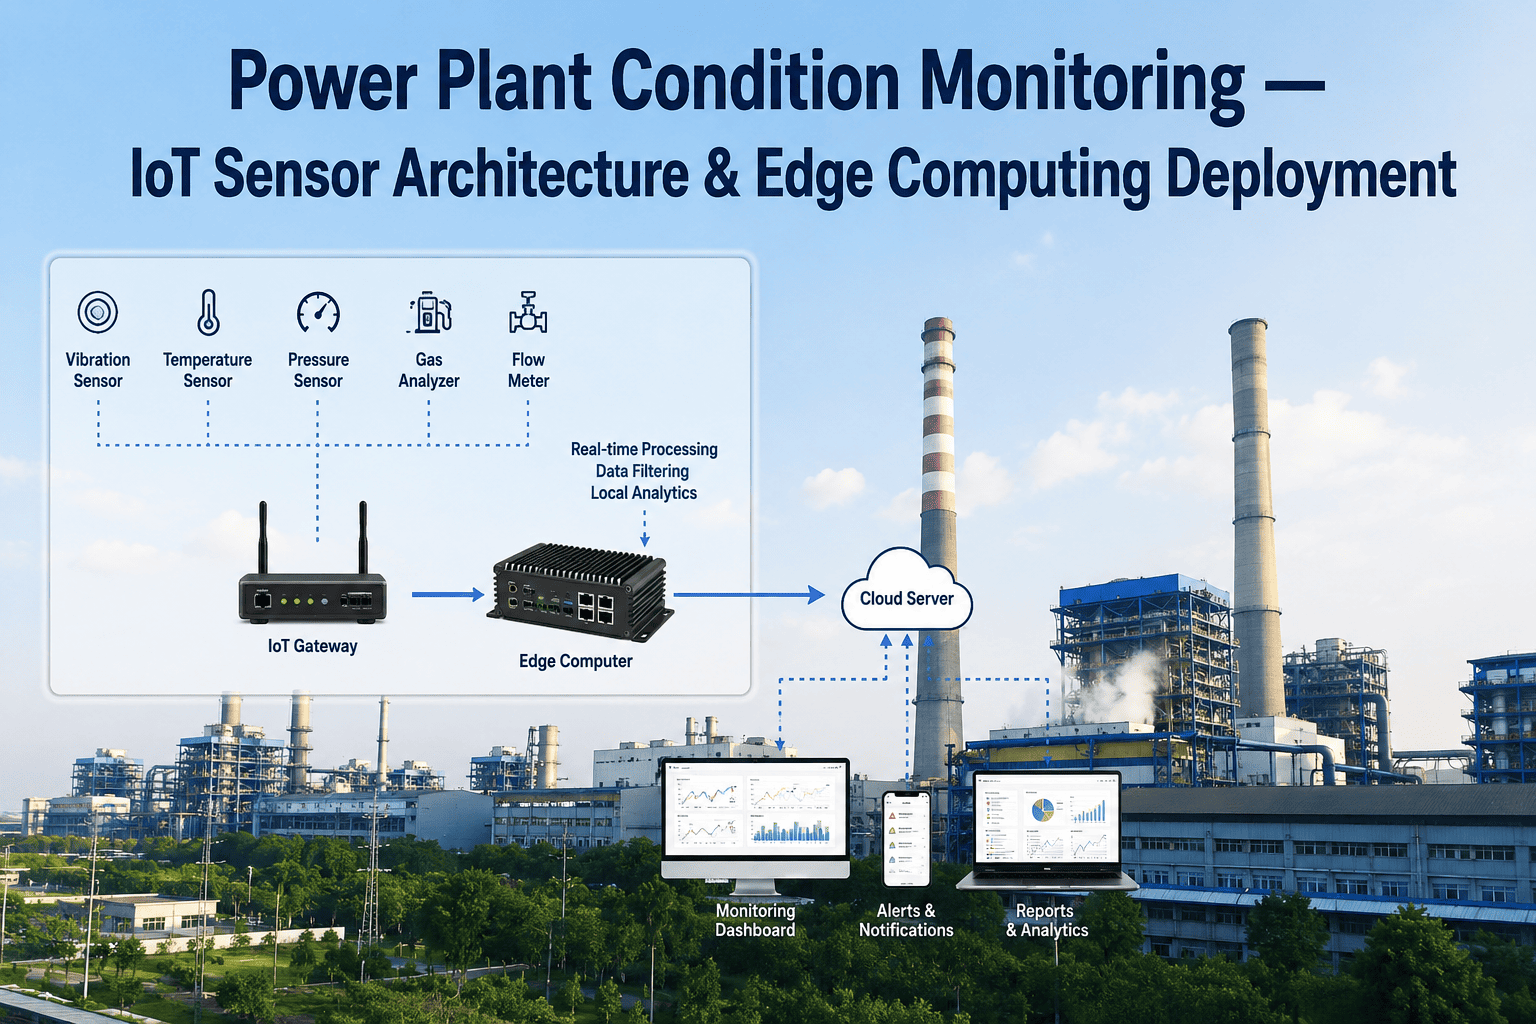
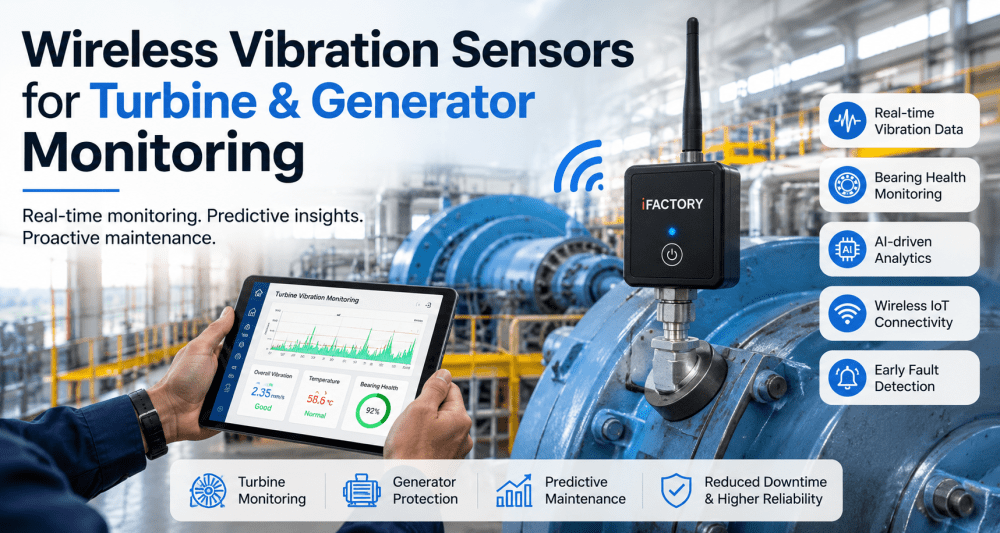
Power plant predictive analytics is only as effective as the sensor data that feeds it. A gas turbine prognostics model trained on 3-second-interval vibration data from a single bearing housing accelerometer will never detect blade tip timing anomalies that require high-frequency dynamic pressure sensors sampling at 50 kHz.This guide provides the sensor selection framework that power plant reliability teams need to make those decisions, organized by asset class, failure mode, and deployment priority. Book a Demo to see how iFactory's sensor integration specialists match analytics requirements to sensor specifications across your power plant asset fleet.
Why Smart Sensor Selection Determines the Success of Power Plant Predictive Analytics
The most common failure pattern in power plant analytics deployments is not algorithm accuracy — it is sensor-data appropriateness. A facility installs 200 wireless vibration sensors on balance-of-plant pumps and fans, connects them to a cloud analytics platform, and discovers within 60 days that 90% of the generated alerts are false positives caused by the sensors' inadequate sampling rate for the subtle high-frequency bearing defect signatures that precede failure by weeks. The sensors were correct for the asset class — rotating equipment — but incorrect for the failure mode they were expected to detect. The investment was real. The predictiveness was absent.
The selection framework that prevents this outcome has four dimensions: failure mode physics (what measurable parameter degrades before failure), asset operating environment (temperature range, vibration levels, contaminant exposure, ATEX classification), data acquisition requirements (sampling rate, dynamic range, communication protocol, power availability), and analytics integration (model input requirements, data quality thresholds, historian compatibility).
Smart Sensor Types and Applications Across Power Plant Asset Classes
Power plant predictive analytics requires four primary sensor categories — vibration, temperature, acoustic, and electrical — each with multiple technology variants optimized for specific failure mode detection. The following tabbed guide maps each sensor category to the power plant assets and failure modes where it delivers the highest predictive value.Book a Demo
Vibration Sensors for Rotating Equipment Monitoring
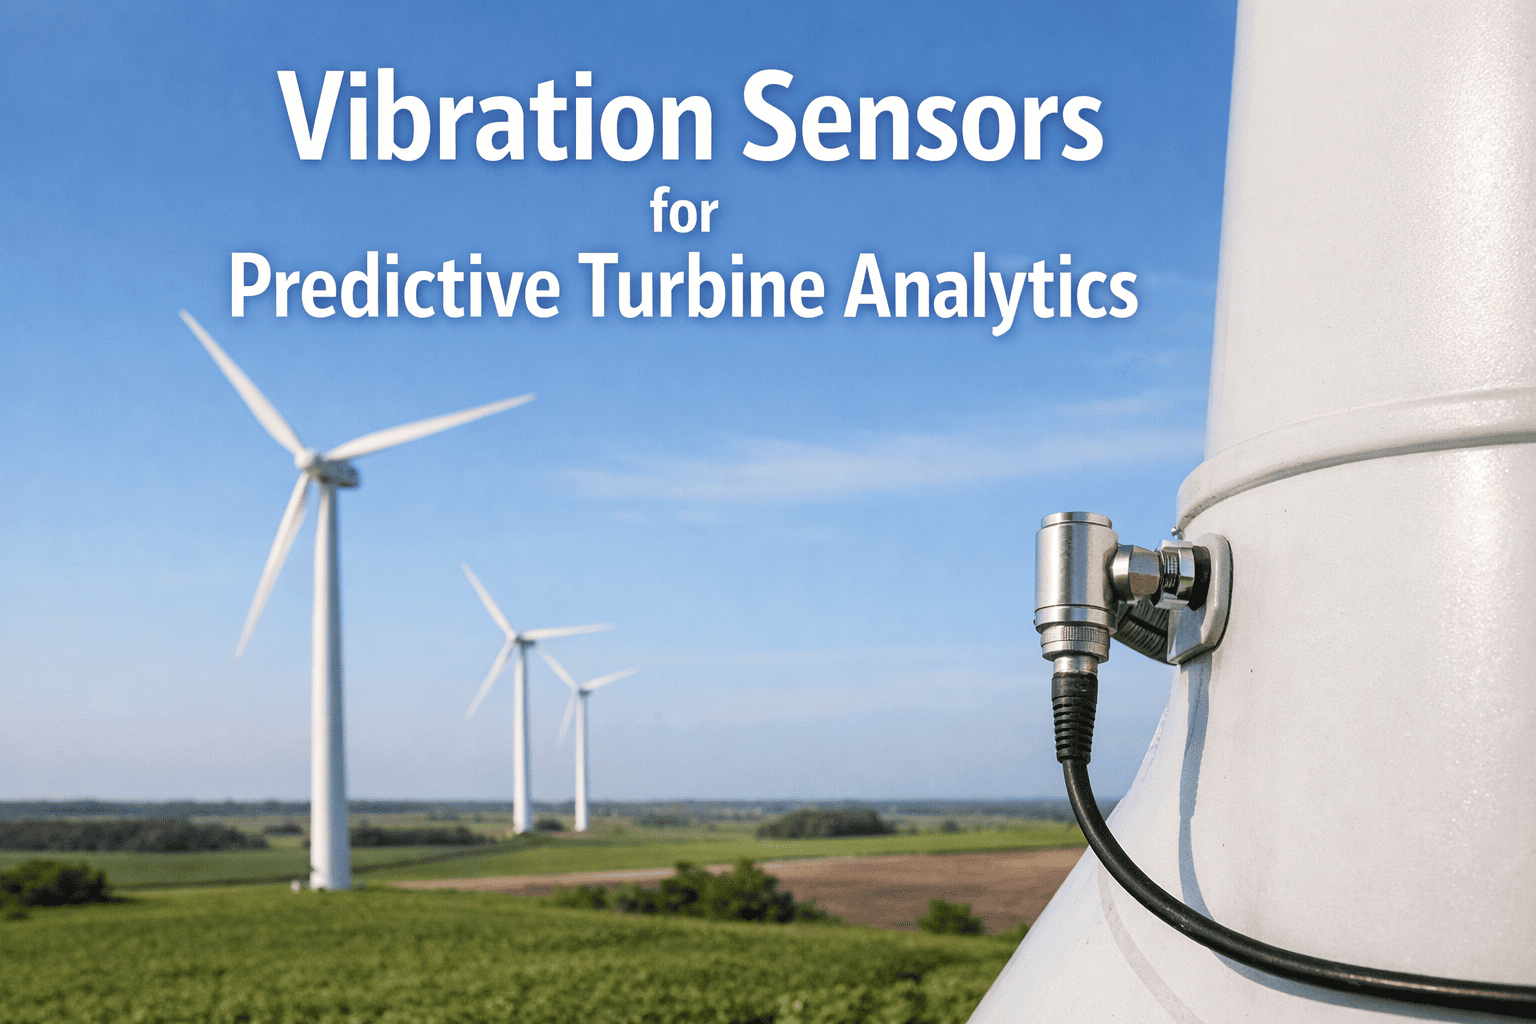
Vibration monitoring is the most widely deployed predictive sensor technology in power plants, but the selection between accelerometer types — piezoelectric vs. MEMS, ICP vs. charge-mode, single-axis vs. triaxial, standard-frequency vs. high-frequency — determines which failure modes are detectable. Gas turbine bearing degradation, pump cavitation, generator rotor bar defects, and cooling fan imbalance each produce vibration signatures at different frequency ranges, amplitudes, and modulation patterns that require different sensor specifications to capture.
Temperature Sensors for Thermal Process and Insulation Monitoring
Temperature monitoring spans the widest range of sensor technologies and deployment configurations in power plant predictive analytics — from RTDs embedded in generator stator windings to infrared pyrometers monitoring HRSG tube metal temperatures to fiber-optic distributed temperature sensing along steam lines. The selection depends on temperature range, response time, environmental exposure, and the specific thermal degradation mechanism being monitored.
Acoustic and Ultrasonic Sensors for Leak and Discharge Detection
Acoustic emission and ultrasonic sensors detect failure modes that vibration and temperature sensors cannot — airborne ultrasound from compressed gas leaks, structure-borne acoustic emissions from crack propagation in pressure vessels and steam lines, partial discharge activity in transformer insulation systems, and steam trap failures that waste energy and degrade system efficiency. These sensors measure in the 20 kHz to 1 MHz range, above the frequency band of conventional vibration monitoring.
Electrical Sensors for Generator, Transformer, and Power System Monitoring
Electrical parameter monitoring provides direct measurement of the degradation mechanisms that mechanical sensors detect only indirectly. Generator rotor winding shorts, transformer insulation paper degradation, breaker contact wear, and cable insulation deterioration all produce characteristic electrical signatures — changes in current harmonic content, partial discharge activity, dissolved gas concentrations, and circuit breaker trip coil current profiles — that precede failure by intervals ranging from hours to months depending on the asset and degradation rate.
Sensor Selection Framework: Matching Sensor Technology to Asset Class and Failure Mode
The selection process for power plant predictive analytics sensors follows a structured five-stage framework that maps failure mode physics to sensor specifications, data acquisition requirements, and analytics model inputs. Applying this framework at the deployment planning stage eliminates the most common cause of analytics underperformance — sensor selection based on availability rather than suitability.
Sensor Deployment ROI: Cost vs. Value by Application
The economic case for each sensor deployment must be evaluated against the specific failure modes it is expected to detect and the cost of unplanned events that those failures would otherwise cause. The following cost-impact analysis maps the sensor investment against avoided outage costs for the four highest-value power plant sensor applications. A sensor that costs $2,000 installed but prevents one $250,000 forced outage event every 18 months delivers a 14:1 annual ROI. A sensor that costs $200 but detects nothing actionable delivers negative ROI regardless of how inexpensive it was.<Book a Demo/p>
- Sensor investment: $15,000–$45,000 per turbine (6–12 accelerometers, cabling, data acquisition module, analytics integration)
- Detectable failure modes: Bearing spall progression, rotor imbalance, shaft crack propagation, coupling misalignment, blade tip rubbing
- Typical prediction lead time: 3–6 weeks for bearing degradation, 1–3 weeks for rotor imbalance trend exceeding API 687 alarm threshold
- Avoided outage cost per event: $180,000–$450,000 depending on turbine class, outage duration, and replacement power cost
- ROI: 12:1–28:1 over 3-year sensor life. Payback period: 4–8 months from first prevented forced outage event
- Sensor investment: $22,000–$42,000 per transformer (DGA analyzer, HFCT sensors, bushing monitoring, analytics integration)
- Detectable failure modes: Winding insulation paper degradation (CO/CO2 trend), partial discharge (C2H2 generation), hot metal (C2H4 generation), bushing insulation deterioration
- Typical prediction lead time: 4–12 weeks for evolving fault detected by DGA gas ratio trends, 2–6 weeks for PD activity escalation
- Avoided outage cost per event: $350,000–$1,200,000 depending on transformer rating, replacement transformer lead time, and grid penalty exposure
- ROI: 8:1–32:1 over 5-year sensor life. Payback period: 6–14 months from first detected actionable fault
- Sensor investment: $8,000–$28,000 per HRSG module (12–24 thermocouple points, data acquisition scanner, analytics integration)
- Detectable failure modes: Tube over-temperature creep (metal temperature exceeding design limit), thermal fatigue from attemperator upsets, hydrogen damage in cold-end tubes, internal scale buildup (temperature gradient increase)
- Typical prediction lead time: 2–8 weeks for sustained over-temperature conditions, 4–12 weeks for thermal cycling fatigue accumulation exceeding design life
- Avoided outage cost per event: $120,000–$380,000 depending on tube bundle replacement cost, repair duration, and combined cycle dispatch penalties
- ROI: 6:1–18:1 over 3-year sensor life. Payback period: 5–10 months from first detected tube condition requiring action
- Sensor investment: $4,000–$15,000 per critical valve/line segment (surface temperature, acoustic emission, position sensor, analytics integration)
- Detectable failure modes: Valve seat leakage (acoustic signature change), thermal stress cracking in steam line welds, steam trap failure (acoustic signature), valve actuator degradation (stroke time trend and torque profile)
- Typical prediction lead time: 2–6 weeks for valve leakage trend detection, 1–4 weeks for actuator degradation indicated by stroke time increase exceeding 15% of baseline
- Avoided outage cost per event: $60,000–$200,000 depending on valve cost, isolation requirements, and system availability impact during steam cycle operation
Expert Review: Why Sensor Strategy Determines Analytics Platform Success
In 22 years of power plant instrumentation and predictive maintenance engineering, I have reviewed over 40 analytics platform deployments across combined cycle, coal, and hydro facilities. The single most consistent factor that separates deployments that deliver measurable ROI from those that generate dashboards nobody acts on is the quality of the sensor selection and deployment planning that happened before the analytics platform was configured. I have seen a $180,000 transformer DGA installation generate a confirmed six-week advance warning of an evolving fault that allowed a planned replacement during a scheduled outage — avoiding a $780,000 forced transformer failure event. I have also seen a $220,000 wireless vibration sensor deployment on a combined cycle plant's balance-of-plant equipment generate four years of data that never prevented a single failure, because the sensors' sampling rate was too low to detect the bearing defect frequency bands that actually precede failure in those assets. .
Conclusion: The Right Sensor on the Right Asset Generates the Intelligence Your Analytics Engine Needs
Power plant predictive analytics is not a software problem with a sensor attachment — it is a measurement problem with an analytics solution. The machine learning models that forecast bearing degradation, transformer insulation aging, and tube metal creep are only as predictive as the sensor data that trains and feeds them.
The economic case for correct sensor selection is unambiguous. The technology is available. The deployment methodology is proven. The remaining variable is whether the sensor strategy receives the planning priority it requires before the analytics platform is configured.
Frequently Asked Questions
The most common mistake is selecting sensors based on cost and availability per asset class rather than on failure mode physics per specific asset. Reliability teams know that turbines need vibration sensors — but turbine bearing degradation and rotor imbalance require different sensor specifications. Bearing spall progression generates high-frequency vibration content (2–10 kHz range) that requires piezoelectric accelerometers with 100 mV/g sensitivity and 25.6 kHz sampling rate for envelope analysis. The solution is a structured selection process that starts with failure mode physics analysis before sensor technology comparison. Correctly specifying 20 sensors for the right failure modes on 20 critical assets delivers more predictive value than deploying 200 sensors selected by budget per point.
Sensor quantity is a function of asset criticality hierarchy and failure mode coverage, not of plant size. A typical 250–400 MW combined cycle plant with existing DCS sensors covering process parameters requires 80–150 additional analytics-specific sensors for comprehensive predictive coverage across gas turbine, steam turbine, generator, transformer, HRSG, and critical balance-of-plant assets. Sensor quantity decisions should prioritize coverage breadth for high-criticality assets before extending to balance-of-plant equipment, and coverage depth (multiple failure modes per asset) before single-sensor coverage across many low-criticality assets.
Existing DCS and PLC sensors provide valuable baseline data for predictive analytics — process temperatures, pressures, flow rates, and control valve positions — and should be the first data source integrated into any analytics platform. Transformer insulation degradation requires dissolved gas analysis sensors that are not part of standard instrument packages. Partial discharge detection requires specialized HFCT and TEV sensors with MHz bandwidth. The optimal approach is a two-layer sensor strategy: integrate all existing DCS sensors as the first analytics data layer (zero additional sensor cost), then deploy dedicated analytics sensors for the specific failure modes that cannot be detected through existing process measurements. This combined approach typically achieves 85–92% failure mode coverage across critical assets with 60–120 additional sensors for a combined cycle facility.
For a combined cycle facility investing the typical $280,000–$450,000 in analytics-specific sensors and an iFactory predictive analytics platform, the measured payback period across 18 reference deployments ranges from 4 to 11 months from the date the analytics model goes live. The payback drivers are not cumulative small savings — they are single-event avoided forced outage costs. The cumulative avoided outage cost across the full asset fleet delivers 8:1–22:1 annual ROI for correctly specified and deployed sensor-analytics systems.
iFactory's sensor integration layer is designed for heterogeneous plant environments where data acquisition spans multiple generations of technology — 4-20 mA analog transmitters, HART digital sensors, OPC-UA historians, Modbus RTU PLCs, and wireless IoT sensor networks. For existing sensors already connected to DCS, PLC, or historian systems, the integration is typically completed within 7 days of deployment start. The platform supports sensor data from any equipment vintage — from 1970s pneumatic transmitters with 4-20 mA I/P converters to 2025 wireless MEMS accelerometers with Bluetooth 5.3 mesh networking — as long as the measurement parameter and sampling rate match the analytics model's input requirements.