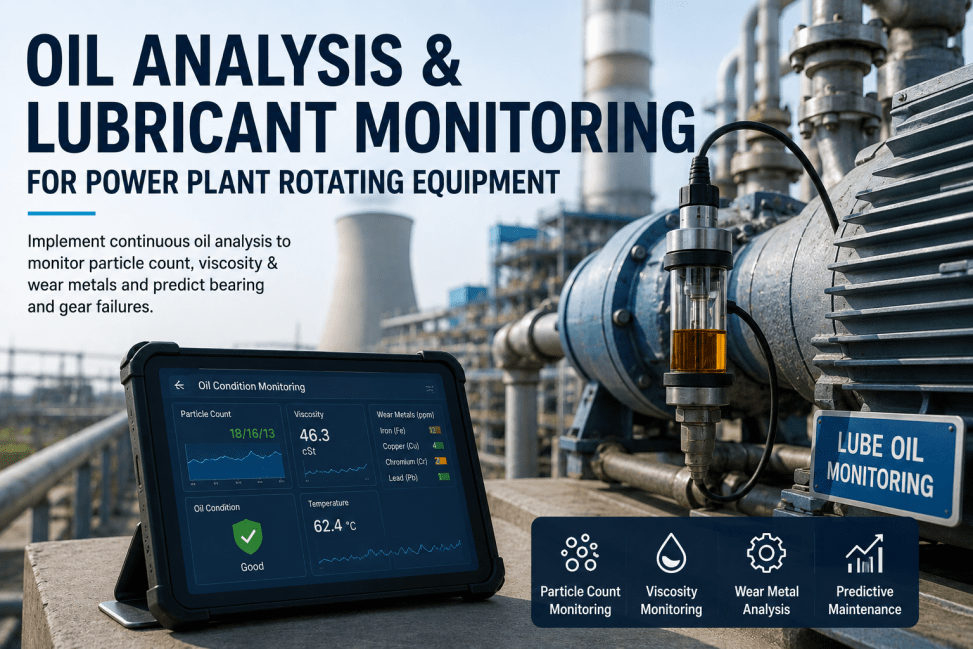
A single oil sample tells a power plant almost nothing on its own, a wear metal reading of forty parts per million iron means something completely different depending on whether last quarter's reading was thirty-five or five. The value in oil analysis has always lived in the trend line, not the individual data point, because a lubricant carries the earliest physical evidence of a bearing, gear, or seal starting to wear weeks or months before vibration or temperature data shows anything unusual. Plants that treat oil analysis as a single pass or fail number per sample are throwing away the part of the data that actually predicts failure. Teams building a trending program around turbines, gearboxes, and hydraulic systems can book a demo to see how monitoring supports the process.
MANUAL INSPECTION GAPS · OIL ANALYSIS TRENDING · 2026
Oil Analysis Only Predicts Failure When You Trend It
A consistent sampling cadence, equipment-specific alarm limits, and a longitudinal trend line across turbines, gearboxes, hydraulic systems, and transformers turn oil analysis from a compliance test into a genuine early-warning system.
Why One Sample Tells You Almost Nothing
Wear metal concentrations, particle counts, and viscosity readings only become meaningful against a baseline built from the same asset over time. A reading that looks unremarkable in isolation, iron at forty parts per million, can represent either a completely stable gearbox or one accelerating rapidly toward failure, and the only way to tell the difference is the shape of the trend line behind it. Plants that sample on a fixed calendar and file each report without comparing it to the last several results are running a program that generates data without generating insight. The lab report itself is rarely the problem, most labs already flag values against generic industry limits, the gap is almost always in what happens after the report lands, whether anyone actually plots it against the asset's own history before deciding it needs no action.
Fe >100ppm
is a commonly used action threshold for iron, typically pointing to bearing or shaft wear once crossed.
Cu >50ppm
commonly signals bushing or thrust washer degradation in rotating equipment lubricant systems.
2+ Codes
shift in ISO 4406 cleanliness code is generally treated as a sign of accelerated wear or filter bypass.
Weeks Early
is roughly how much earlier oil analysis can surface a developing fault compared to relying on vibration alone in some cases.
CONTINUOUS OIL TREND TRACKING
Stop Reading Reports in Isolation From Their Own History
See how automated trending across wear metals, particle counts, and viscosity supports your lubrication program.
Sampling Frequency Should Follow Condition, Not Just a Calendar
A fixed monthly or quarterly sampling calendar is a reasonable starting point, but it treats every asset as equally likely to develop a fault at any given moment, which is rarely true. An asset that has trended stable for two years does not need the same sampling frequency as one whose last three samples show rising particle counts, and matching frequency to actual trend behavior spends the sampling budget where it does the most good. In practice this means treating the sampling calendar as a starting point rather than a fixed rule, tightening the interval automatically once a parameter starts moving toward its limit and relaxing it again for assets that have shown years of stable readings.
Steam & Gas Turbines
Continuous, high-value rotating assets generally warrant the tightest sampling interval of any equipment class.
Gearboxes
Particle count and wear metal trending catch gear tooth and bearing wear well before a vibration alarm trips.
Hydraulic Systems
Cleanliness code is usually the leading indicator here, since contamination drives the majority of hydraulic component failures.
Transformers
Dissolved gas analysis alongside standard oil tests flags insulation breakdown long before an electrical fault occurs.
Where Contamination Actually Comes From
Breather & Seal Ingress
A degraded breather or worn seal lets in moisture and airborne particulate that a sealed system should never see.
Filter Bypass
A clogged filter that opens a bypass valve lets unfiltered oil circulate without any obvious alarm on the equipment itself.
Cross-Contamination
Topping off with the wrong lubricant grade or using shared equipment across systems introduces the wrong additive package.
Internal Wear Debris
Once a component starts to wear, it becomes its own contamination source, feeding particulate back into the system.
From Sample to Work Order
STEP 1
Sample at a Dedicated Port
Oil is drawn hot from a dedicated sample port, never the drain, to keep the sample representative.
STEP 2
Lab Analysis Against the Full Test Panel
Wear metals, particle count, viscosity, moisture, and acid number are run and compared to equipment-specific limits.
STEP 3
Trend Against Prior Samples
Results are plotted against the asset's own history, not evaluated as a single pass or fail number in isolation.
STEP 4
Escalate on a Sustained Trend
A single anomalous reading gets a re-sample, while a sustained trend crossing an alarm limit triggers a prioritized work order.
What Reliability Engineers Are Saying
We were filing oil reports for years before anyone plotted the wear metal history against itself. Once we did, a gearbox we thought was stable turned out to have a slow, steady iron increase across six consecutive samples that no single report had ever flagged as urgent on its own.
Reliability Engineer, Power Generation Facility
LUBRICATION PROGRAM HEALTH
Catch a Slow Trend Before It Becomes an Unplanned Outage
See how automated wear metal and cleanliness trending supports your rotating equipment program.
Frequently Asked Questions
What is ISO 4406 and why does it matter for oil cleanliness?
ISO 4406 is the standard used to classify hydraulic fluid cleanliness based on the number of particles of different sizes present per milliliter of oil, expressed as a three-number code. A healthy, well-filtered gearbox or hydraulic system typically sits at a stable, low cleanliness code, and a shift of two codes or more is generally treated as a sign of accelerated wear, contamination ingress, or filter bypass rather than normal variation. Because the code responds to both contamination and internal wear debris, tracking it over time is often a faster way to catch a developing problem than waiting for a wear metal threshold to be crossed outright.
How often should critical rotating equipment be sampled?
Monthly sampling is common for high-value, continuously running assets such as turbines and main drive gearboxes, while auxiliary equipment is often sampled quarterly, though the right cadence depends heavily on criticality and operating conditions. A condition-based approach that samples more frequently once a trend starts moving in the wrong direction, and less frequently once an asset has demonstrated long-term stability, generally makes better use of a lubrication program's budget than a single fixed interval applied to every asset. Teams setting up a sampling schedule can review current practice through
support.
Can oil analysis alone confirm a mechanical fault, or does it need vibration data too?
Oil analysis and vibration monitoring catch different failure signatures and work best combined rather than relied on individually. Research on gearbox monitoring has found that oil cleanliness codes alone showed poor correlation with actual gearbox health in some studies, with healthy and faulty units showing similar cleanliness readings, while wear debris trends and vibration data caught developing faults earlier and more reliably. A program that leans on oil analysis exclusively risks both false alarms and missed detections that a combined approach would catch.
What causes a sudden spike in wear metal readings?
A sudden spike, as opposed to a gradual upward trend, is more often linked to a recent maintenance event, a component change, or a filter change disturbing settled debris than to a new developing fault. That is one of the reasons a single anomalous reading typically warrants a re-sample before triggering a full work order, since maintenance-related spikes usually settle back down on the next sample while a genuine fault continues trending upward. Distinguishing the two is exactly why trend history matters more than any single data point.
How does oil analysis data typically get acted on once it is collected?
In a mature program, each result is compared automatically against the asset's own trend history and against equipment-specific alarm limits, rather than manually re-reviewed against a generic pass or fail threshold every time. When a parameter crosses its defined limit or shows a sustained trend in the wrong direction, the goal is a prioritized work order generated with the relevant oil data and asset history attached, rather than a report that sits in an inbox until someone reviews it during a scheduled meeting. Plants can
book a demo to see how that connection works in practice.
MANUAL INSPECTION GAPS · OIL ANALYSIS
Move From Filed Reports to a Tracked Wear Trend
See how live oil analysis trending fits into your plant's current lubrication and reliability program.