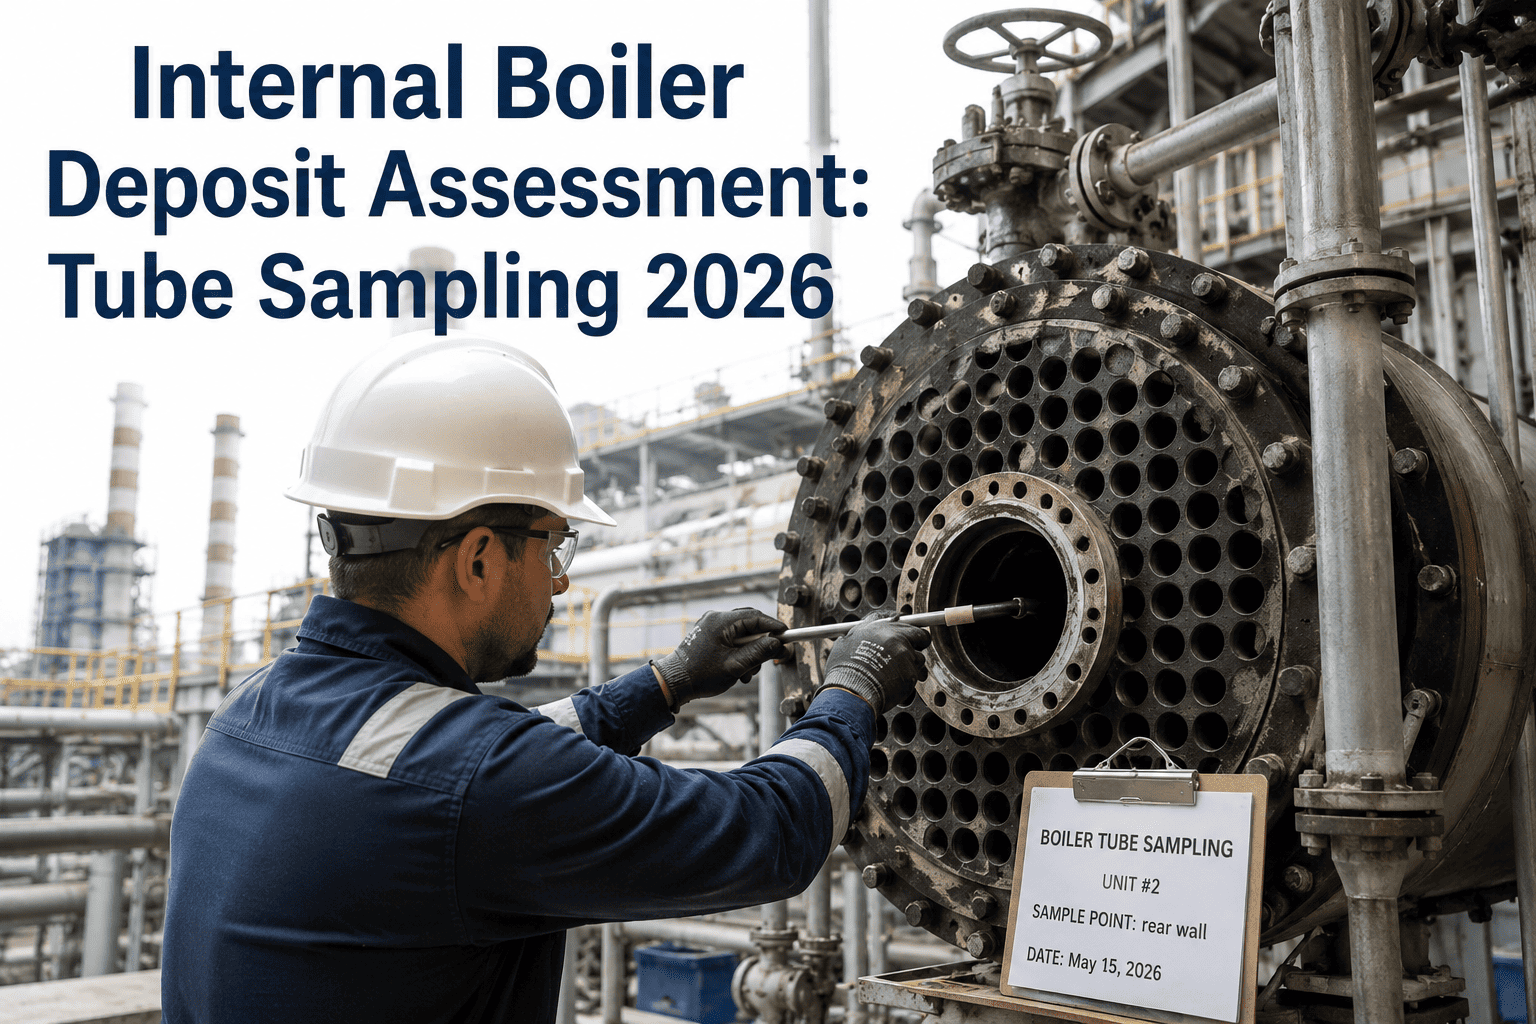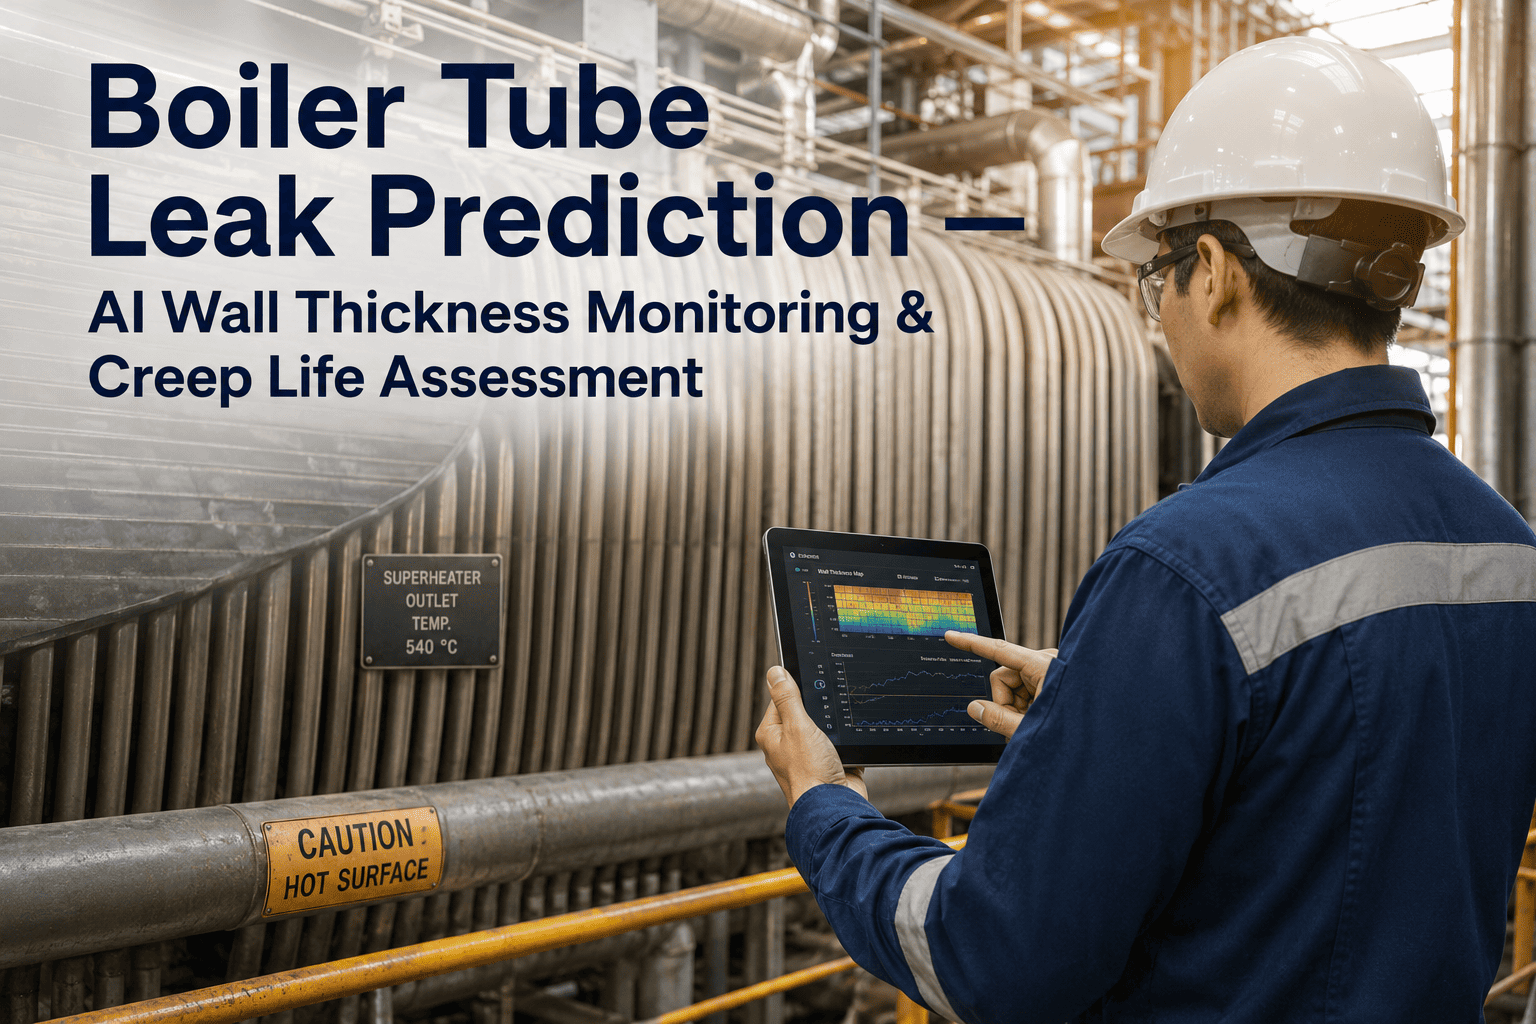
Boiler tube failures remain the single leading cause of unplanned outage hours at coal and gas-fired power plants, and most of those failures are preceded by months or years of microstructural degradation that never shows up on a walk-down inspection. A systematic tube sampling program is the only way to see inside that degradation before it becomes a forced outage. Done correctly, it means removing a small number of carefully chosen tube coupons on a fixed schedule, sending them to a metallurgical lab for microstructure, hardness, and creep evaluation, and using the results to predict remaining life at the exact locations most likely to fail next. Done poorly, it means sampling wherever access is easiest and drawing conclusions that do not represent the boiler's actual condition. Book a demo to see how iFactory tracks tube sampling history and remaining life predictions across your entire boiler.
Stop Guessing Where Your Boiler Tubes Will Fail Next
A structured sampling and metallurgical evaluation program tells you exactly which tube locations are degrading, how fast, and how much service life remains, before a leak forces the outage for you.
Why Visual Inspection Alone Cannot Catch What's Coming
Overheating, creep, and internal oxide buildup change a tube's microstructure long before any visible bulging, discoloration, or wall loss appears from the outside. By the time a tube looks bad on a walk-down, the metallurgical damage underneath it is often already advanced.
Where to Cut Samples From, and Why It Determines the Whole Program's Value
A tube sample only tells you about the exact location it was cut from. Selecting the wrong locations produces a report that looks thorough but misses the section of the boiler actually at risk.
The Sampling Procedure, Step by Step
Consistent cutting and handling procedure matters as much as location selection. A sample that is overheated during removal or mislabeled in transit can invalidate the metallurgical result entirely.
What Actually Happens Inside the Metallurgical Lab
Once a sample reaches the lab, it goes through a defined sequence of tests, each one adding a different layer of evidence to the final remaining life estimate.
Turn Lab Results Into a Living Tube Condition Record
iFactory logs every sample location, lab result, and remaining life estimate against your boiler's tube map, so the next sampling cycle builds on the last one instead of starting from a blank sheet.
The Four-Stage Creep Damage Classification System
Metallurgical labs grade creep damage on a standard four-stage scale based on what is visible in the microstructure. This grading is what turns a photomicrograph into an actionable remaining life decision.
Building a Sampling Schedule That Actually Tracks Trends
A single sampling event is a snapshot. A structured program that resamples the same or adjacent locations over time is what actually reveals the rate of degradation, which is the number that drives repair and replacement planning.
| Program Element | One-Time Sampling | Structured Sampling Program |
|---|---|---|
| Trend Visibility | Single point in time, no degradation rate available | Sequential samples reveal actual rate of creep progression |
| Location Consistency | Often selected reactively after a leak | Pre-defined locations tracked across every cycle |
| Remaining Life Confidence | Estimated from generic time-temperature curves alone | Calibrated against your unit's own measured degradation rate |
| Repair Planning | Reactive, driven by the most recent failure | Proactive, scheduled around predicted remaining life windows |
| Outage Scope Accuracy | Frequently under-scoped, leading to repeat outages | Scoped from actual condition data across the full tube map |
| Record Continuity | Results filed separately, rarely compared cycle to cycle | Centralized history tied to location, steel grade, and operating data |
How Often Should Sampling Actually Happen
Sampling frequency should scale with unit age, prior damage history, and operating severity rather than following a single fixed calendar interval across every boiler in the fleet.
Frequently Asked Questions
How many tube samples does a typical boiler need for a meaningful evaluation?
There is no fixed universal number, since it depends on boiler size, circuit count, and prior damage history, but most structured programs remove somewhere between eight and twenty samples per evaluation cycle across a utility-scale unit. The count is driven by covering every high heat flux zone, every prior failure or repair location, a representative spread of baseline locations, and enough statistically distributed samples across the remaining circuit length to catch degradation that is not tied to an obvious hot spot. Removing too few samples risks missing the actual worst-condition location, while removing far more than necessary adds cost and outage time without meaningfully improving the remaining life estimate. Book a demo to see recommended sample counts scaled to your specific boiler configuration.
Can non-destructive testing replace physical tube sampling entirely?
Non-destructive methods such as ultrasonic wall thickness scanning and EMAT testing are valuable for screening large areas of the boiler quickly and identifying candidate locations for sampling, but they cannot fully replace destructive metallurgical evaluation. Wall thickness measurement shows material loss but cannot directly reveal microstructural creep damage, grain boundary void formation, or internal oxide scale thickness, all of which require a physical cross-section examined under a microscope. The most effective programs use non-destructive screening to narrow down candidate locations across the full boiler, then confirm and quantify condition at the highest-risk locations through physical sampling and laboratory analysis. Contact support to discuss combining NDT screening with a physical sampling program.
What steel grades require different sampling and evaluation considerations?
Carbon steel water-wall tubing, low-alloy Cr-Mo grades commonly used in superheater and reheater sections, and higher-alloy stainless or advanced creep-resistant grades used in the highest temperature circuits each have different published time-temperature relationships and different expected microstructural evolution patterns. A remaining life calculation performed using the wrong grade's reference data will produce a materially inaccurate result, so every sample submission needs to include confirmed steel grade rather than an assumed one based on drawing vintage. Older units in particular sometimes have undocumented grade substitutions from historical repairs, which is why baseline chemical composition verification is often included alongside the standard metallurgical evaluation. Book a demo to see how grade-specific evaluation is tracked across mixed-material boilers.
What should be done once a location is graded Stage C or Stage D creep damage?
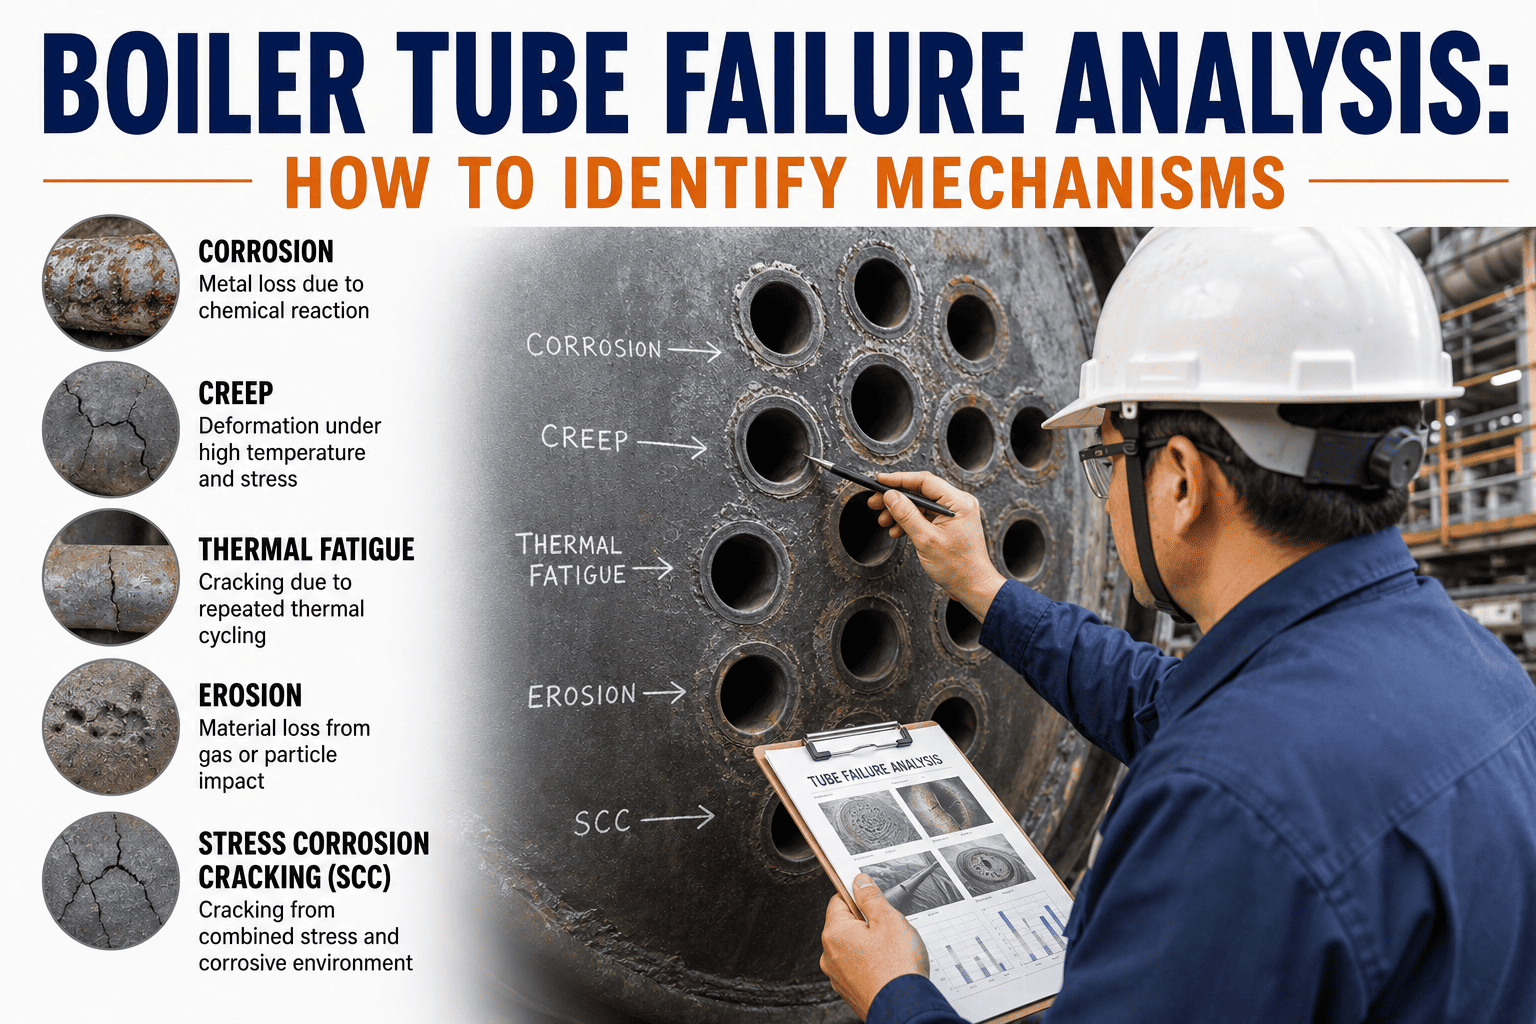
A Stage C finding, where creep voids have started linking along the direction of principal stress, should trigger both a shortened reinspection interval at that specific location and expanded sampling of adjacent tube sections, since damage mechanisms rarely stay confined to a single spot. A Stage D finding, involving visible macro-cracking, should be treated as a near-term failure risk and prioritized for repair or replacement during the next available outage window rather than continued monitoring, since remaining life at that stage is typically measured in a small number of operating cycles rather than years. Both findings should also prompt a review of whether the underlying cause, such as a slagging pattern or steam flow imbalance, has been corrected, since replacing the tube without addressing the root cause simply resets the same failure clock. Contact support to build a corrective action workflow tied to creep stage findings.
How is oxide scale thickness used to estimate a tube's actual operating temperature?
Internal steam-side oxide scale grows at a predictable rate for a given steel grade and metal temperature, following published parabolic growth relationships developed from extensive laboratory and field data. By measuring the actual oxide thickness on a removed sample and comparing it against these reference curves, a metallurgical lab can back-calculate the effective average metal temperature the tube has experienced over its service life, which is often meaningfully different from the design temperature assumed on paper. This measured, real operating temperature is one of the most important inputs into the remaining life calculation, since even a modest sustained overtemperature condition can shorten creep life dramatically compared to design expectations. Book a demo to see oxide-derived temperature tracked alongside your remaining life estimates.
Never Lose Track of a Sample Result Again
iFactory centralizes every tube sample location, lab report, and remaining life estimate into one boiler-wide record, so your next outage scope is built on evidence instead of guesswork.