Most reliability teams can tell you how many boiler tube leaks they had last year. Very few can tell you what those leaks actually cost, or whether the number is trending better or worse. A single tube rupture on a 500 MW unit typically drives more than three million dollars in lost generation against several days of repair, yet without a structured tracking system that figure stays buried across shift logs, work orders, and finance spreadsheets that never talk to each other. Forced outage tracking turns that scattered record into one trend line reliability engineers can actually act on, and you can book a demo to see what your own outage history is already telling you.
RELIABILITY ENGINEERING · FORCED OUTAGE TRACKING · COST ANALYSIS
Boiler Tube Leaks Cause Over Half Of All Forced Outages — And Most Plants Still Can't Put A Dollar Figure On Them
Boiler tube leaks account for more than 52% of forced outages across the thermal fleet, yet the majority of reliability programs still track them as a count instead of a cost. iFactory turns every leak into a trended data point — MTBF, repair duration, and dollars lost — so your next reliability improvement project gets funded on evidence instead of a hunch.
52%
Of forced outages in thermal plants traced back to boiler tube failures
$3M+
Typical lost generation from a single tube rupture on a 500 MW unit
3.6 Days
Average repair duration reliability teams budget for one leak event
WHERE THE MONEY ACTUALLY GOES
A Tube Leak Isn't One Cost — It's Four Costs Stacked On Top Of Each Other
When a plant reports "a tube leak cost us $2 million," that number is almost always an average, not a breakdown. Every real forced outage is a stack of separate cost drivers, and the ratio between them changes depending on how fast the leak was caught and how long the unit stayed offline. Reliability programs that only track the total miss which lever actually moves the number.
Direct Repair
Welding, tube replacement, scaffolding, and hydro-test labor and materials — typically the smallest slice of the total, often $50K to $300K per event.
Lost Generation Revenue
Every hour offline forfeits generation revenue, commonly $125,000 or more per hour depending on unit size and market price at the time of the trip.
Replacement Power Purchase
Covering committed load from the grid at spot or peaking rates, which can dwarf the repair cost during high-demand periods or extreme weather.
Startup, Penalty, and Thermal Stress Cost
Fuel burned during restart, contract or capacity-market penalties, and accelerated thermal fatigue on components that just cycled through an unplanned trip.
Add the four together on a 200 to 400 MW unit and the total commonly lands between $1.2 million and $10 million per incident, with the wide range driven almost entirely by how long detection took and how deep into the boiler the damage had spread before anyone noticed.
THE METRICS THAT MATTER
Four Numbers That Turn A Pile Of Work Orders Into A Reliability Program
Counting leaks tells you what happened. These four metrics tell you whether your program is actually improving, and they are the numbers ownership, finance, and NERC GADS reporting all expect to see trended over time.
MTBF
Mean Time Between Failures
Total operating hours divided by the number of unplanned tube failures. A rising trend means your inspection and PM program is working; a falling trend is the earliest warning that a failure cluster is forming.
MTTR
Mean Time To Repair
Total repair time divided by the number of failures. It exposes delays in leak location, parts staging, and crew mobilization separately from how often failures occur in the first place.
Availability
MTBF ÷ (MTBF + MTTR)
The single combined score that ownership and regulators actually track. On a 500 MW unit, every one percentage point of availability lost equals millions in annual forfeited generation revenue.
Cost Per Event
Total Outage Cost ÷ Failure Count
The financial layer most reliability dashboards skip. Pairing this with MTBF by boiler zone is what turns a maintenance report into a capital-approval business case.
Your Boiler Already Has The Data — It Just Isn't Trended Yet
iFactory connects to your existing historian and work order history to calculate MTBF, MTTR, availability, and cost per event automatically, by boiler zone, without new instrumentation.
BUILDING THE PROGRAM
Five Steps From A Pile Of Work Orders To A Funded Reliability Project
Reliability improvement projects get approved when the business case is built on trended cost data, not a general sense that leaks are becoming a problem. Here is the sequence plants follow to get there.
1
Establish A Clean Failure Event Baseline
Pull every recorded tube leak from the last 24 to 36 months and normalize the record — start time, detection method, affected zone, repair duration, and direct cost — into one dataset instead of scattered shift logs.
2
Classify Every Failure By Zone And Mechanism
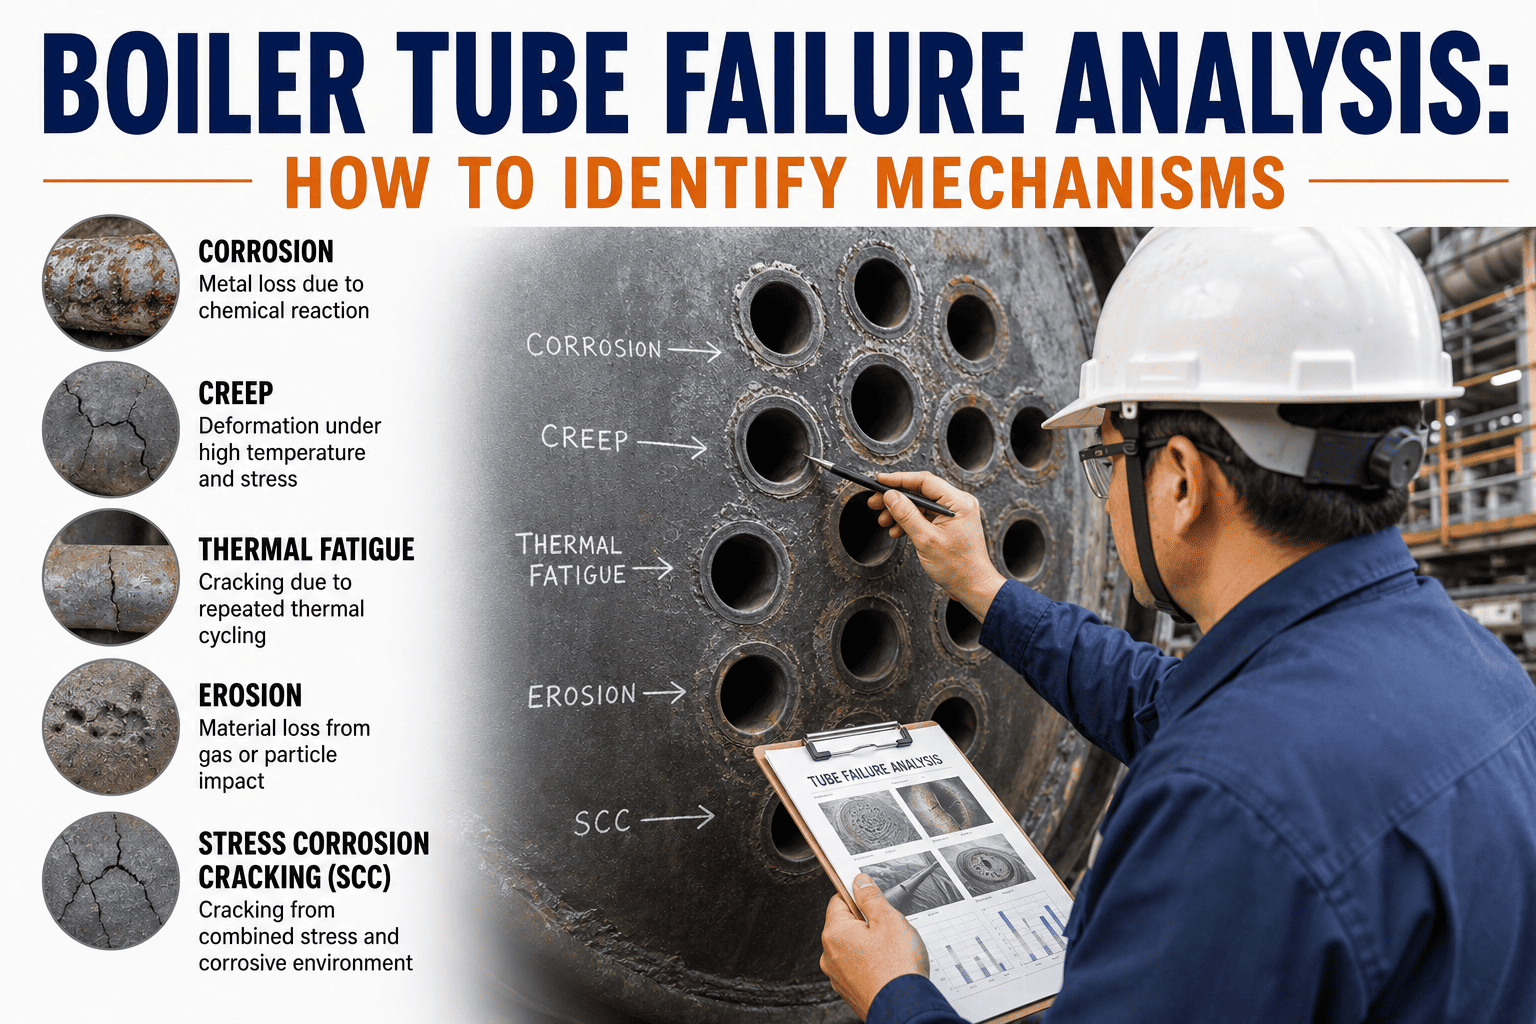
Tag each event to its boiler zone — waterwall, superheater, reheater, or economizer — and to its likely failure mechanism: fatigue, corrosion, creep, or erosion, since each mechanism responds to a different fix.
3
Calculate MTBF And MTTR Per Zone, Not Plant-Wide
A single plant-wide MTBF number hides which zone is actually degrading. Splitting the calculation by zone shows exactly where reliability is falling and where it is stable.
4
Attach A Dollar Figure To Every Event
Layer the four-part cost stack — repair, lost generation, replacement power, and penalties — onto each logged failure so the trend line is denominated in dollars, not just hours.
5
Package The Trend Into A Funded Improvement Project
Present the zone with the worst MTBF and highest cost per event as a scoped capital or inspection project, with the avoided-cost trend line as the justification finance actually approves.
WHERE FAILURES CONCENTRATE
Not All Boiler Zones Fail At The Same Rate — Or Cost The Same When They Do
Failure frequency and repair complexity vary sharply by zone, which is exactly why plant-wide averages hide the zone that actually needs a targeted project.
| Boiler Zone |
Share Of Tube Failures |
Dominant Mechanism |
Typical Repair Window |
| Waterwall Tubes |
Highest single share |
Fatigue and corrosion thinning |
18 to 48 hours |
| Superheater / Reheater |
Roughly 40% of pressure-part failures |
Creep rupture, thermal stress |
2 to 5 days |
| Economizer Tubes |
Moderate, slow-building |
Erosion, pinhole propagation |
1 to 3 days |
| Headers And Stub Tubes |
Lower frequency, high severity |
Wall-loss ruptures if unmonitored |
Multi-day, often campaign-ending |
The pattern reliability engineers see again and again: waterwall tubes generate the most events, but header and stub tube failures generate the longest and costliest outages when a wall-loss trend gets missed between inspection windows.
WHAT IFACTORY TRACKS AUTOMATICALLY
Every Outage, Captured The Same Way, Every Time
A tracking program only produces a trustworthy trend line if every event is captured consistently. iFactory standardizes that capture the moment a tube leak is logged.
Event Timestamps
Start of leak indication, unit trip time, and restoration time are captured automatically from the historian rather than reconstructed later from memory.
Zone And Mechanism Tagging
Each event is tagged to its boiler zone and probable failure mechanism, building the classified dataset a reliability project needs without manual spreadsheet work.
Cost Roll-Up
Repair labor, replacement power, and lost generation revenue are calculated per event using your plant's actual rate structure, not an industry average.
Rolling MTBF And MTTR Trend
Zone-level MTBF and MTTR update automatically as new events are logged, so a degrading trend surfaces weeks before the next failure rather than at year-end review.
FREQUENTLY ASKED QUESTIONS
Questions Reliability Teams Ask About Forced Outage Tracking
Why isn't counting the number of tube leaks per year enough?
A raw count treats a two-hour online repair the same as a five-day header replacement, which hides where the real cost and risk are concentrated. Two plants can report the same number of leaks in a year and have wildly different financial exposure depending on which zones failed and how quickly each was caught. Tracking MTBF, MTTR, and cost per event by boiler zone separates the noise from the pattern that actually needs a reliability project.
Book a demo to see this breakdown applied to your own outage history.
How far back should our failure event baseline go?
Most reliability programs pull 24 to 36 months of history, which is enough operating time to establish a statistically meaningful MTBF per zone without diluting the trend with equipment configurations or operating conditions that no longer apply. Shorter windows tend to overreact to a single bad month, while much longer windows can blur genuine degradation trends under older maintenance practices. iFactory can ingest historical work order and historian data to build this baseline automatically.
Contact our support team to scope a data import for your plant.
What data does iFactory need to start calculating MTBF and MTTR automatically?
iFactory connects to your existing historian or control system along with your CMMS work order history, so no new sensors or hardware are required to get started in most cases. The platform uses trip timestamps, restoration timestamps, and logged repair records to calculate zone-level MTBF, MTTR, and availability from day one, then keeps the trend current automatically as new events are logged.
Book a demo to see what your historian data already supports.
How do we turn a rising failure trend into a funded project?
Finance and ownership approve reliability projects fastest when the request is framed as avoided cost rather than preventive spend, meaning the trended MTBF decline in a specific zone is paired directly with the dollar cost of the events it produced. A project scoped around the worst-performing zone, with a clear before-and-after cost projection, moves through capital approval far faster than a general request to "improve boiler reliability."
Contact our support team for help packaging your first business case.
Does forced outage tracking replace the need for tube inspection programs?
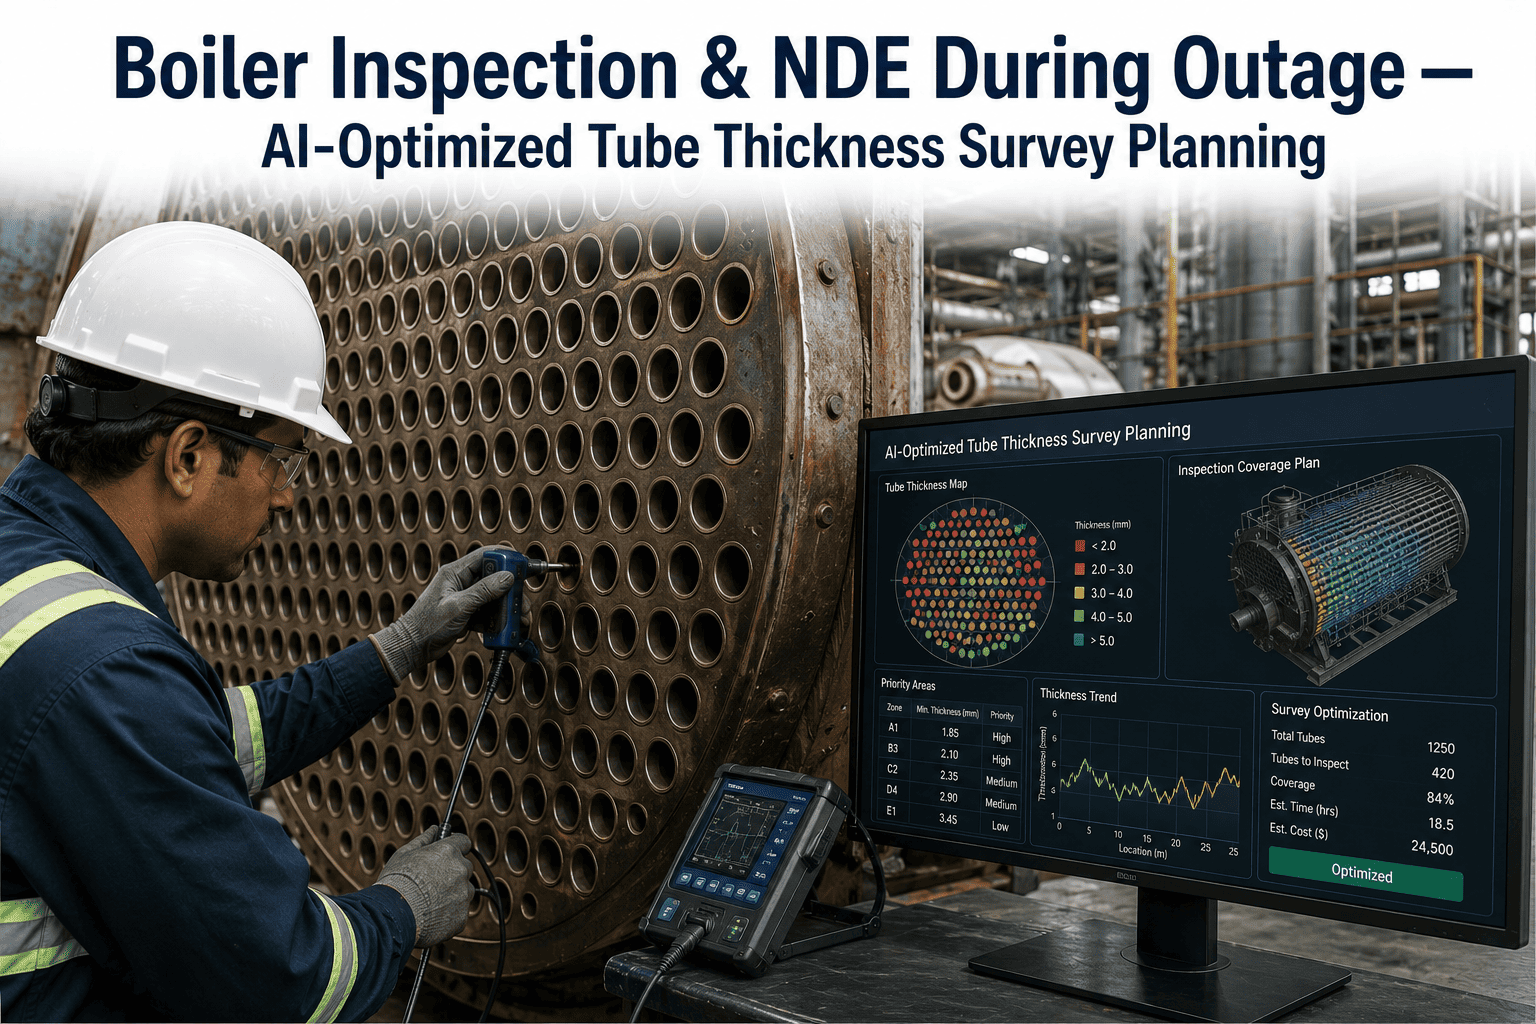
No, tracking and inspection solve different problems and work best combined. Inspection programs like ultrasonic thickness mapping detect wall loss before it becomes a leak, while forced outage tracking tells you which zones, mechanisms, and time periods deserve the tightest inspection cadence in the first place. Plants that run both together typically direct inspection budget more precisely instead of spreading it evenly across zones that don't need it.
Book a demo to see how tracking data can retune your inspection intervals.
Turn Every Tube Leak Into A Trend Line, Not A One-Off Report
iFactory tracks MTBF, MTTR, availability, and cost per event automatically by boiler zone, so your next reliability project is built on evidence your finance team already trusts.