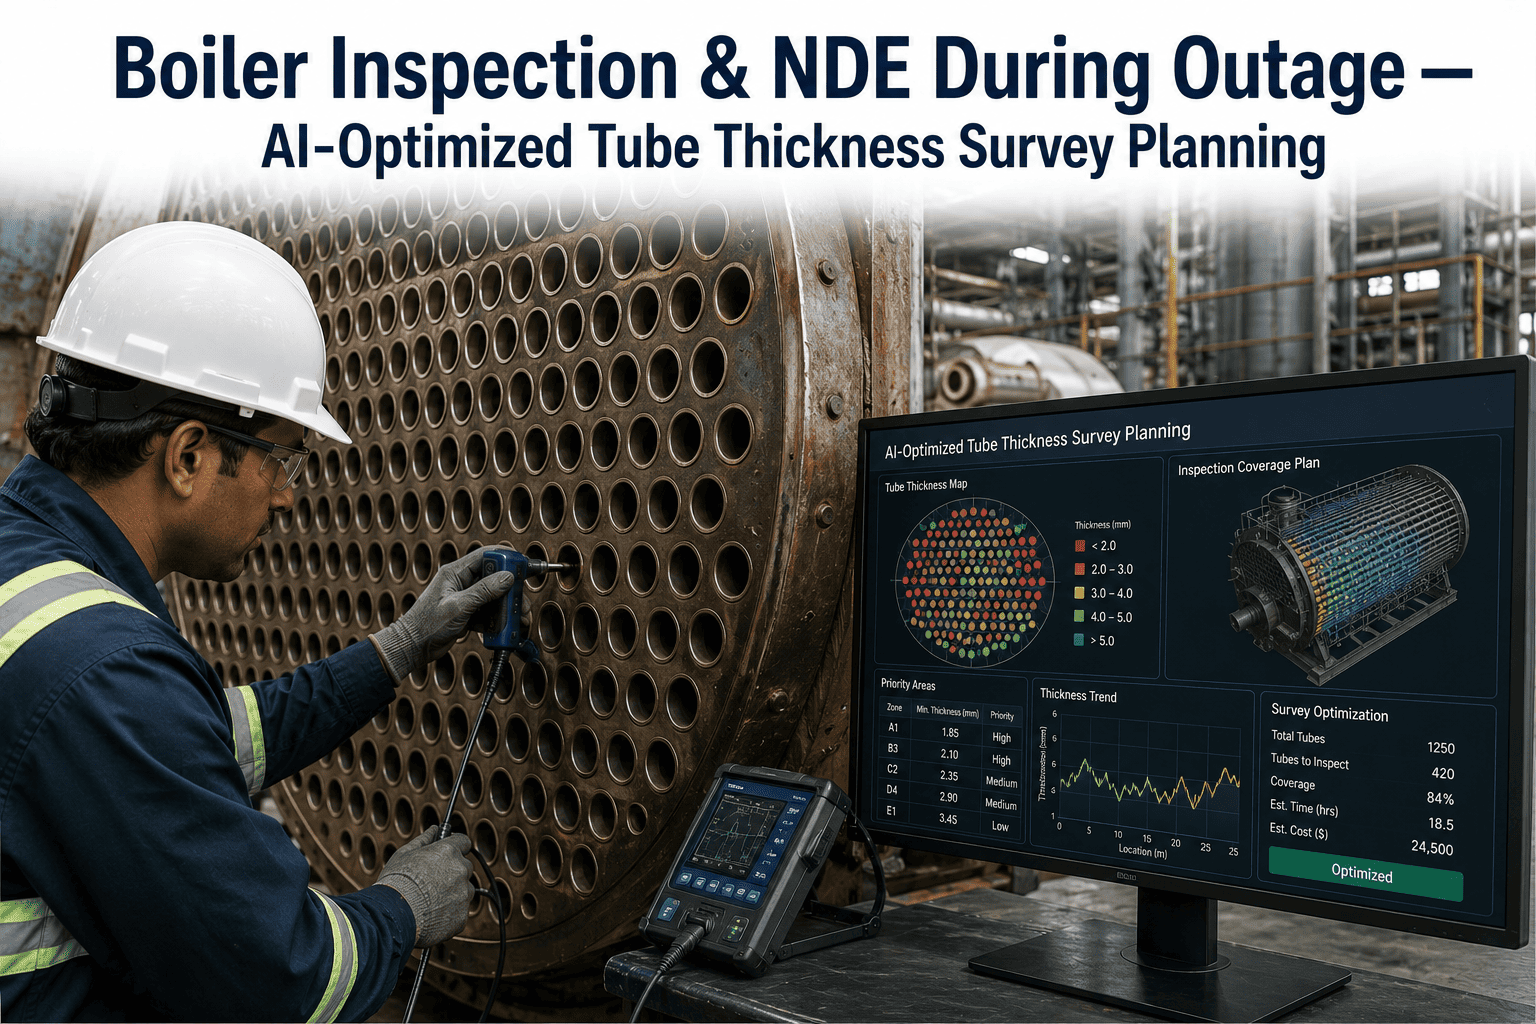
A mid-size boiler can carry over fifty miles of waterwall tubing, and traditional ultrasonic thickness testing only ever reaches a small fraction of it, because manual surveys are labor-intensive and outage time is too expensive to spend scanning tubing that was probably fine to begin with. That "probably" is where the risk hides. Historically, inspection teams have relied on spot-checking tubes in areas known for past problems, which works until a failure shows up somewhere nobody thought to look. AI-optimized survey planning changes the starting point by using operating history, prior thickness data, and known degradation mechanisms to rank which sections of tubing carry the highest risk before the outage begins, so inspection hours go where they matter most instead of being spread thin across the whole boiler. Process engineers planning their next NDE scope can see exactly how that prioritization would apply to their unit in a walkthrough session.
BOILER INSPECTION & NDE PLANNING
Focus Tube Thickness Surveys on the Tubes That Actually Matter
AI-optimized survey planning ranks boiler tube sections by risk using operating history and prior thickness trends, so limited outage inspection time is spent on the highest-risk tubes instead of a random sample.
Four Degradation Mechanisms That Weaken Boiler Tubes
Most of these mechanisms produce no visible external symptom until failure is close, which is exactly why they need to be tracked through data rather than caught by eye.
General Wall Thinning
Gradual erosion or corrosion reduces wall thickness evenly over time, tracked through ultrasonic measurement at fixed survey points.
Localized Pitting
Corrosion cells concentrate wall loss in small areas, which can be missed entirely by a survey grid spaced too widely.
Hydrogen Damage
Micro-cracking from hydrogen attack can occur with little to no accompanying wall loss, making it invisible to thickness readings alone.
Creep in High-Energy Piping
Long-term exposure to high temperature and pressure gradually deforms tube material, typically identified through replication or advanced UT techniques.
50+ Miles
Approximate total waterwall tubing length in a typical mid-size boiler
Small Fraction
Share of total tube surface area a traditional manual spot-check survey typically covers
Risk-Ranked
Approach that prioritizes inspection based on operating history instead of even distribution
NDE Techniques and What Each One Actually Catches
Build a Risk-Ranked Survey Plan From Your Own Boiler History
See how prior thickness data and operating history would prioritize inspection scope for your next planned outage.
How Risk-Based Survey Planning Works
1
Historical Data Review
Prior thickness surveys, repair records, and known degradation patterns for the specific boiler are compiled into one dataset.
2
Thinning Rate Modeling
Wall loss trends are projected forward for each tube section to estimate which areas are approaching a minimum thickness threshold.
3
Risk Ranking
Tube sections are ranked by projected risk, factoring in operating history, fuel type, and known high-risk zones such as burner elevations.
4
Targeted NDE Deployment
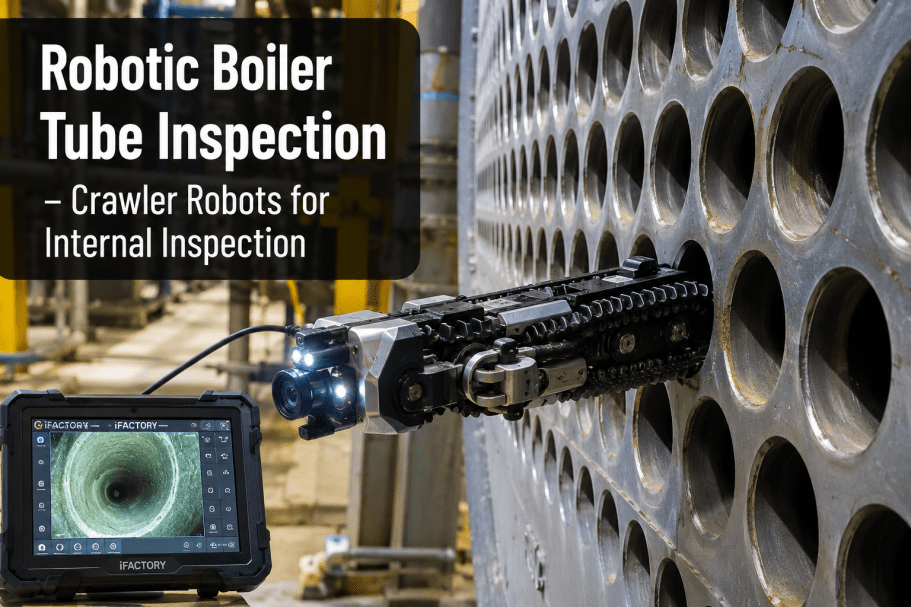
Inspection crews or robotic crawlers are deployed to the highest-risk sections first, maximizing coverage within the outage window.
5
Data Feedback
New thickness readings feed back into the model, sharpening the risk ranking and thinning rate projections for the next outage.
Frequently Asked Questions
STOP GUESSING WHERE TO INSPECT
Turn Your Boiler History Into a Smarter Survey Plan
See how risk-based prioritization can direct your next outage's NDE hours to the tubes most likely to need them.



.png)