Choosing between cloud-based and on-premise AI-driven analytics for your power plant is no longer a simple infrastructure debate—it is a financial decision that affects capital allocation, operational flexibility, and competitive positioning for the next decade. In the capital-intensive environment of power generation, the total cost of ownership analysis must extend far beyond software licensing fees. Book a demo with iFactory receive a personalized TCO analysis that maps cloud and on-premise costs to their specific plant architecture and fleet profile.
Get Your Personalized Cloud vs On-Premise TCO Report
iFactory provides detailed total cost of ownership models for both cloud and on-premise AI-driven analytics deployment, tailored to your generation fleet size, asset mix, and compliance requirements.
Why Power Plant TCO Demands a Five-Horizon View
The fundamental challenge in comparing cloud and on-premise TCO for power generation analytics is that the cost profiles diverge over different time horizons. Further complicating the analysis are plant-specific factors including existing IT infrastructure, NERC CIP compliance posture, data latency requirements for real-time turbine monitoring, and multi-site fleet coordination needs. Plant managers and CFOs who Book a demo with iFactory's team receive a multi-year TCO projection that accounts for each of these variables against their specific operational context.
"When we first compared cloud and on-premise TCO for our fleet of six combined-cycle plants, the cloud option appeared dramatically cheaper on paper. But once we factored in data egress charges, NERC CIP audit costs, and the long-term data volume growth trajectory from our planned sensor expansion program, the five-year breakeven shifted significantly. The most valuable outcome of the TCO analysis was not identifying the cheaper option—it was understanding the specific operating conditions under which each model delivers superior financial outcomes. That clarity came from modeling our actual plant data, not industry averages.Book a demo"
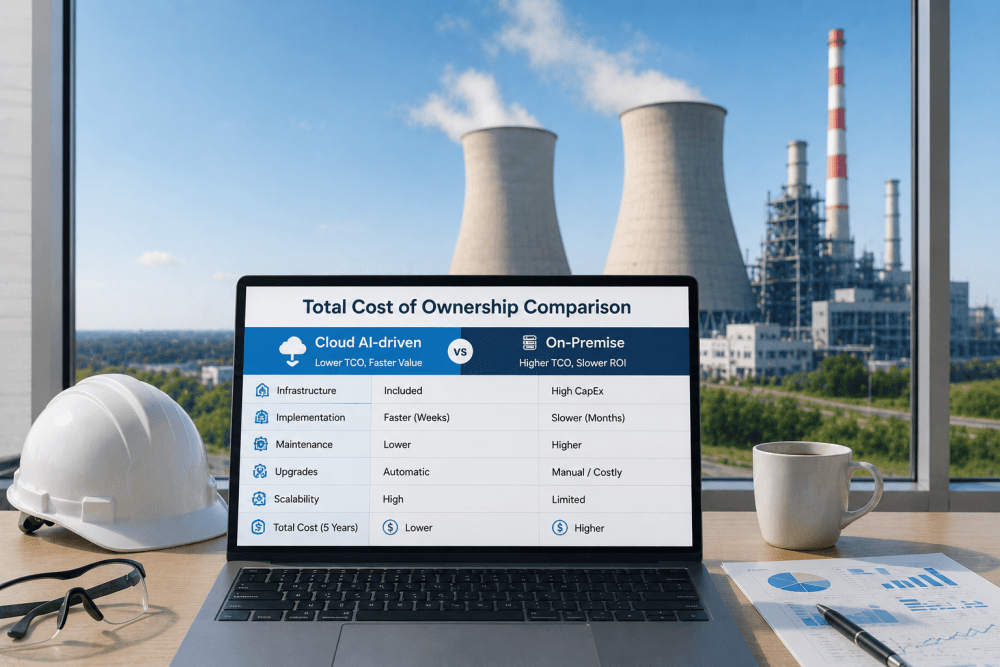
Head-to-Head TCO Matrix: Cloud vs On-Premise
The following comparison matrix provides a side-by-side evaluation of cloud and on-premise costs across the full lifecycle of power generation analytics deployment. Figures are based on iFactory deployment data from combined-cycle power plants with 600 MW to 1,200 MW generation capacity, four gas turbines, and two steam turbines per site. Reliability managers who complete this evaluation typically proceed to a personalized TCO analysis with iFactory's deployment engineering team.
| Cost Category | Cloud AI-Driven | On-Premise AI-Driven | Key Difference |
|---|---|---|---|
| Year 1 Capital Expenditure | $0 (operational expense) | $180K–$450K | Cloud eliminates upfront CAPEX entirely |
| Annual Software Access | $120K–$200K per plant | $80K–$140K license + 20% annual maintenance | Cloud premium reflects managed infrastructure |
| Implementation Services | $40K–$80K pre-configured | $90K–$180K custom integration | On-premise requires extensive OT network engineering |
| IT & Security Staffing | $15K–$30K oversight only | $60K–$120K dedicated administration | Cloud reduces staffing through vendor management |
| NERC CIP Compliance | $20K–$40K audit & documentation | $40K–$80K full compliance ownership | Cloud shifts 40–50% of burden to provider |
| Data Storage & Compute | $30K–$80K variable with volume | $10K–$25K fixed capacity | Cloud scales; on-premise is capacity-capped |
| 5-Year Cumulative TCO | $780K–$1.4M | $680K–$1.6M | Range reflects plant size and data volume |
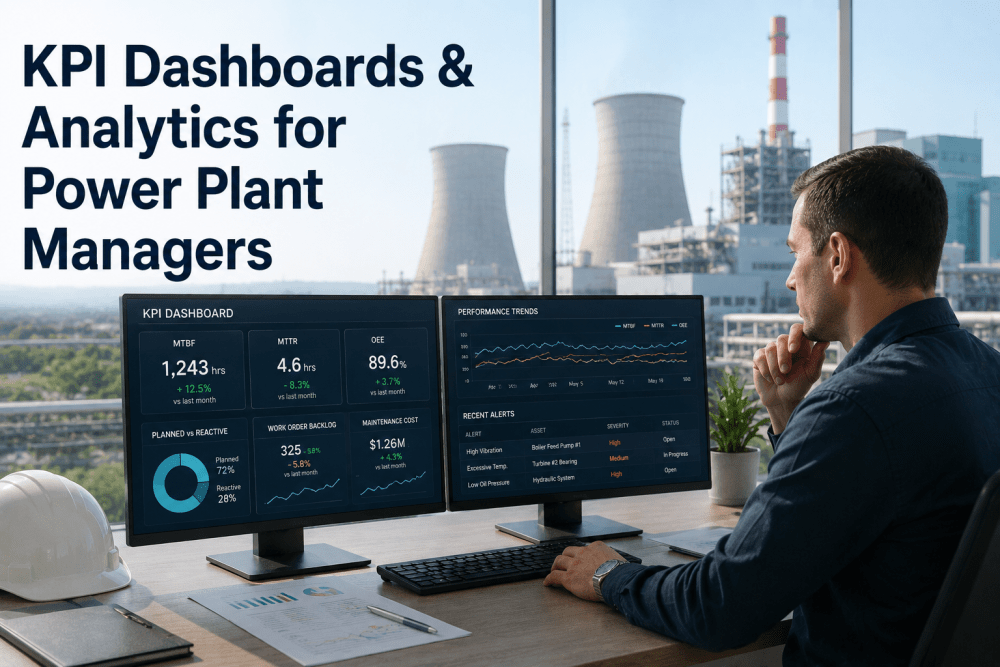
TCO Comparison Metrics from Power Generation Deployments
The following metrics represent the measurable TCO differences observed across iFactory deployments at combined-cycle and simple-cycle power plants. These benchmarks inform the deployment model decision for plants considering AI-driven analytics platforms.
Phased Deployment Assessment: Finding Your Optimal Model
Determining whether cloud or on-premise analytics delivers superior TCO for your power plant requires a structured assessment that considers plant configuration, data infrastructure maturity, and financial preferences. iFactory's deployment framework guides plants through three evaluation phases to identify the optimal deployment model. Plant leadership teams who Book a demo receive a comprehensive deployment assessment with cost modeling across both options.
Plant Profile & Data Assessment
Evaluate existing IT infrastructure, OT network architecture, data volume and velocity from DCS/SCADA systems, and current NERC CIP compliance posture. This phase establishes the baseline cost inputs for TCO modeling. Cloud-optimal plants typically have limited existing server infrastructure.
Timeline: 2–3 weeks.
Financial Modeling & Scenario Analysis
Build detailed 5-year TCO models for both cloud and on-premise deployment, incorporating capital budgeting constraints, operational expense preferences, data volume growth projections, and compliance cost assumptions. Sensitivity analysis identifies the key cost drivers and break-even conditions for each model.Book a demo
Timeline: 2–4 weeks.
Deployment Planning & Risk Mitigation
Select optimal deployment model and develop phased implementation plan with milestone-based cost tracking. Establish data migration strategy, integration timeline, compliance validation schedule, and operational readiness criteria. Both cloud and hybrid options remain available during the planning phase.
Timeline: 4–6 weeks.
Total Cost of Ownership — Frequently Asked Questions
What hidden costs should I account for when comparing cloud vs on-premise TCO?
The most commonly overlooked hidden costs in cloud TCO are data egress charges for high-frequency sensor data, GPU compute costs for AI model training and inference, and the cumulative cost of storing years of historical operational data. For on-premise TCO, hidden costs include facility upgrades for server cooling and power redundancy, compliance staffing, and the opportunity cost of delayed analytics capability during the longer implementation timeline. A comprehensive TCO model should include all seven cost categories shown in the comparison matrix above.Book a demo
What is the typical break-even point between cloud and on-premise deployment?
For a typical combined-cycle power plant with four gas turbines and two steam turbines, the break-even point where cumulative on-premise TCO equals cumulative cloud TCO occurs between years three and four. Cloud deployment has substantially lower year-one costs due to eliminated capital expenditure and faster implementation, but on-premise cumulative costs grow more slowly after the initial investment.
How does NERC CIP compliance affect TCO for each deployment model?
NERC CIP compliance adds 20–30% to on-premise TCO through required security controls, vulnerability management programs, patch cycles, and annual audit preparation. Cloud deployment shifts 40–50% of this burden to the cloud provider under a shared responsibility model, but requires documented compliance controls and periodic provider audits. Both models must address CIP-013 supply chain risk management, which adds ongoing vendor assessment costs regardless of deployment model.
Can a hybrid cloud and on-premise model optimize TCO for multi-site fleets?
Yes, hybrid deployment is increasingly the preferred model for multi-site power generation fleets. Real-time turbine monitoring and control-adjacent analytics run on-premise at each plant for low latency and OT network compliance, while fleet-wide analytics, cross-site benchmarking, and centralized reporting operate in the cloud. This approach optimizes both cost and capability: on-premise handles latency-sensitive workloads at fixed cost, while cloud provides centralized analytics and multi-site coordination with consumption-based pricing that scales only as the fleet grows.
What happens to TCO if my plant data volume doubles over the contract term?
Cloud TCO scales nearly linearly with data volume—doubling data could increase costs by 40–60% depending on cloud pricing tiers and compute requirements for AI model inference. On-premise TCO is largely fixed up to the capacity of deployed infrastructure, with incremental hardware expansion costs of 20–40% for capacity doubling.
Start Your Cloud vs On-Premise TCO Analysis with iFactory
iFactory's power generation analytics platform delivers the data-driven TCO comparison you need to make a confident deployment decision. Our team will work with your engineering and finance teams to build a complete cost model covering infrastructure, implementation, compliance, and operations across both deployment scenarios.