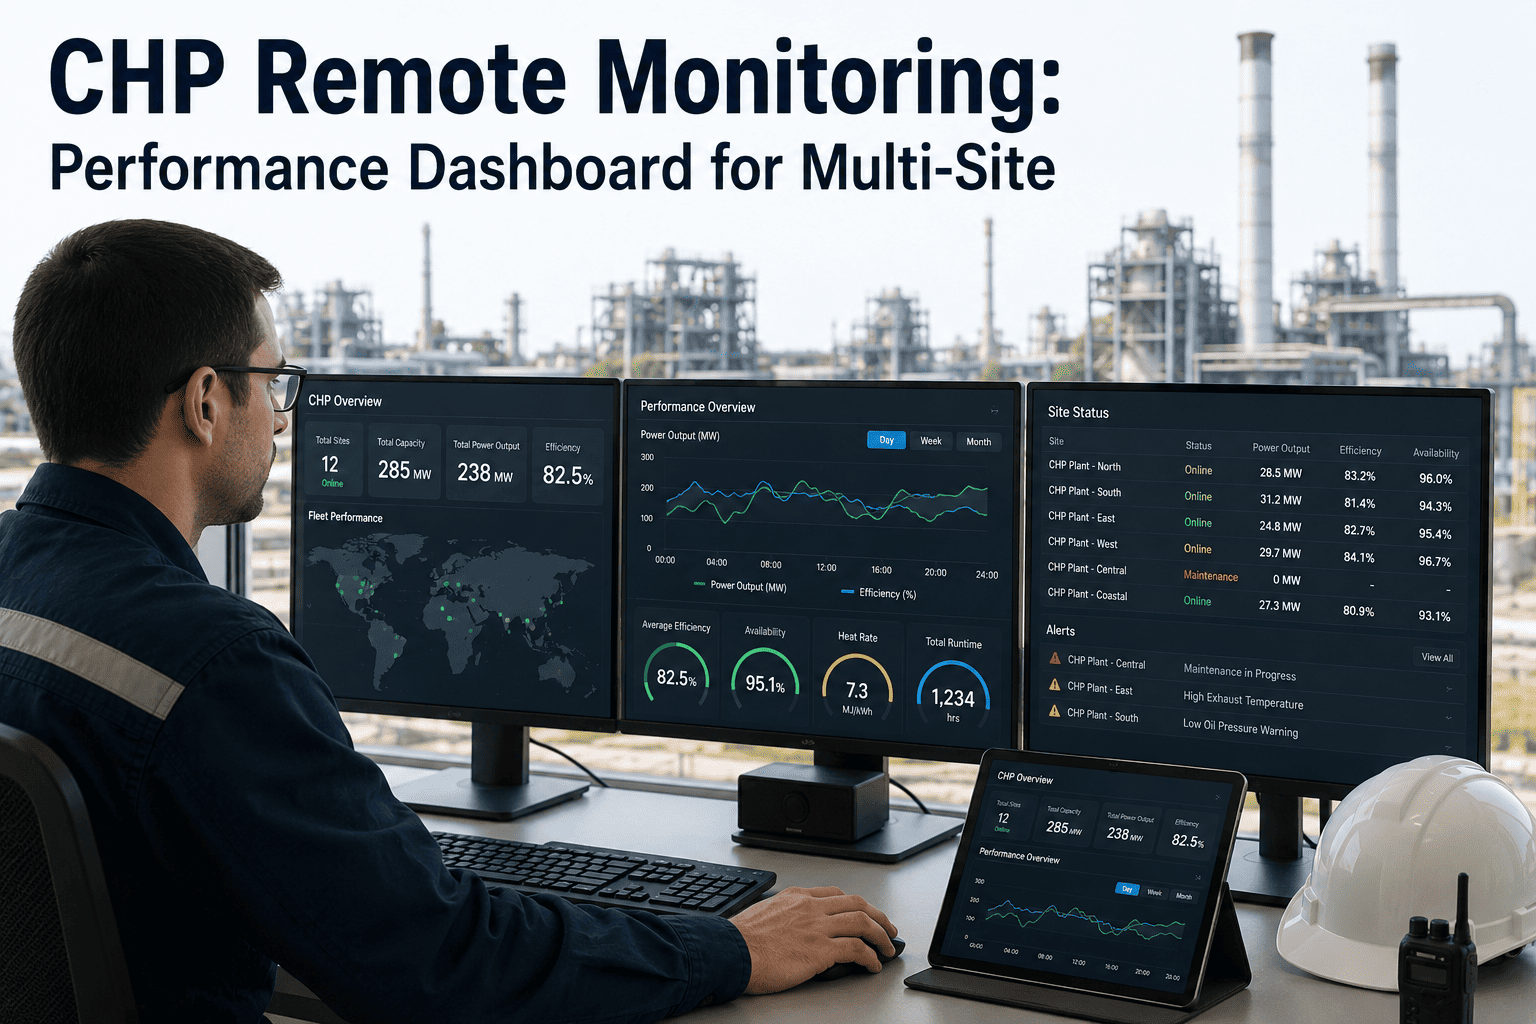
Two plants running the same turbine model, built the same year, can post forced outage rates that differ by a wide margin — and most fleet operators only discover this when a board member asks why one site consistently outperforms the rest. The answer is rarely a mystery once someone looks closely: it's a maintenance practice, a setpoint, or an operator habit that never made it past the site where it started. Fleet-wide AI benchmarking exists to surface exactly that gap and close it. Book a demo to see your own fleet's performance gaps surfaced automatically.
Find Out Which of Your Sites Is Quietly Underperforming
AI-powered fleet analytics compare reliability, efficiency, and cost metrics across every generation asset in your portfolio, so best practices at your top site can be identified and replicated everywhere else instead of staying trapped in one plant.
Fleet Snapshot
Top-performing site vs. fleet average: visible in one view
Underperforming assets flagged automatically, not manually
Best practices tagged for replication across every site
The Blind Spot Every Multi-Site Operator Has
Individually, every plant manager can tell you how their own site is performing. What almost no one has by default is a single, consistent view across the whole portfolio, using the same metric definitions, the same time windows, and the same data quality standards. Without that, "Site B is doing great" and "Site D is struggling" are impressions based on incident reports and quarterly calls, not on a fair comparison. Fleet benchmarking replaces impression with a consistent, continuously updated picture of exactly where the gaps are and how large they've become.
Four Dimensions Worth Benchmarking Across Every Site
Reliability
Forced outage rate, mean time between failures, and unplanned downtime hours, normalized so asset age and duty cycle don't distort the comparison.
Efficiency
Heat rate, capacity factor, and auxiliary power consumption, tracked against each site's own design baseline rather than a generic industry average.
Cost
Maintenance spend per megawatt-hour and parts inventory carrying cost, compared across sites running comparable equipment.
Safety
Near-miss reporting rate and corrective action closure time, since the highest-reliability sites are almost always also the safest ones.
What a Site Comparison Actually Looks Like
The value of fleet benchmarking becomes obvious the first time leadership sees a simple ranked view like the one below. It's not meant to shame a lagging site — it's meant to start a specific, evidence-based conversation about what the top performer is doing differently.
A composite reliability index like this pulls together forced outage rate, maintenance responsiveness, and downtime hours into one comparable number. Once Site D shows up consistently at the bottom, the next question becomes concrete: what is Site A doing in its lubrication program, its inspection cadence, or its spare parts strategy that the others aren't?
See Your Own Fleet Ranked
Get a Composite Performance View Across Every Site
Stop relying on quarterly reports and incident calls to know which sites need attention.
How Best Practices Actually Get Replicated Across Sites
1
Benchmarking identifies which site consistently leads on each metric, not just once, but across a sustained time window.
2
The platform surfaces what's different about that site's maintenance practices, setpoints, or operating procedures.
3
Operations leadership packages the practice into a standard procedure rather than an informal tip passed between managers.
4
Rollout progress and resulting metric improvement are tracked site by site, closing the loop on whether it actually worked.
Beyond the Numbers: Qualitative Signals Worth Tracking Too
Reliability, efficiency, cost, and safety numbers tell most of the story, but a handful of qualitative signals often explain the numbers before they even move. A site with unusually high operator turnover will typically start showing reliability decline months later, once institutional knowledge about that specific plant's quirks walks out the door. A site that leans heavily on contractors for routine maintenance work tends to have less consistent documentation than one with a stable in-house crew, which shows up eventually as gaps in failure history data. And a site with a genuinely strong safety reporting culture — meaning near-misses actually get logged rather than quietly handled — will often look worse on paper in the short term simply because it's reporting more honestly, which is exactly why these signals need to be read alongside the hard metrics, not instead of them.
Operator Turnover
High turnover at a site is a leading indicator of reliability decline, often showing up in the metrics months later.
Contractor Reliance
Heavy reliance on contract labor for routine maintenance often correlates with less consistent documentation over time.
Reporting Culture
A site with strong near-miss reporting may look worse on paper short-term simply for reporting more honestly.
Rolling Out Benchmarking Without Creating Site Resentment
How a fleet benchmarking program is introduced matters as much as the platform itself. Sites that find out they're being ranked only after the fact, with no context and no chance to explain local conditions, tend to disengage from the program entirely rather than learn from it. The rollouts that work best involve site managers early, frame the first few months as a calibration period rather than a performance judgment, and make clear that the purpose is identifying practices worth spreading — not building a case against underperforming teams.
1
Introduce the benchmarking program to site managers before it goes live, explaining the metrics and normalization approach directly.
2
Treat the first reporting cycle as calibration, correcting data quality issues before treating any ranking as final.
3
Frame every review around what the top site is doing well, not around penalizing whichever site ranks lowest.
Defining Metrics Consistently Across the Fleet
| Metric | Common Inconsistency | Fleet Benchmarking Fix |
| Forced outage rate |
Sites use different definitions of "forced" |
Single standardized definition applied fleet-wide |
| Maintenance cost per MWh |
Some sites exclude contractor labor |
Consistent cost categories across every site |
| Capacity factor |
Baselines vary by site age and duty cycle |
Normalized against each site's own design baseline |
| Near-miss reporting rate |
Under-reporting culture varies by site |
Trend tracked over time rather than absolute comparison |
Signs Your Fleet Needs This Now
Leadership relies on quarterly site visits or informal calls to know how a plant is really performing
One site consistently posts better numbers and nobody can explain exactly why
Best practices developed at one plant rarely make it into procedures at another
Metric definitions differ enough between sites that fleet-wide comparisons feel unreliable
Capital and staffing decisions are made without a consistent, data-backed view of relative site need
Frequently Asked Questions
How is fleet benchmarking different from the reporting we already get from each site?
Site-level reporting typically uses whatever metric definitions and time windows that site has always used, which makes cross-site comparison unreliable even when everyone is acting in good faith. Fleet benchmarking standardizes definitions and normalizes for factors like asset age and duty cycle, so the comparison is actually fair rather than an artifact of reporting differences.
Ask how metric normalization works in a demo.
Won't this just create friction between site managers who get compared publicly?
The goal is identifying replicable practices, not creating a leaderboard for its own sake, and most operators introduce benchmarking framed around learning from the top performer rather than penalizing the lowest one. In practice, site managers tend to respond better to a fair, data-backed comparison than to the informal reputation-based comparisons that already happen anyway.
How much historical data do we need before benchmarking produces reliable results?
Meaningful trends typically emerge within a few months of consistent data collection, though a full year of data helps account for seasonal variation in metrics like efficiency and outage patterns. The platform can start surfacing directional gaps well before a full year of history is available, with confidence increasing as more data accumulates.
Can this work across a fleet with mixed asset types, like thermal and renewable sites together?
Yes, though metrics need to be grouped sensibly — comparing a thermal plant's heat rate against a wind farm's capacity factor isn't meaningful, so benchmarking groups are typically organized by asset type first and then compared within that group.
Contact support to discuss your specific fleet composition.
What data does each site need to provide to participate in fleet benchmarking?
Typically historian data, CMMS maintenance records, and standard operational reporting that most sites already generate — the platform handles the normalization and comparison work rather than requiring sites to change how they collect data day to day. Onboarding a new site into an existing fleet benchmark usually takes a matter of weeks.
Stop Guessing Which Site Needs Attention
Benchmark Your Entire Fleet on One Consistent View
Identify your best-performing site's practices and replicate them across the rest of your portfolio.