A combined heat and power plant only earns its keep when both products it makes — electricity and heat — are actually being used, and that balance never holds still. Electrical demand, steam demand, fuel price, and ambient temperature all move against each other through the day, and a site running on yesterday's report is always a step behind. Operators managing several CHP sites from one office feel this most acutely, since a bearing that starts failing at 3 AM on one unit is invisible until someone happens to check that specific site. Book a session with the iFactory team to see what a connected multi-site view actually looks like.
CHP Heat & Power Imbalance · Remote Operations
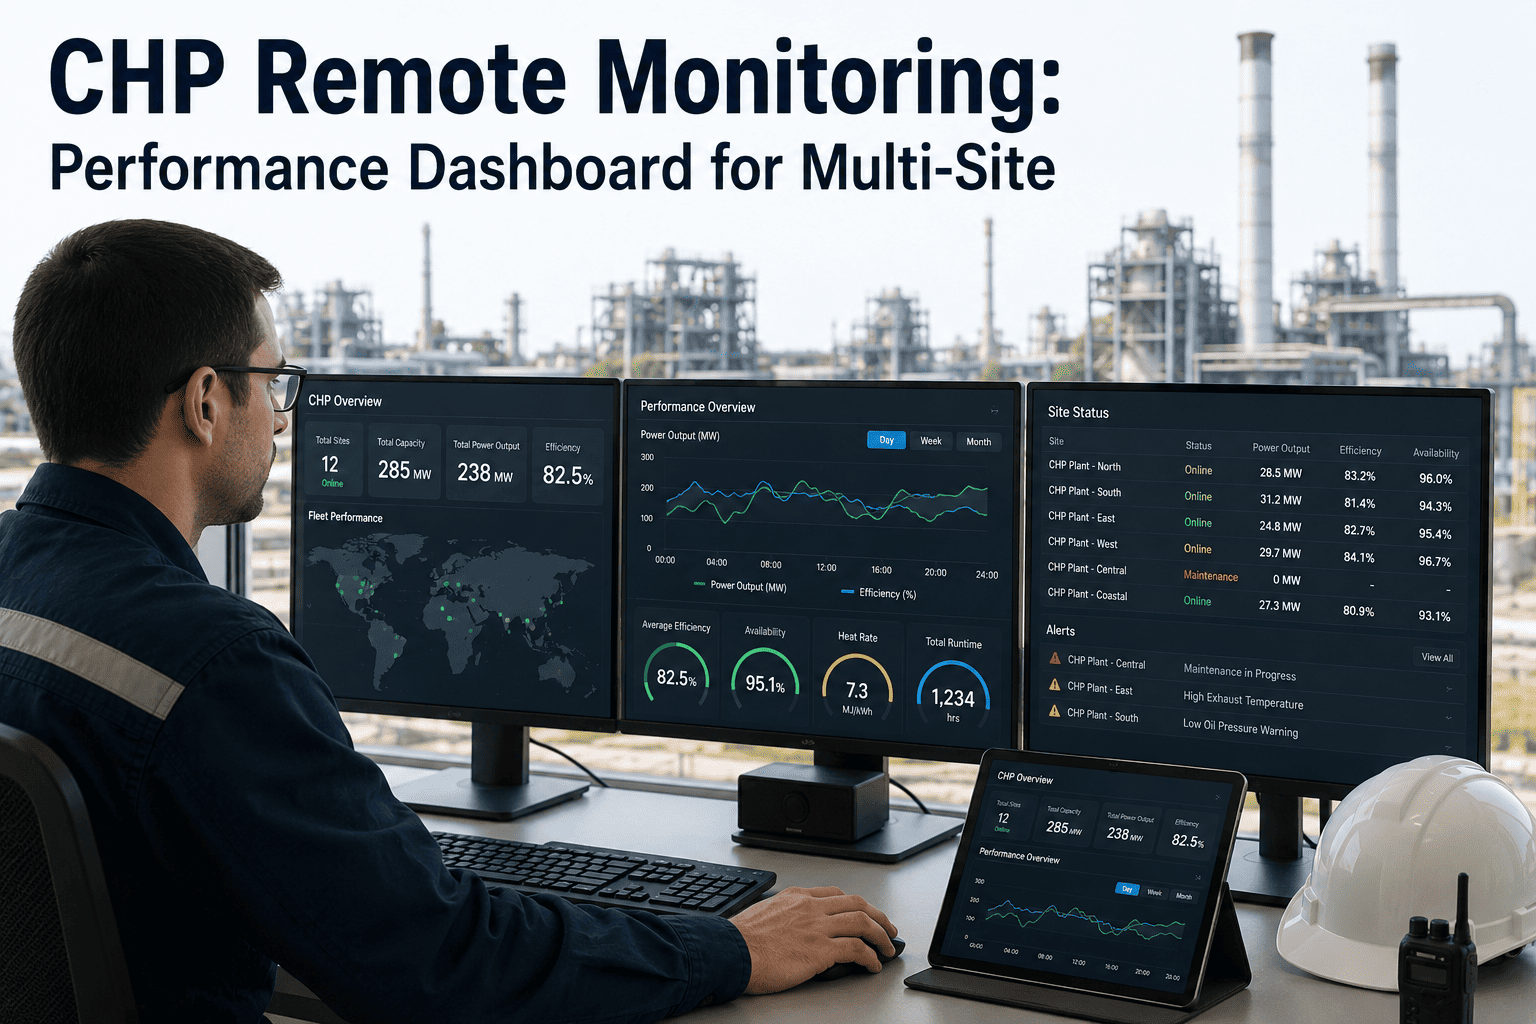
CHP Remote Monitoring: Building a Performance Dashboard That Covers Every Site at Once
KPI tracking, alarm management, and cross-site performance comparison for distributed CHP assets — so a developing fault on Site 4 doesn't wait for someone to notice it during a scheduled visit.
The Multi-Site Blind Spot
Why Site-by-Site Monitoring Fails Once You Have More Than One CHP Unit
Heat Gets Dumped While Fuel Keeps Burning
Without a live heat-to-power balance visible across sites, a unit can spend hours rejecting recoverable heat because the host process demand shifted and nobody caught it in time to adjust dispatch.
Faults Reach Shutdown Before Anyone Sees Them
A bearing or combustion fault developing overnight on one site is invisible until the next scheduled site visit, by which point it has often already forced a trip.
No Way to Compare Sites Against Each Other
Without a common dashboard, each site's performance is judged in isolation, so a unit quietly underperforming its sister sites by ten percent never gets flagged because there is nothing to compare it against.
Alarms Arrive Without Context
A raw alarm notification tells an operator something crossed a threshold, but not whether it is a developing trend worth acting on immediately or a transient blip — without trend context, alarm fatigue sets in fast.
What a Real Multi-Site Dashboard Covers
Four Capabilities a CHP Remote Monitoring Platform Needs to Actually Earn Its Place
Live Heat-to-Power Balance
A continuously updated view of electrical output against thermal recovery for every unit, so a site trending toward rejected heat is flagged before the fuel cost of that imbalance accumulates over a full shift.
Exhaust and Combustion Trend Monitoring
Tracking exhaust temperature spread across cylinders or thermocouples rather than watching only the peak reading — a slow widening spread over days is a far earlier warning of a developing combustion fault than any single alarm threshold.
Fleet-Wide KPI Comparison
The same performance indicators — heat rate, availability, spark spread — displayed side by side across every site, so underperformance at one location surfaces as a comparison rather than requiring someone to already suspect a problem.
Contextual, Prioritized Alarms
Alarms that arrive with the relevant trend attached, ranked by developing severity rather than a flat list, so an operations team covering many sites can tell within seconds which alert needs attention now.
See Every Site on One Screen
iFactory Connects Your Distributed CHP Fleet Into a Single Operations View
Instead of logging into a separate portal per site or waiting for a scheduled visit, iFactory surfaces heat-to-power balance, combustion trends, and prioritized alarms across your entire fleet in one place.
What to Track
Core KPIs for a Multi-Site CHP Operations Dashboard
| KPI | Indicator Type | Why It's Tracked in Real Time |
|---|---|---|
| Exhaust temperature spread | Leading | Flags a developing combustion fault before it reaches alarm threshold |
| Heat-to-power ratio | Leading | Shows whether the unit is earning its keep on both outputs |
| Header pressure stability | Leading | Protects host process steam supply agreements |
| Availability by site | Lagging | Confirms whether monitoring investment is translating into uptime |
The operators managing a fleet of five or more CHP sites almost always describe the same turning point — the day they stopped reacting to individual alarms from individual sites and started watching trends across the whole fleet at once. A single site's exhaust spread widening slowly over a week looks like noise in isolation, but the moment you can see three sites doing the same thing on the same fuel batch, it stops being a mystery and becomes an actionable pattern. That shift from single-site firefighting to fleet-level pattern recognition is where remote monitoring earns back its cost, not in any individual alarm it catches.
Odalys Feinberg-Achterberg
Power Generation Operations Specialist · 18 years supporting CHP, cogeneration, and distributed energy operations teams
Getting There
Deploying Fleet-Wide Monitoring Without Disrupting Sites Already in Operation
Phase 1 — Connectivity Assessment
Confirm what each site's control system already exposes through standard industrial protocols and identify any units still on older analog telemetry that will need a gateway device before they can report into a central platform.
Phase 2 — Establish Site Baselines
Before cross-site comparison means anything, each site needs a documented normal operating baseline for heat-to-power ratio, exhaust spread, and header pressure under its typical load and ambient conditions.
Phase 3 — Tune Alarm Thresholds Against Real Data
Generic vendor-default thresholds generate excessive noise in the first weeks; tuning against each site's actual baseline is what turns the dashboard from a source of alarm fatigue into one operators trust.
Phase 4 — Roll Out Fleet Comparison Views
Once every site is reporting reliably and alarms are tuned, the fleet-wide comparison view goes live, and this is typically when the first genuinely new pattern — a site quietly underperforming its peers — gets caught for the first time.
Operations Team Questions
CHP Remote Monitoring — Frequently Asked
How many CHP sites do we need before a fleet-wide dashboard becomes worth the investment over site-by-site monitoring?
The value curve starts climbing sharply at three or more sites, since that is roughly the point where comparing performance across units becomes genuinely more informative than watching any single site in isolation, and where the operational cost of logging into separate portals or waiting for scheduled visits starts to noticeably slow response time. Even a two-site operation benefits from a shared view, but the pattern-recognition value that catches developing faults early scales with fleet size. Book a demo to see how the dashboard scales with your specific fleet size.
Does remote monitoring replace the need for on-site staff at each CHP unit?
No — remote monitoring changes what on-site staff spend their time on rather than eliminating the need for them. Instead of routine walk-arounds hoping to catch a developing issue, on-site teams respond to specific, prioritized alerts with the relevant trend data already attached, which means less time spent on uneventful checks and more time on the visits that actually matter. Most CHP suppliers already offer some form of remote monitoring as part of a service package, but a fleet-wide operations dashboard extends that from a single-site advisory service into genuine cross-site visibility.
What does a fleet-wide CHP dashboard need in terms of data connectivity from each site?
Most CHP control systems already expose the core operating parameters — exhaust temperatures, header pressure, electrical and thermal output — through standard industrial protocols, so the typical integration effort centers on establishing a secure, reliable data link from each site to a central platform rather than instrumenting the units from scratch. Sites using older analog telemetry may need a gateway device to bridge the connection, which is a common and well-understood step rather than a major obstacle. Contact our support team for a connectivity assessment specific to your fleet's control systems.
How does alarm prioritization actually reduce alarm fatigue rather than just adding more alerts?
Alarm fatigue typically comes from a flat list of threshold-crossing notifications with no indication of which ones represent a genuinely developing problem versus a normal transient fluctuation, which trains operators to start ignoring alerts entirely. A dashboard that ranks alerts by trend severity and attaches the relevant history to each one lets an operator distinguish a slow, worsening pattern from a one-off blip in seconds, which is what actually restores trust in the alarm system rather than simply reducing the raw count of notifications sent.
Can a multi-site dashboard help us decide dispatch priorities when heat and power demand shift throughout the day?
Yes — that is one of the highest-value uses of a live, fleet-wide heat-to-power view, since dispatch decisions made without visibility into which sites are currently rejecting recoverable heat or running below their optimal ratio tend to default to simple megawatt targets that ignore the thermal side of the equation entirely. Surfacing that imbalance in real time gives operations teams the information needed to shift load toward the sites currently earning the most value from both outputs rather than just the one with spare electrical capacity.
Stop Discovering Problems at the Scheduled Site Visit
See Your Entire CHP Fleet's Performance in One Connected View
iFactory brings heat-to-power balance, combustion trends, and prioritized alarms from every CHP site into a single dashboard, so developing issues surface as patterns instead of waiting to be discovered one site at a time.