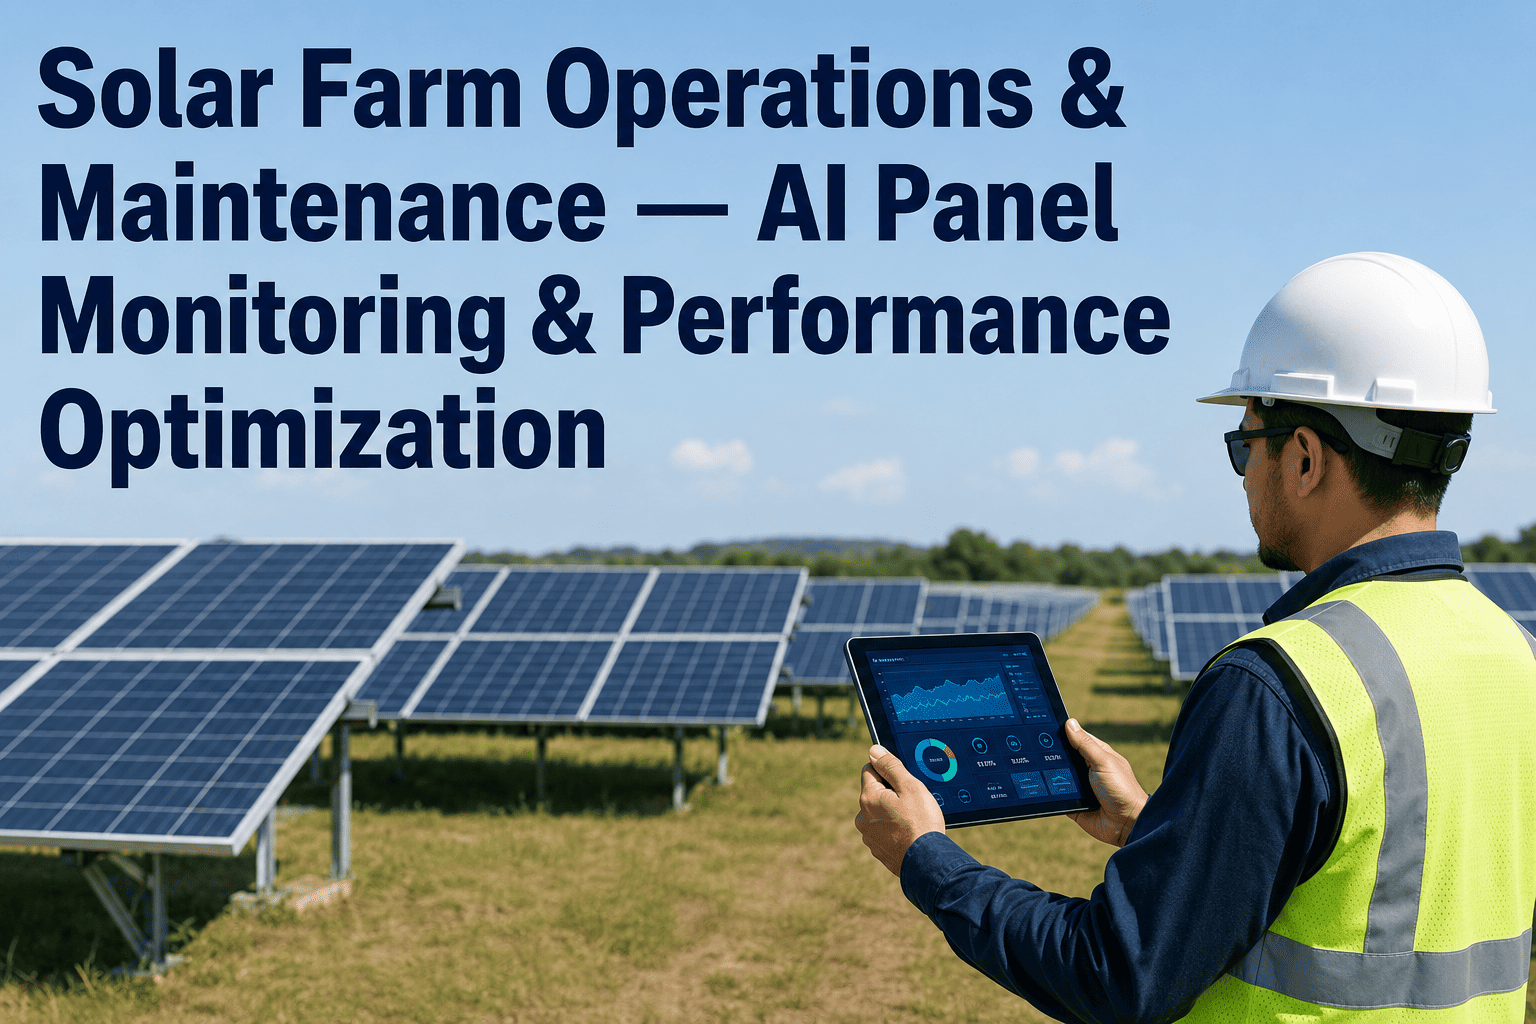
A solar farm doesn't fail all at once — it fades. A soiled string here, a drifting inverter fan there, a tracker motor a few degrees off true, each one quietly shaving a fraction of a percent off generation until a quarterly performance review shows a gap nobody can fully explain. Utility-scale operators running O&M on fixed inspection schedules are discovering that underperformance, unlike an outright fault, rarely trips an alarm. AI-powered panel and inverter monitoring is built to catch exactly that kind of loss, and you can book a demo to see it applied to your own portfolio.
SOLAR ASSET MANAGEMENT · UTILITY-SCALE PV
Stop Losing Generation to Faults You Can't See
iFactory monitors panels, inverters, trackers, and combiner boxes continuously, flags hot spots, soiling loss, and string failures the moment they start, and shows exactly which asset is costing you revenue right now.
The Hidden Loss Categories
Where Utility-Scale Solar Farms Quietly Lose Generation
Fixed-schedule inspections are built to catch failures — a tripped inverter, a snapped tracker cable — but most lost generation comes from degradation that never trips a fault code. A panel string losing 4% to soiling, a hot spot forming behind a partially shaded module, or an inverter running warm for three weeks before it finally derates — none of these show up on a monthly walk-down, and all of them compound across a portfolio of thousands of modules.
Soiling & Dust Accumulation
Up to 8–12% seasonal loss
Hot Spots & Cell Mismatch
3–6% panel-level loss
Inverter Derating & Downtime
Largest single loss driver
Tracker Misalignment
2–4% yield loss per axis error
String & Combiner Faults
Often undetected for weeks
Monitoring Coverage
One Platform Across Every Layer of the Site
Panels, inverters, trackers, and combiner boxes each fail differently and each need a different monitoring approach. A platform built for utility-scale solar has to watch all four layers at once and understand how a problem in one cascades into losses in another.
Module Layer
Panel & String Performance
Continuous string-level current and voltage comparison against expected output for current irradiance, flagging soiling trends, partial shading, and degrading modules before they drag down the whole string.
Power Conversion
Inverter Health
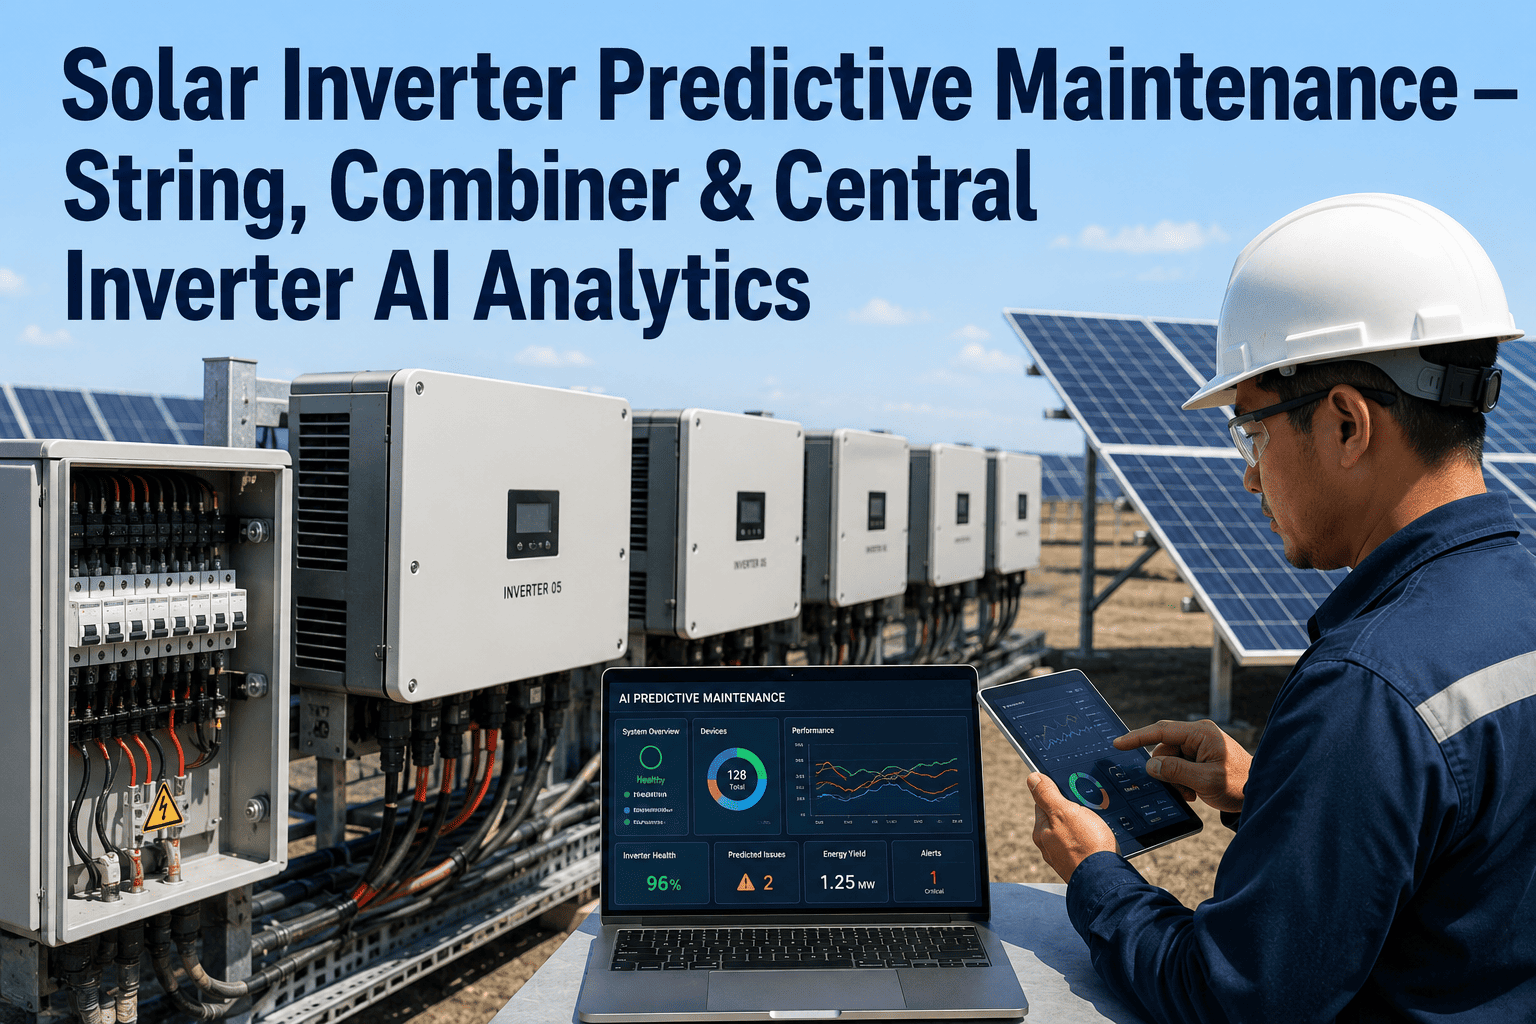
Internal temperature, voltage ripple, and switching pattern analysis that catches a failing fan or degrading capacitor weeks before the unit derates or shuts down completely during peak generation hours.
Mechanical
Tracker Alignment
Position feedback compared against expected solar angle for time and location, catching motor drift, gearbox wear, and stow-command failures that quietly cost yield without ever registering as a hard fault.
Electrical Balance
Combiner Box & Wiring
Fuse and connection monitoring across combiner boxes to catch loose terminations, ground faults, and DC arc risk before they escalate into a safety event or a full string outage.
Maturity Model
Where Your O&M Program Sits Today
Solar O&M programs tend to fall into one of three stages. Knowing which one describes your current operation is the fastest way to identify where the next round of generation gains is actually available.
Scheduled Walk-Downs
Technicians inspect on a fixed calendar. Faults are caught only if they happen to be visible or active during the visit. Underperformance between visits goes undocumented.
Basic Remote Monitoring
SCADA or inverter-vendor dashboards show current production against yesterday's, but rarely explain why output dropped or which specific asset is responsible.
AI-Driven Predictive O&M
Every layer of the site is benchmarked against expected performance continuously, with root-cause attribution and a prioritized work order the moment a deviation appears.
SEE YOUR OWN PORTFOLIO
Find Out Exactly How Much Generation You're Losing Today
Bring your site data and our team will walk through a live breakdown of soiling, hot spot, and inverter loss patterns specific to your portfolio during the call.
Performance Benchmark
Reactive O&M vs. AI-Driven Monitoring — Site Performance Comparison
The following comparison reflects typical performance differences between utility-scale sites running scheduled inspections versus continuous AI-driven monitoring across panels, inverters, and trackers.
Solar O&M Performance Comparison — Utility-Scale PV
From Alert to Work Order
How a Deviation Turns Into a Dispatched Fix
A performance alert on its own doesn't save a truck roll — it's the root-cause attribution and prioritization behind it that decides whether a crew gets sent to the right panel row on the first visit instead of the third.
Deviation Isolated
Output for a specific string, inverter, or tracker row is compared against expected performance for current irradiance and against neighboring assets under the same conditions, isolating exactly where the loss originates.
Cause Classified
The deviation's shape and timing are matched against known patterns for soiling, shading, hot spots, inverter thermal issues, or tracker drift, so the alert arrives with a probable cause rather than a bare number.
Value at Risk Calculated
Estimated daily generation loss in kWh is attached to the alert, converting a technical deviation into a dollar figure that can be weighed directly against the cost of a truck roll.
Work Order Routed
Field-Ready
A prioritized work order with the affected asset ID, probable cause, and recommended action is routed to the field team, ranked against every other open alert across the portfolio by generation value at risk.
Frequently Asked Questions
Solar Farm Monitoring & O&M — Common Questions
Will this work with the inverter and monitoring hardware we already have installed?
Yes, in most cases. The platform is built to be hardware-agnostic and pulls data from major inverter brands, data loggers, and SCADA systems already deployed on site, so there's typically no need to rip out existing equipment. During onboarding, our team maps your current data sources and identifies any gaps in sensor coverage that would be worth closing to improve prediction accuracy, particularly for tracker position feedback and combiner-level monitoring.
How does the platform tell the difference between weather-related underperformance and an actual fault?
The system builds a performance baseline for each asset under current irradiance, temperature, and cloud conditions, then flags deviations from that expected baseline rather than comparing raw output day to day. A cloudy day that reduces output across the entire site looks completely different in the data from a single string underperforming its peers under identical weather — which is exactly the kind of deviation that points to a real equipment problem.
Can this reduce our soiling-related wash costs instead of just detecting the loss?
Yes. Rather than washing every panel on a fixed calendar regardless of actual soiling level, the platform tracks soiling accumulation per zone based on measured performance loss and recommends washing only where the recovered generation value justifies the cost. Sites running condition-based wash scheduling typically reduce total wash events while recovering more generation, since the crews go where the soiling loss is actually concentrated.
How quickly can we see meaningful data after connecting a site?
Initial performance baselines and fault detection typically become active within one to two weeks of connecting a site's data feeds, since the platform can start comparing real-time output against expected performance almost immediately. Predictive failure modeling for inverters and trackers improves over the following four to eight weeks as the system accumulates enough operating history to distinguish normal variation from early warning signs.
Do you support multi-site portfolios with different equipment vendors at each site?
Yes, this is one of the most common deployment patterns we support. The platform normalizes data across different inverter and tracker vendors into a single fleet-wide view, so asset managers can benchmark site performance against each other regardless of the underlying hardware. If you manage a mixed-vendor portfolio,
contact support and our team can walk through your specific equipment mix before onboarding.
SOLAR O&M · AI PANEL MONITORING · 2026
Give Every Panel, Inverter, and Tracker a Continuous Health Score
See how iFactory catches soiling loss, hot spots, inverter degradation, and tracker drift before they show up as a missed generation target.