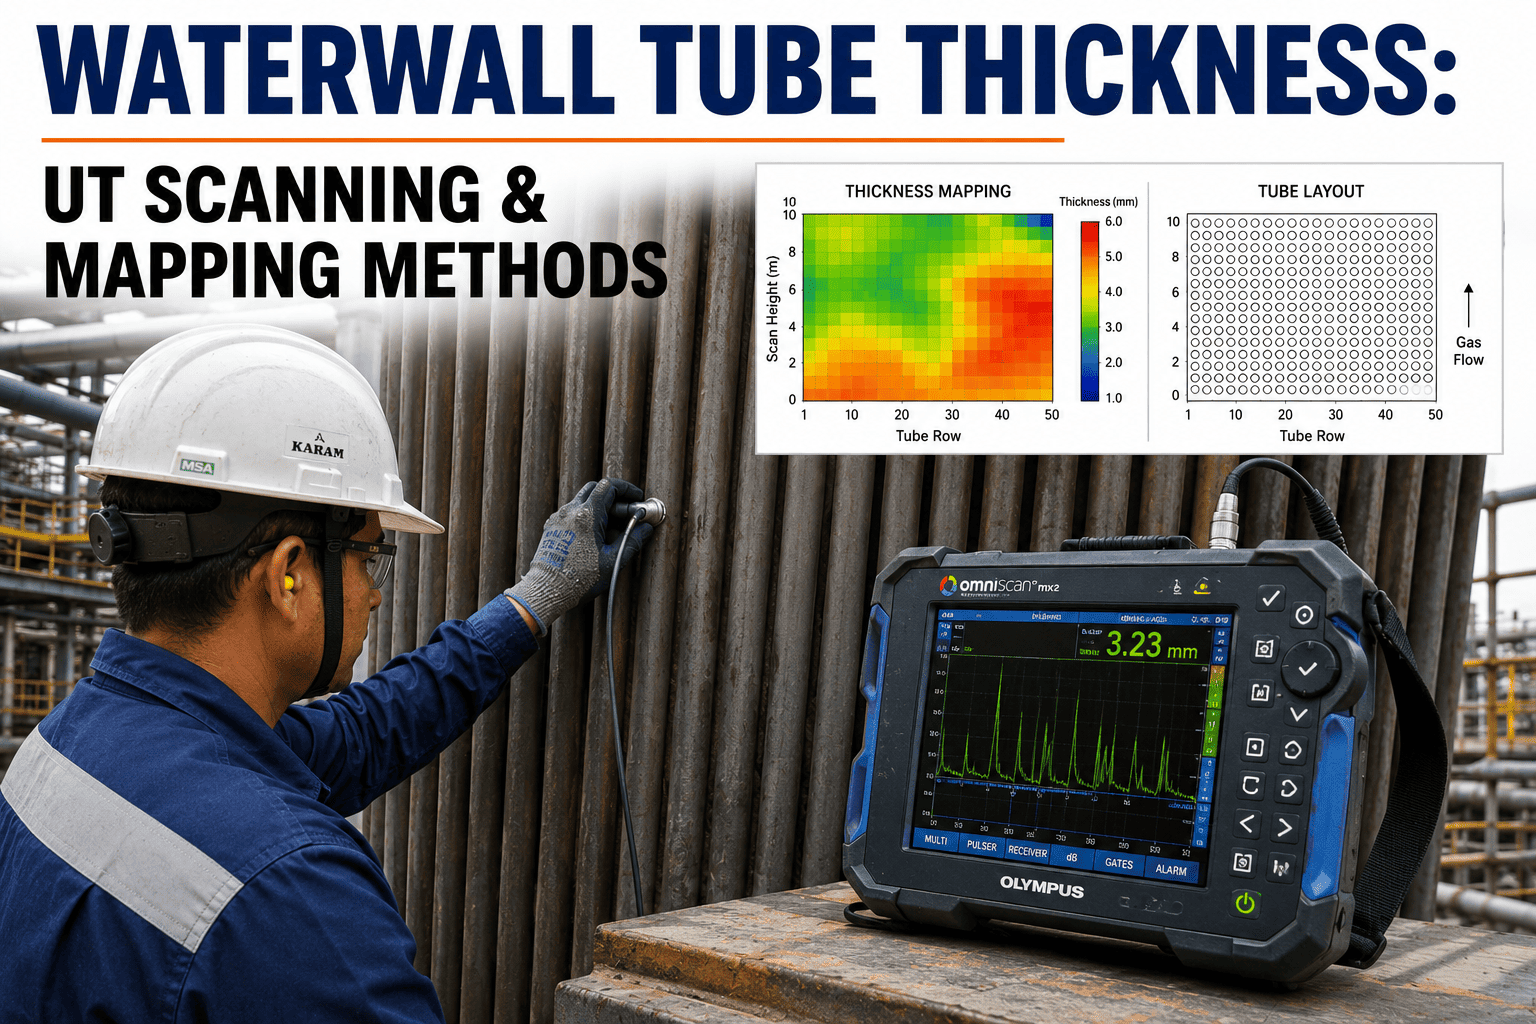
Waterwall tubes operate under the harshest conditions inside any boiler furnace. They face direct flame impingement, slag buildup, erosive fly ash, and corrosive combustion gases simultaneously across thousands of feet of tubing. Thinning happens gradually and invisibly, often reaching critical levels before any external sign appears during a visual walkthrough. The only reliable way to know actual remaining wall thickness is through UT scanning, and the only way to use that data effectively is through systematic mapping that turns individual point readings into a tube-by-tube condition picture. See how iFactory structures tube thickness data into actionable maps by visiting iFactory-support.
Boiler Inspection · Tube Thickness
Waterwall Tube Thickness Measurement Without the Guesswork
UT scanning converts invisible wall loss into a measurable number. Mapping converts scattered numbers into a furnace-wide picture your team can actually plan around.
Thinning Patterns
Where Waterwall Tubes Lose Wall Thickness First
Thinning is never uniform across a waterwall. Specific furnace zones experience accelerated loss due to localized heat flux, slag chemistry, or gas velocity. Knowing which zones to scan first and what thinning pattern to expect in each one is what separates a useful survey from a wasted outage day.
Zone A
Burner Elevation
Highest Thinning Rate
Direct flame contact and highest heat flux in the furnace cause rapid external wall loss through oxidation and spalling of the protective oxide layer
Zone B
Soot Blower Lanes
Erosion-Dominated Loss
Repeated high-velocity steam cleaning strips slag and base metal from the outer wall surface, creating localized thinning tracks aligned with blower nozzle paths
Zone C
Upper Furnace / Nose
Corrosion-Dominated Loss
Reducing atmosphere conditions combined with sulfur and chlorine in the flue gas accelerate external corrosion, especially where slag layers trap corrosive species against the tube
Zone D
Lower Waterwall Below Burners
Moderate but Steady Loss
Lower heat flux than burner zone but extended exposure to falling slag and ash produces a slower but consistent thinning rate that accumulates over long operating intervals
Scanning Approaches
UT Scanning Methods for Waterwall Tube Assessment
Not all UT scanning approaches produce the same data quality or coverage density. The method you choose determines how much of the tube surface you actually see and how reliable your remaining wall thickness number really is.
Manual Point UT
Spot Measurement
CoverageSingle point per placement
Speed15-30 seconds per reading
Data DensityLow, relies on inspector judgment
Best ForSpot checks on known problem areas
LimitationCan miss localized thinning between points
Automated UT Crawler
Continuous Scan
CoverageContinuous line along tube length
Speed2-5 feet per minute
Data DensityHigh, captures profile along scan path
Best ForFull-length tube surveys during outages
LimitationRequires clean surface and scaffold access
Phased Array UT
Area Imaging
CoverageArea scan with cross-section view
SpeedModerate, depends on area size
Data DensityVery high, shows internal profile
Best ForDetailed assessment of suspect areas
LimitationHigher equipment cost and training need
Data Interpretation
What the Thickness Number Actually Means
A raw UT reading means nothing without context. The same measured thickness can be perfectly safe on one tube and require immediate replacement on another depending on original wall, design minimum, and thinning rate. These four categories give every reading a clear action meaning.
Normal
Above 110% of Design Minimum
No action required. Continue standard inspection interval and track thickness for trending data.
Watch
100% to 110% of Design Minimum
Add to increased-frequency inspection list. Calculate thinning rate from historical data to project remaining operating hours.
Critical
90% to 100% of Design Minimum
Plan replacement at next scheduled outage. Restrict operating conditions if thinning rate suggests it may not survive to the next planned stop.
Action
Below 90% of Design Minimum
Replace before returning to service. Do not defer. Document location and mechanism to assess whether adjacent tubes require immediate scanning.
Mapping Process
Turning UT Readings Into a Furnace-Wide Thickness Map
Individual thickness numbers stored in a spreadsheet tell you about one point on one tube at one moment. A thickness map tells you where the problem areas are, how large they are, and whether they are growing between outages. This is the step that converts inspection data into maintenance decisions.
01
Define Scan Grid
Establish row numbers, elevation intervals, and circumferential clock positions so every reading has a repeatable location reference across outages
02
Execute UT Survey
Collect thickness readings at each grid point using the selected scanning method, recording actual measured values against the predefined coordinate system
03
Load and Validate
Import readings into the mapping system, flag outliers for recheck, and verify that grid coverage meets the minimum density requirement for the area being assessed
04
Generate Map
Produce a color-coded thickness map showing every measured point against design minimum, making thinning patterns visible as contiguous areas rather than isolated numbers
05
Calculate Rate and Life
Compare current readings against previous outage data at the same grid points to determine thinning rate in mils per thousand hours and project remaining service life
06
Issue Repair Plan
Flag all tubes below the action threshold for replacement, list watch-list tubes for increased monitoring, and adjust the next inspection scope based on mapped trends
Stop Guessing Which Tubes to Replace Based on Outage Visuals Alone.
iFactory ingests your UT thickness data, maps it to tube locations, calculates thinning rates, and produces a clear replace-or-monitor recommendation for every scanned tube before you close the scaffold.
Remaining Life
From Thinning Rate to Remaining Operating Hours
A single thickness measurement tells you the current state. Two measurements taken at the same location during different outages tell you the thinning rate. Three or more measurements let you project remaining life with confidence and plan replacements on your schedule instead of on a forced outage.
Single Reading
Gives you current wall thickness at one point in time. You can compare it to design minimum but cannot determine how fast the tube is thinning or when it will reach the action threshold.
Current State Only
Two Outage Comparison
Subtracting the earlier reading from the current reading and dividing by operating hours between outages yields a thinning rate in mils per thousand hours, enabling a linear life projection.
Rate Established
Three or More Data Points
Multiple readings confirm whether thinning is linear or accelerating, validate the rate calculation, and give engineering confidence in the remaining life number used for replacement planning.
Confident Projection
Integrated with Operating Data
When thickness trends are correlated with load history, fuel switches, and water chemistry changes, the projection accounts for operational variables that raw trending alone cannot capture.
Operational Awareness
Common Questions
Waterwall UT Scanning and Mapping — Frequently Asked
How often should waterwall tubes be scanned for thickness?
Scanning frequency depends on the thinning rate observed in each zone and the margin between current thickness and the design minimum. Zones with high thinning rates and thin margins may need scanning every outage, while stable zones in the lower furnace can go two to three outages between surveys. The mistake most plants make is scanning the entire waterwall at the same frequency regardless of zone, which wastes time on stable areas while potentially under-inspecting the most aggressive thinning zones. A zone-based scanning schedule driven by actual thinning rate data is far more efficient than a uniform interval applied across the entire furnace.
Book a demo to see how iFactory automates zone-based inspection scheduling.
What surface preparation is required before UT scanning waterwall tubes?
Manual point UT requires a clean, bare metal surface at each measurement point, which means removing slag, paint, and oxide scale with a grinder or wire brush before coupling the transducer. Automated crawlers need a continuous clean strip along the scan path, which is significantly more preparation but produces far more data per hour of scaffold time. Phased array systems are the most sensitive to surface condition because the quality of the image depends on consistent coupling across the array footprint. The practical reality is that surface preparation often takes longer than the actual scanning, so choosing a method that maximizes data per prepared foot of tube is critical for outage productivity.
Contact support for guidance on optimizing your scan-to-prep ratio.
How accurate are UT thickness readings on waterwall tubes in the field?
Field UT accuracy on waterwall tubes typically ranges from plus or minus 2 to 5 thousandths of an inch depending on surface condition, tube curvature, oxide scale on the inner wall, and the skill of the technician. Readings taken through intact internal oxide scale will measure slightly higher than the actual base metal thickness, which can mask thinning if the scale is thick and not accounted for. The most reliable approach is to use the same equipment, same technician, and same coupling method at each outage so that trend data remains consistent even if the absolute number carries a small systematic offset. What matters most for replacement decisions is not the absolute accuracy of a single reading but the consistency of the measurement method across successive outages.
Book a demo to see how iFactory normalizes thickness data across inspection campaigns.
Can thickness mapping predict where the next failure will occur?
Mapping cannot predict the exact location of a sudden short-term overheating failure because that mechanism is driven by an acute event like flow blockage rather than gradual wall loss. However, mapping is highly effective at predicting where long-term thinning mechanisms will eventually produce a leak, because those mechanisms remove wall material at a measurable rate that can be projected forward in time. The real power of mapping is identifying the boundary of a thinning area so you know not just which tube to replace but how many adjacent tubes are approaching the same condition and need to be included in the replacement scope. Plants that map systematically almost never discover additional thin tubes during the replacement cut-out that were not identified in the survey data.
Contact support to discuss setting up a mapping program for your next outage.
What is the minimum number of readings needed per tube for a reliable map?
The minimum depends on the thinning mechanism and the variability of wall loss across the tube surface. For uniform thinning like fireside corrosion, three to four readings per tube at consistent circumferential positions may be sufficient to characterize the condition. For localized thinning like soot blower erosion, you need enough readings to define the width and depth of the erosion track, which typically means a reading every two to three inches across the affected zone. The practical rule is that any area showing a reading below 110 percent of design minimum should be scanned at higher density to accurately define the extent of thinning before making a replace-or-defer decision. Automated crawlers solve this problem by collecting continuous data, eliminating the need to decide on point spacing in advance.
Book a demo to explore how iFactory handles variable-density scan data.
Map Every Tube. Know Every Thickness. Replace What Needs Replacing.
UT data ingestion, zone-based mapping, thinning rate calculation, and remaining life projection, built for the way waterwall inspections actually run during a boiler outage.